ICT Tools and PSI Full Version in one
- 지표
- 버전: 4.1
- 업데이트됨: 19 2월 2024
- 활성화: 5

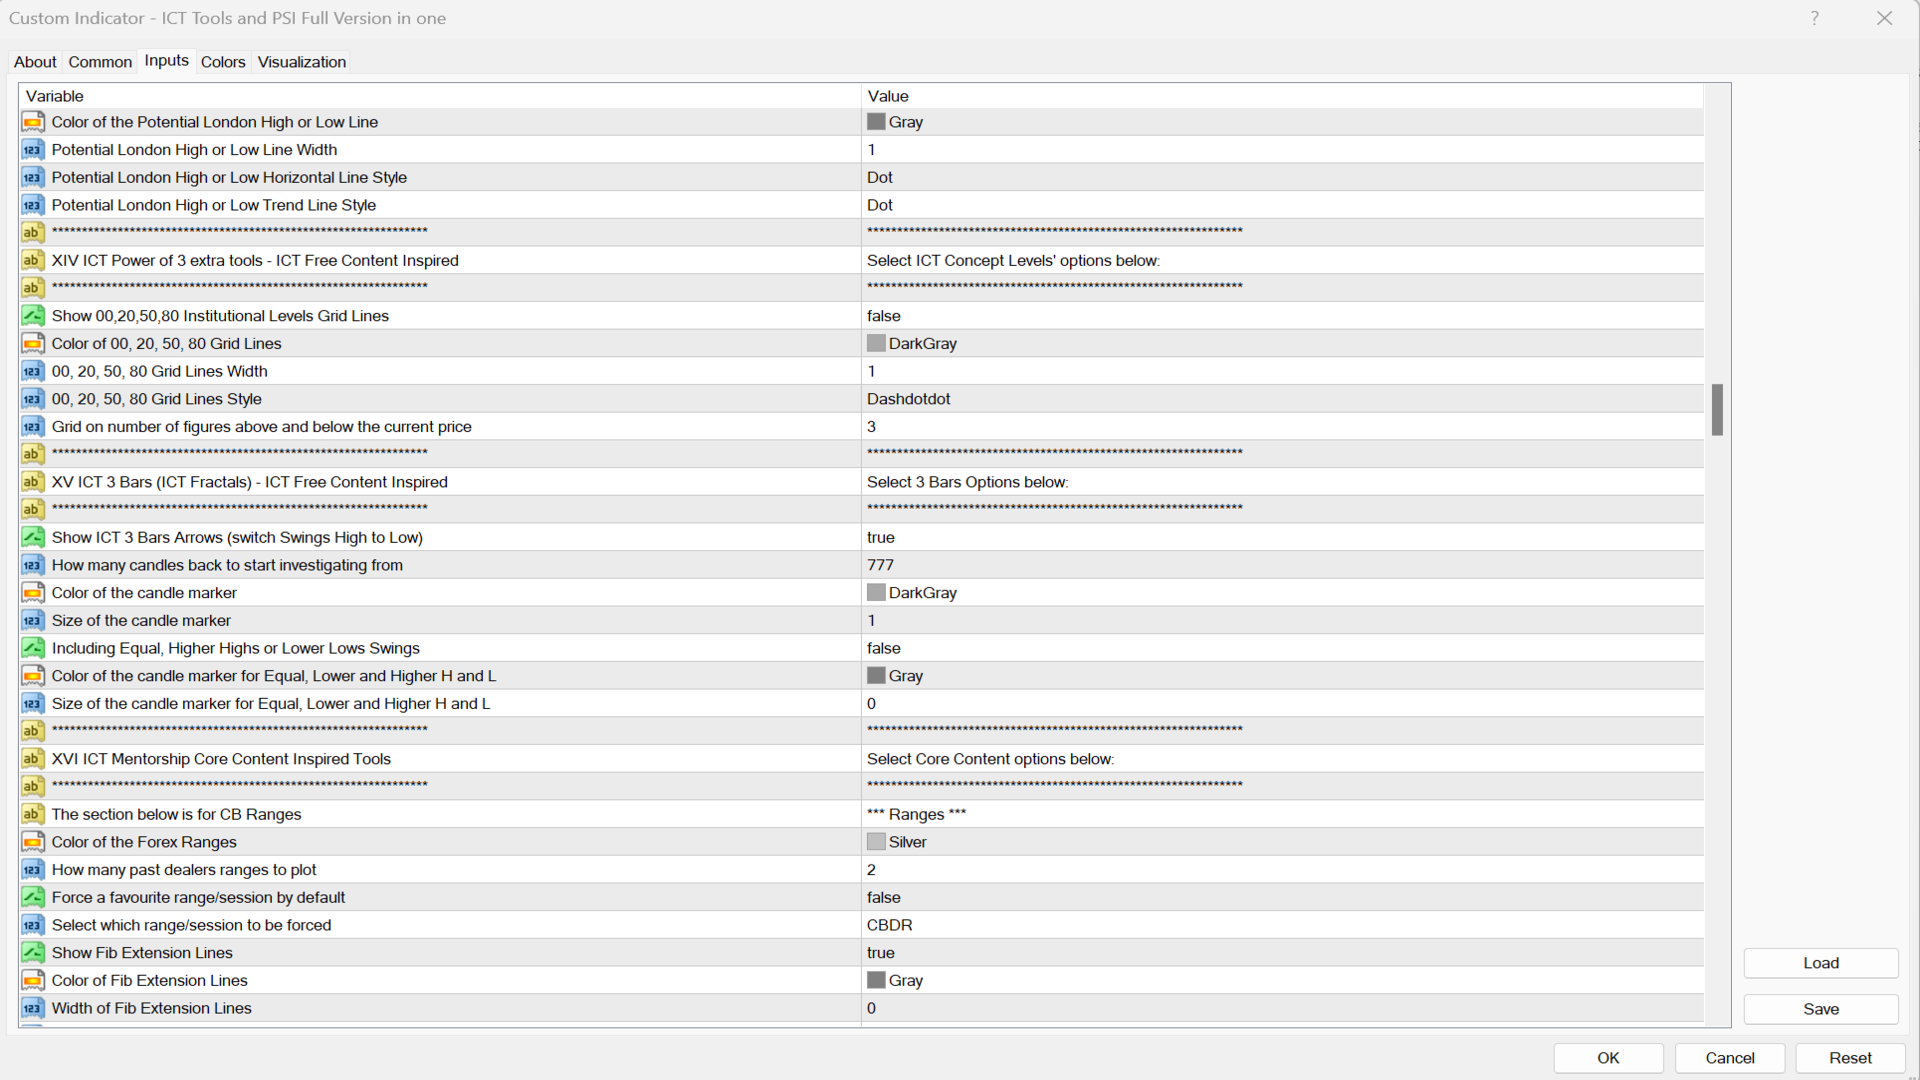
ICT Core Content Concepts turned into indicator plus all previous tools known from the Position Smart Indicator. This makes it the Full PSI Private Version (read more) restricted up to now but available only after the Mentorship Core Content was made public on YouTube.
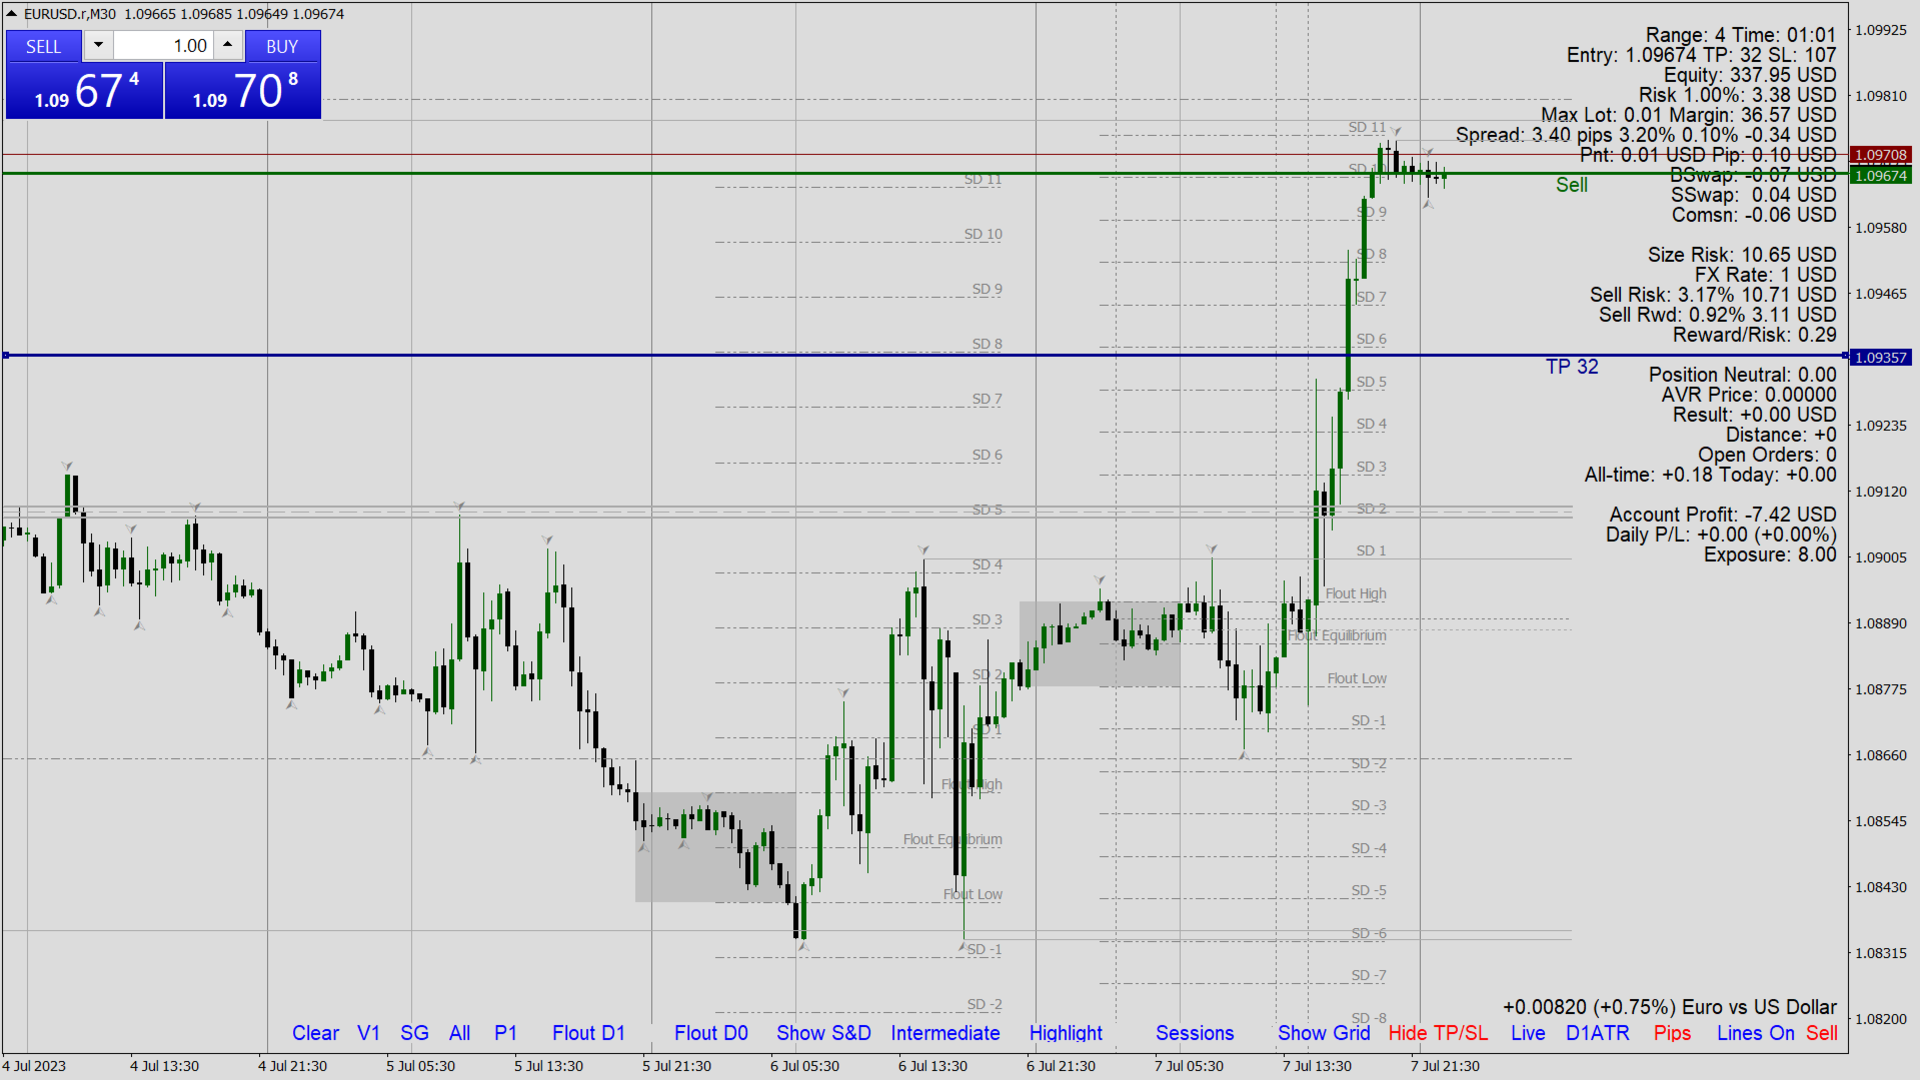
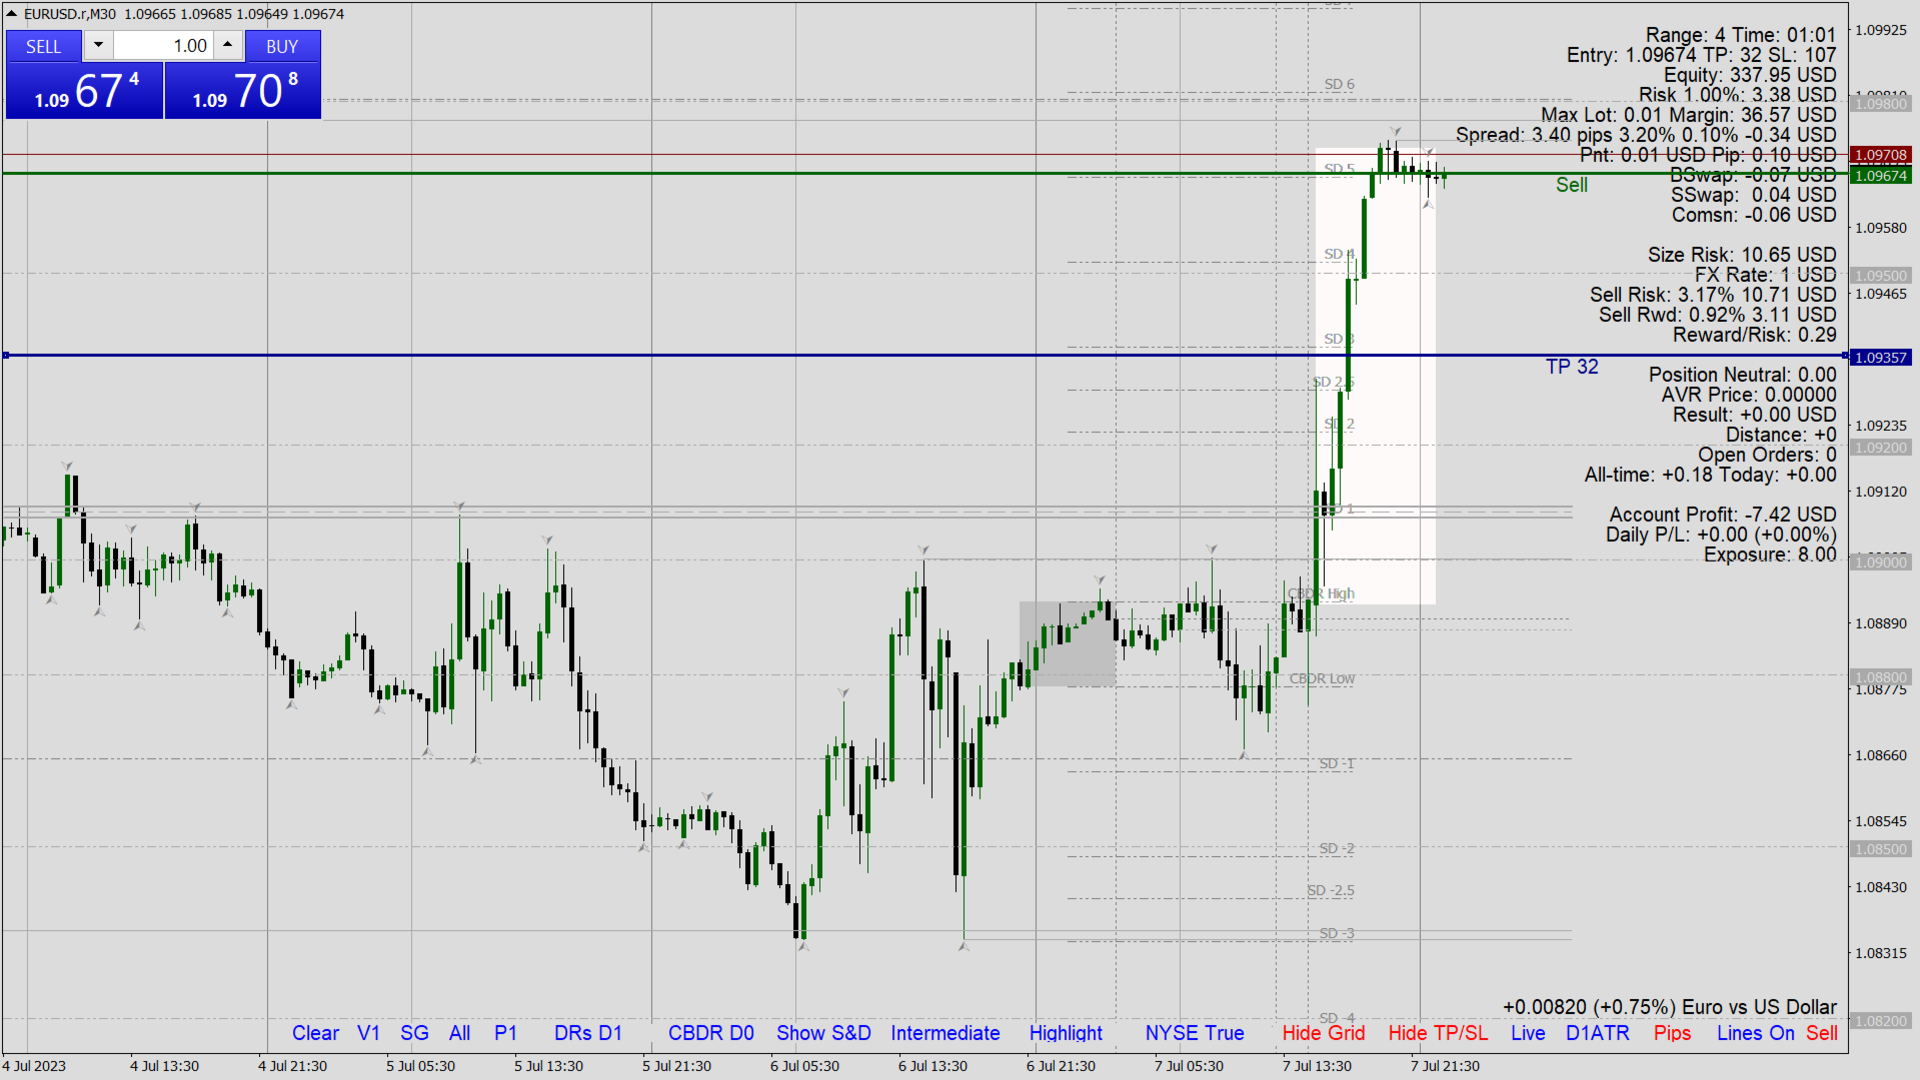
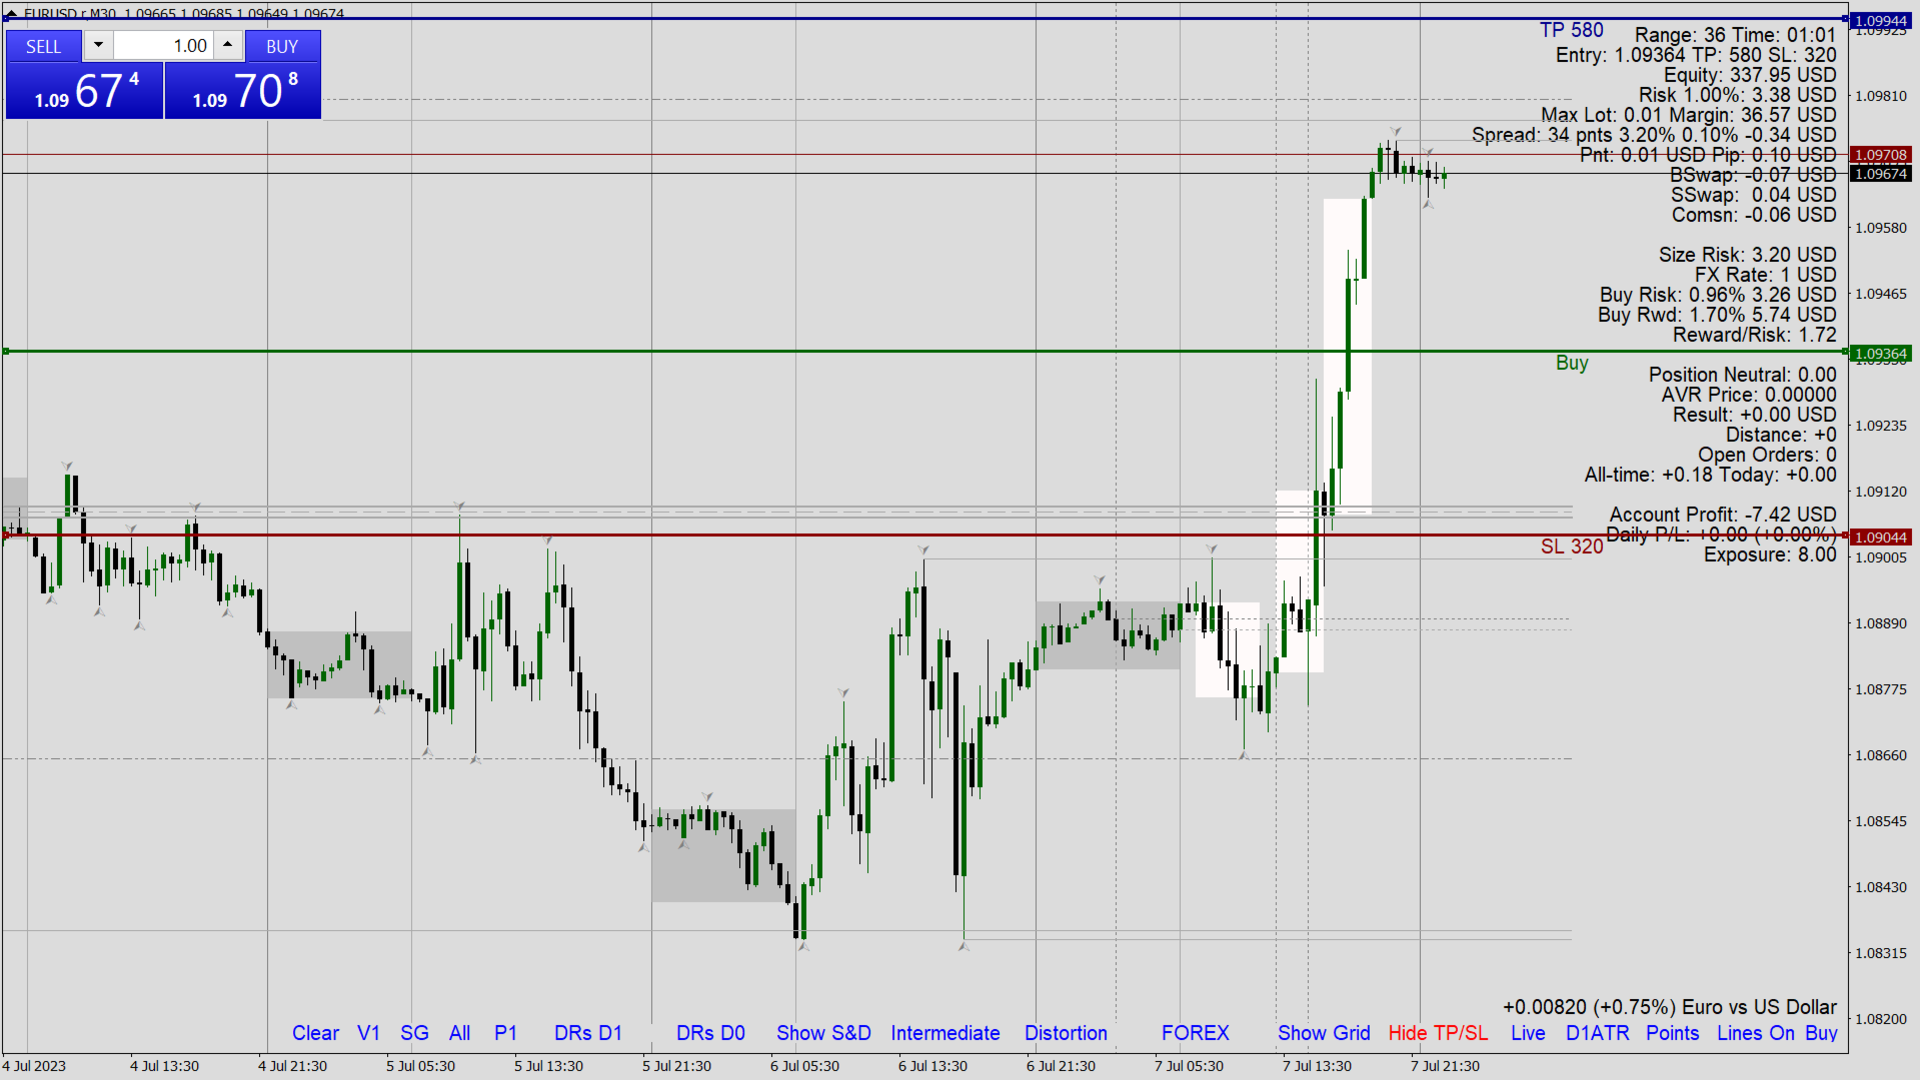
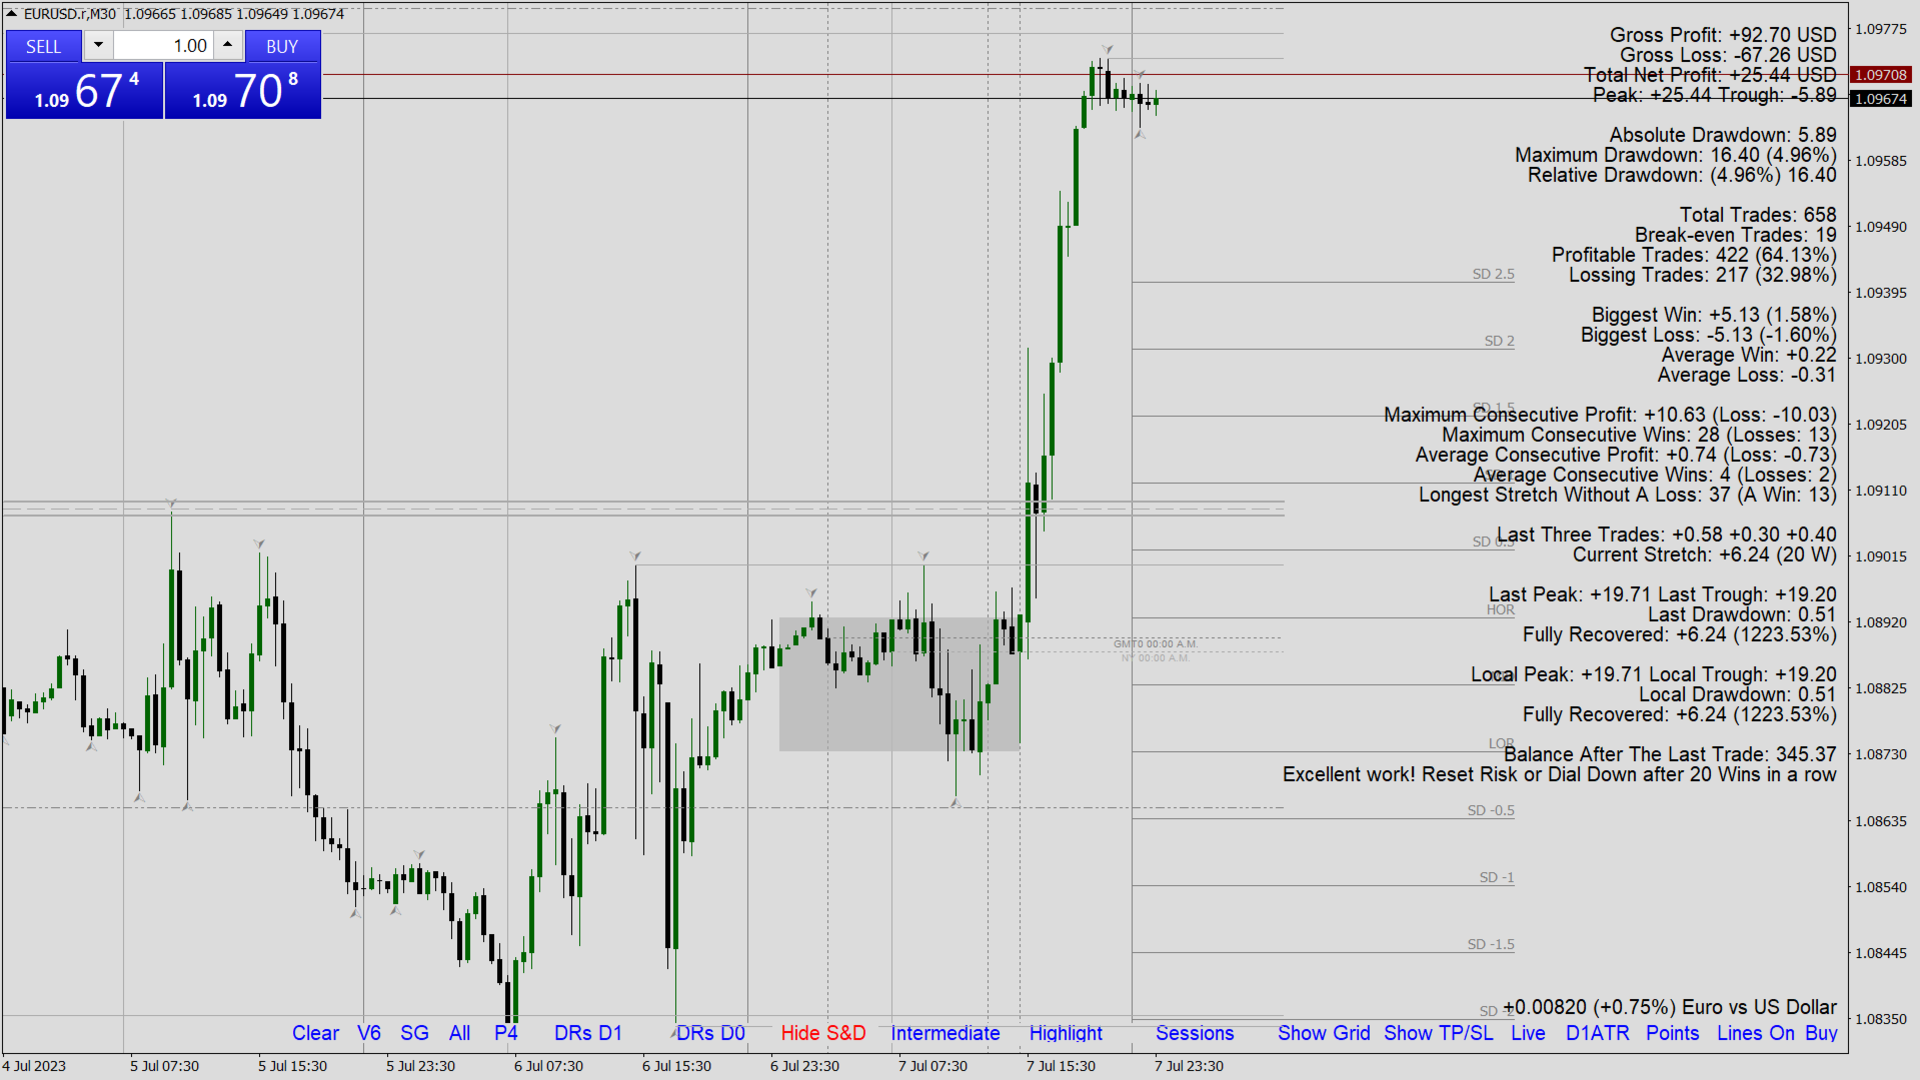
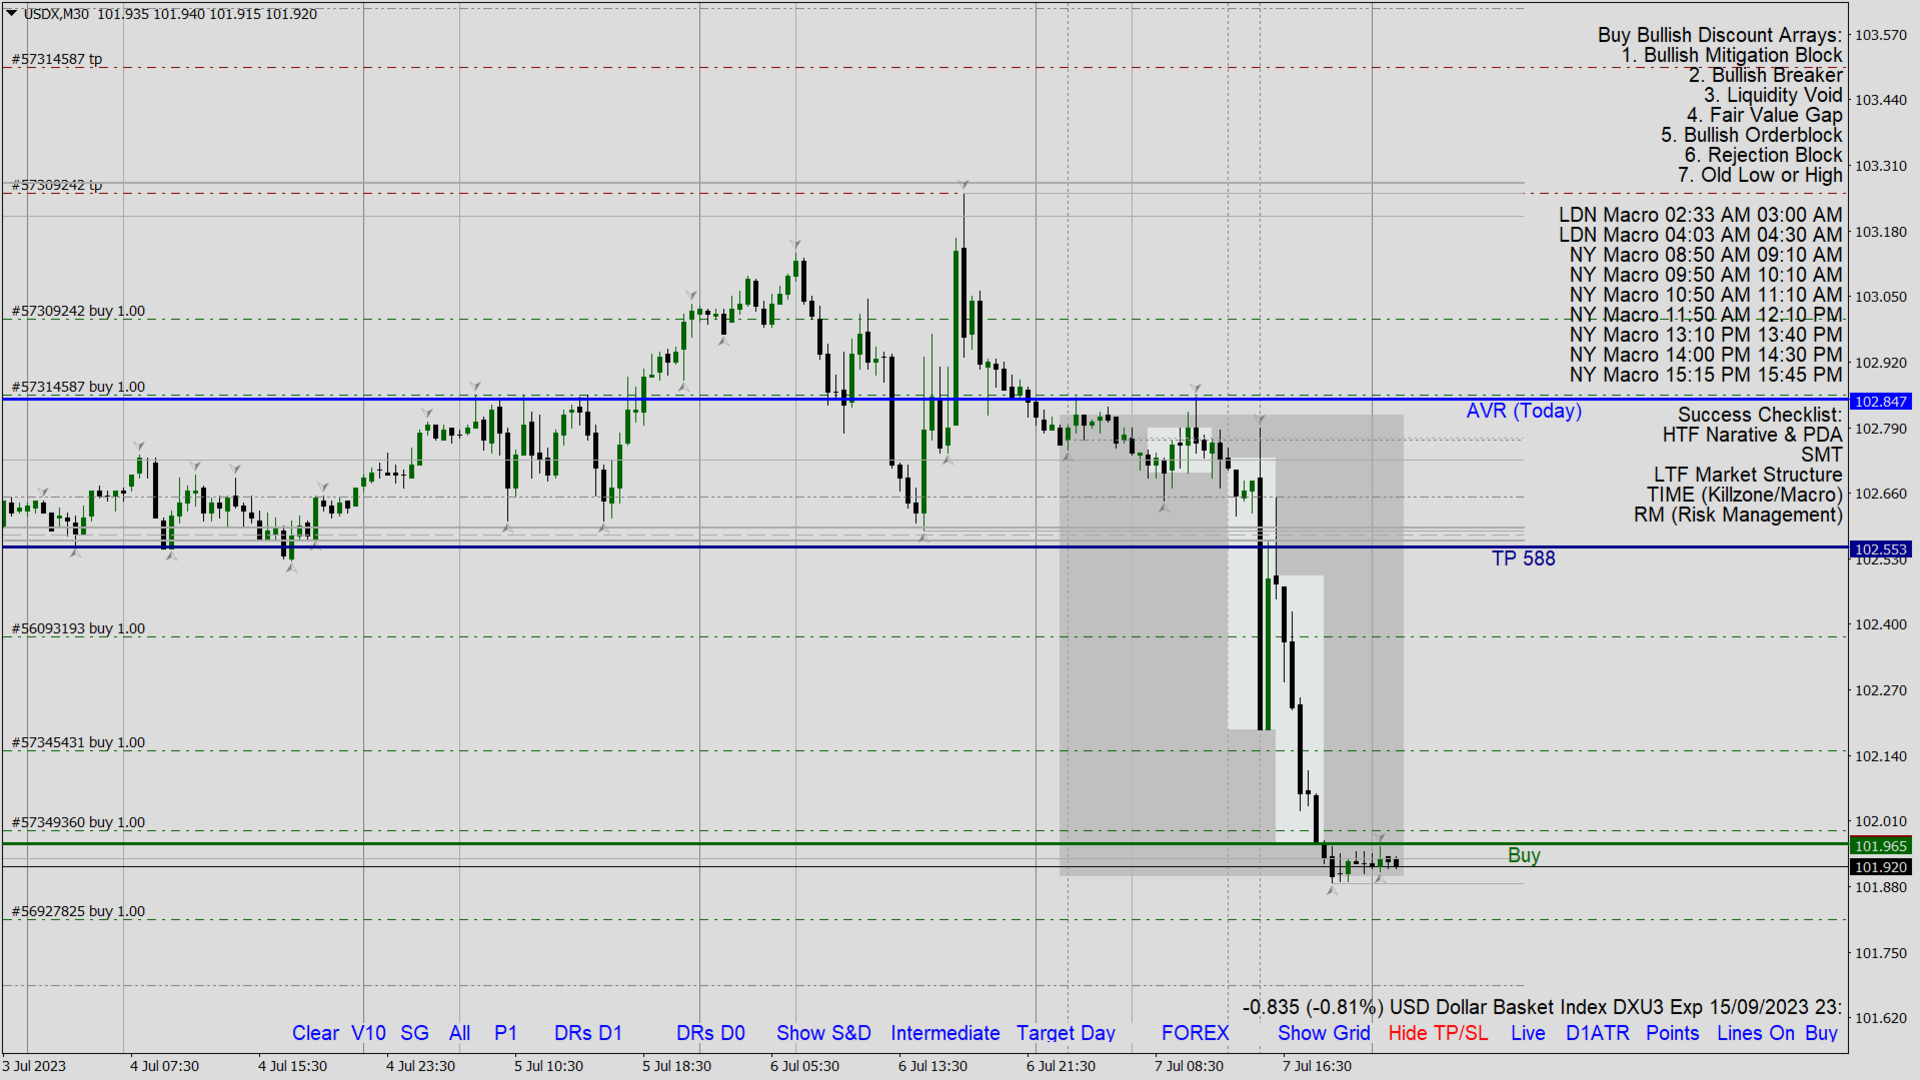
You will find many price action study tools like:
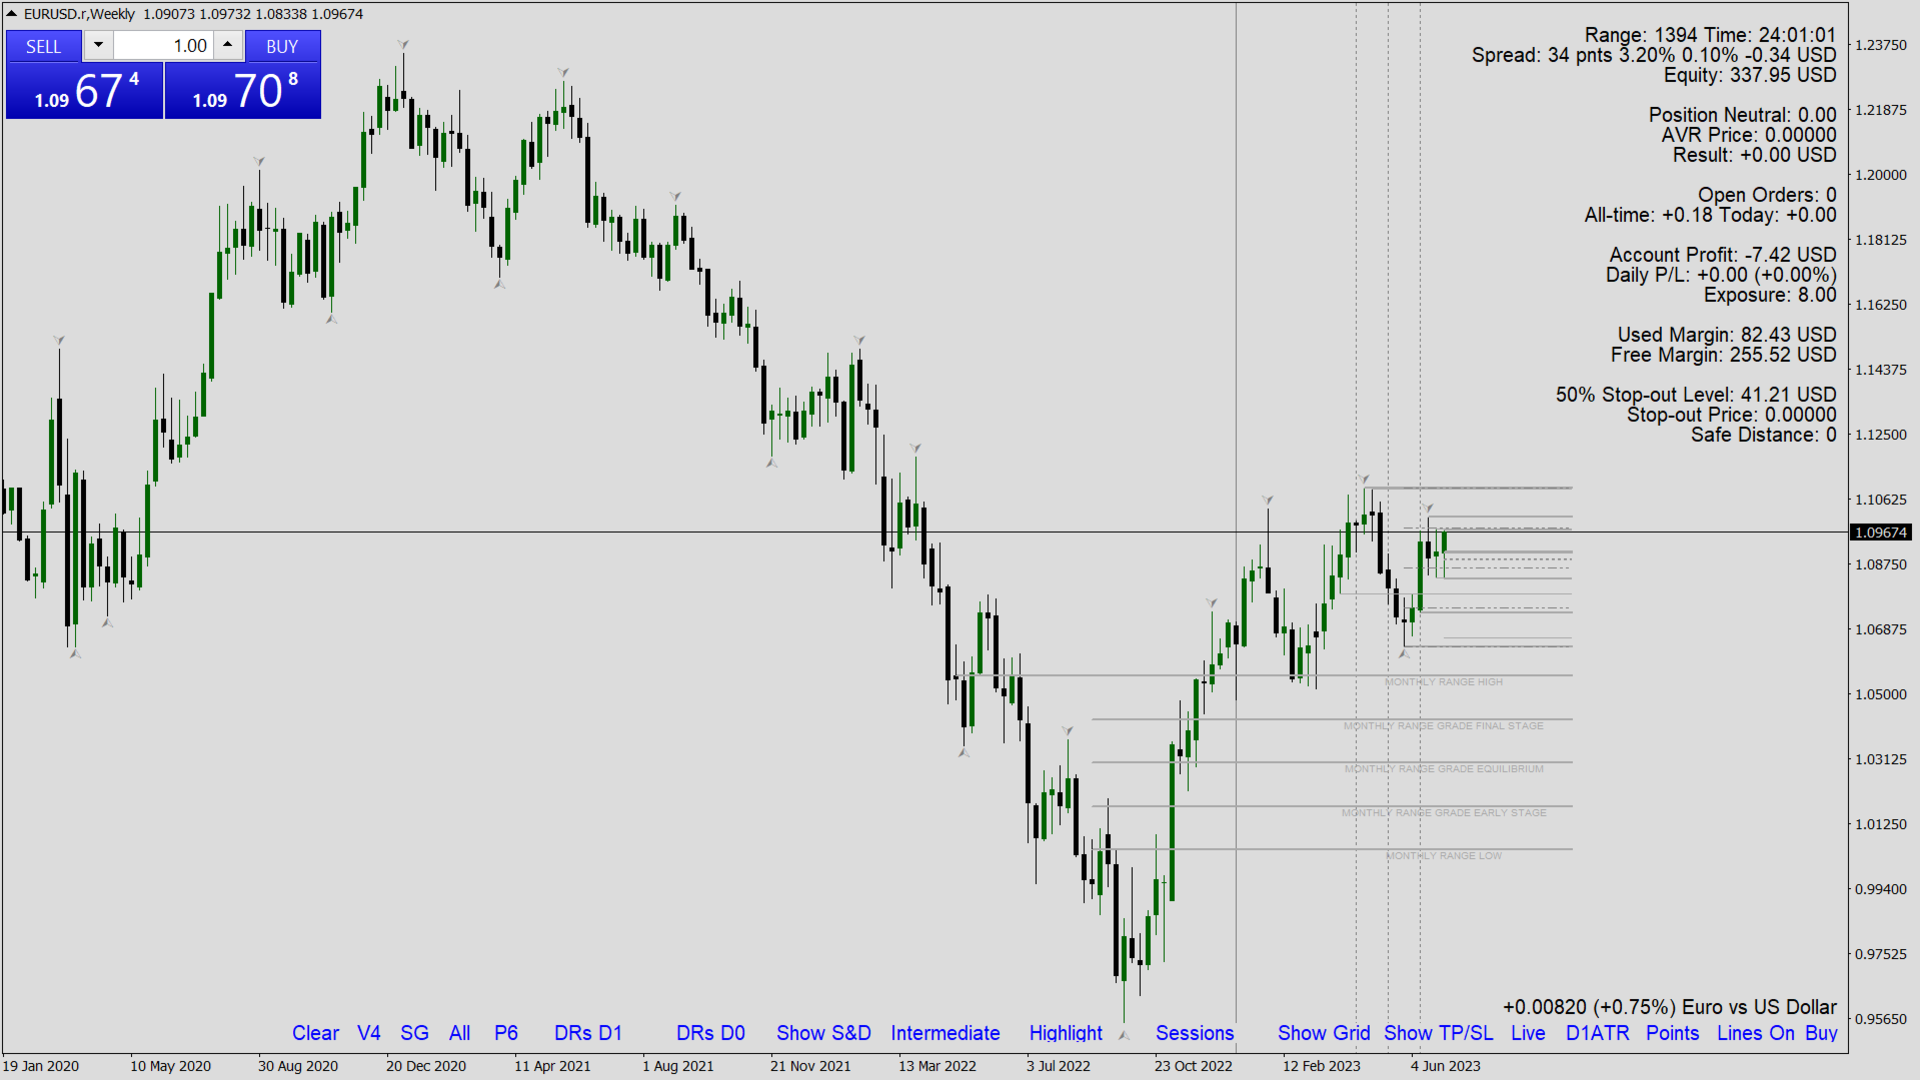
Central Bank Dealing Range - CBDR
Asian Range
FLOUT
Profiles and SD targets on the CBRD, Asian Range and Flout both on the wicks and on the bodies
Seek & Destroy Profile with Standard Deviation targets
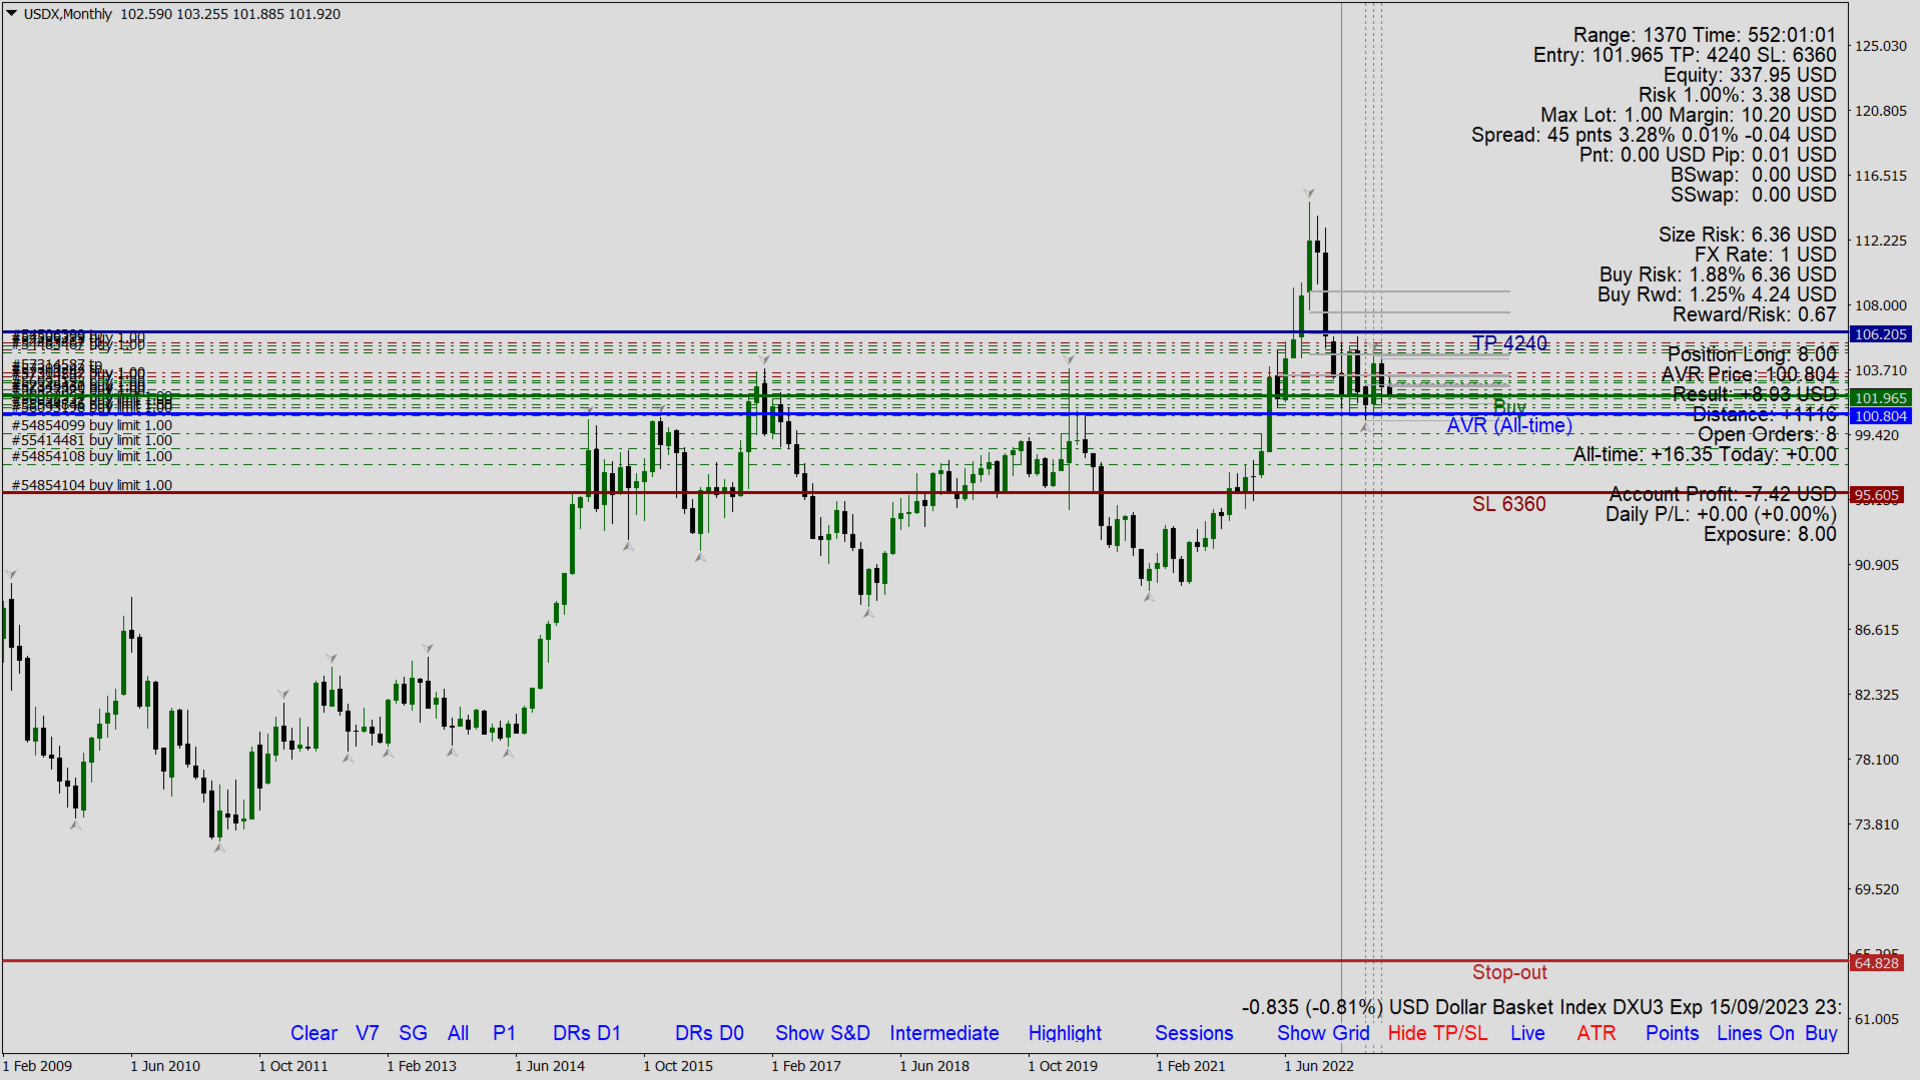
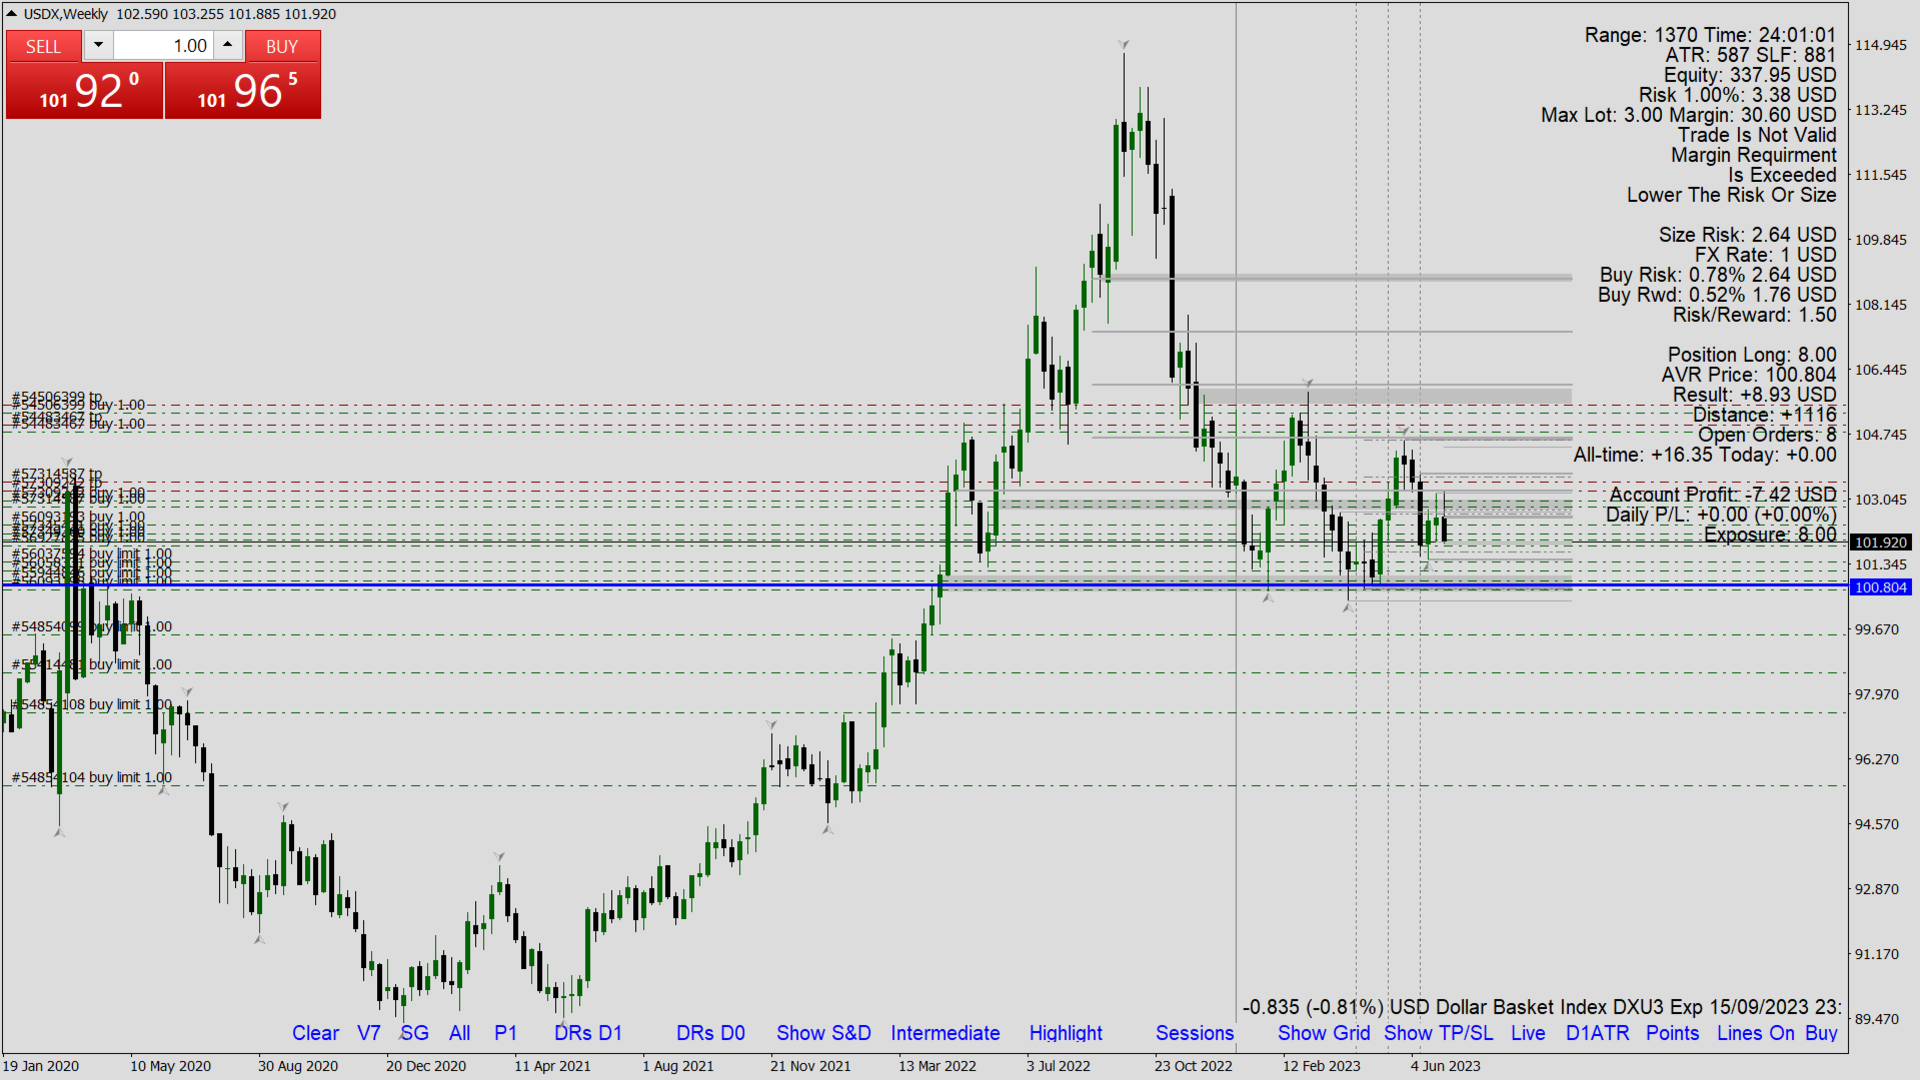
IPDA 20, 40 and 60
Monthly Swing Grades
W%R
As longs as the usual monthly, weekly, daily levels included are the IPDA levels plus GMT0 line, Daily Divider and many more from the following list - "NY Midnight Line", "GMT0 Midnight Line", "London Target Lines", "Monthly Range High", "Monthly Range Low", "Swing Grade First Zone", "Swing Grade Middle Zone", "Swing Grade Third Zone", "Monthly Range Grade First Zone", "Monthly Range Grade Middle Zone", "Monthly Range Grade Third Zone", "NY 10:00 A.M. Line", "GMT0 Midnight Vertical Line", "Day Divider Vertical Line", "NY Midnight Vertical Line", "NY Real Close Vertical Line", "IPDA Level Lines", "NYSE Open Vertical Line", "NYSE Close Vertical Line", "CME Open Vertical Line", "NYSE AM Safe Zone Vertical Line", "NYSE Lunch Hour Vertical Line", "NYSE PM Session Start Vertical Line", "NYSE PM Safe Zone Vertical Line", "NYSE Close Vertical Line", "NWOG" and more.
Many Overlays for sessions - "ASIA", "EURO", "USA", "Asia Sweet Spot", "London Open Sweet Spot" , "12AM to 12PM" , "NY Open Sweet Spot" , "London Close Sweet Spot", "Bond Market Sweet Spot", "US Market SPOOZ Sweet Spot", "The Last Hour", "NYSE A.M. Session", "NYSE Lunch", "NYSE P.M. Session", "NYSE True Day" , etc.
Many Overlays for daily focus studies - "The PSI Day on Focus", "True Day", "Time Distortions", "Monday, Tuesday, Wednesday trio", "12AM to 12PM" , "NY Open Sweet Spot" , "London Close Sweet Spot", "Bond Market Sweet Spot", "US Market Sweet Spot", "The Last Hour", "NYSE A.M. Session", "NYSE Lunch", "NYSE P.M. Session" , etc.
All tools from the PSI Indicator that already had some ICT free tools before the 2022 Mentorship and the release of the core private lessons.
All predefined but also customable PDAs.

this is an excellent indicator if you're learning smart money concepts. The seller is dedicated and has put a lot of time and effort into this indicator. I really appreciate the sellers response when i needed help, this is a must for all smart money traders