TrailingStop MA 4
- 지표
- 버전: 1.10
- 업데이트됨: 4 10월 2018

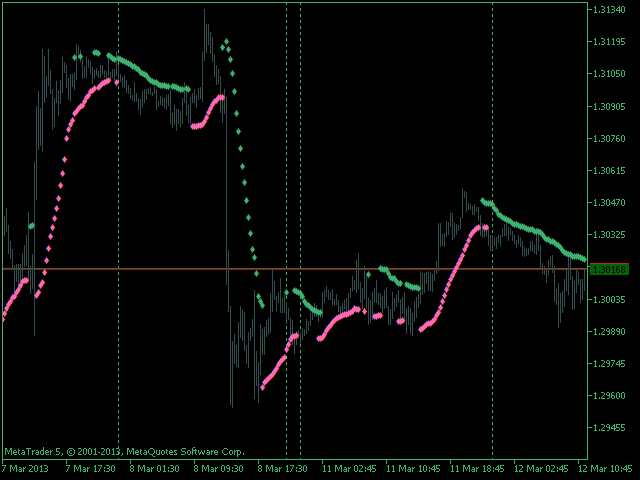
The indicator draws two simple moving averages using High and Low prices.
The MA_High line is displayed when the moving average is directed downwards. It can be used for setting a stop order for a sell position.
The MA_Low line is displayed when the moving average is directed upwards. It can be used for setting a stop order for a buy position.
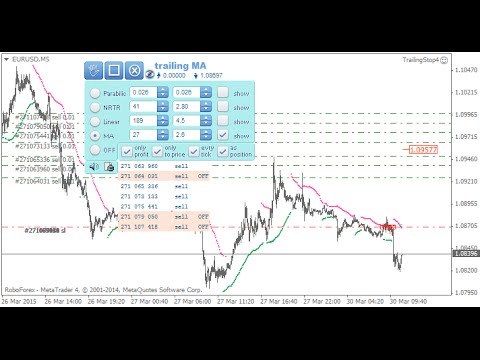
The indicator is used in the TrailingStop Expert Advisor.
Parameters
- Period - period of calculation of the moving average.
- Deviation - rate of convergence/divergence of the lines.
Buffer indexes: 0 - MA_High, 1 - MA_Low.


사용자가 평가에 대한 코멘트를 남기지 않았습니다