MTF Trend Regime Matrix
- 지표
- 버전: 1.1
- 활성화: 20

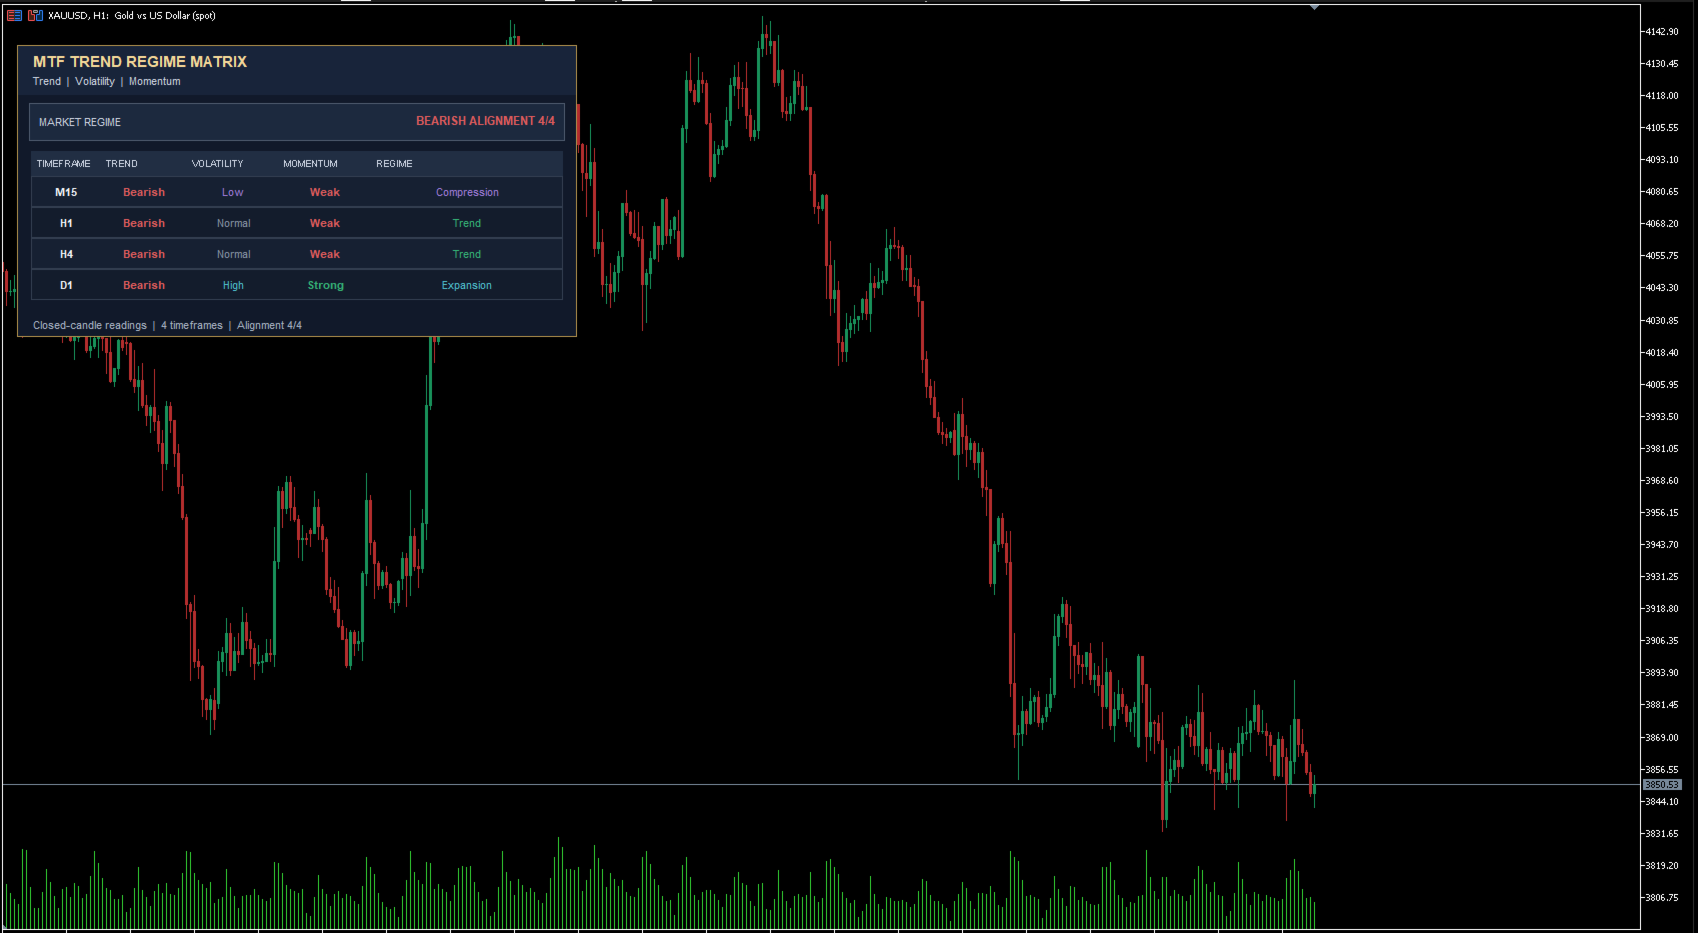
Get a structured view of market conditions across multiple timeframes. MTF Trend Regime Matrix combines trend direction, volatility, momentum strength, and overall regime in a single on-chart dashboard.
The indicator uses completed candles for its readings. This keeps the displayed matrix stable while the current candle is still forming.
CORE FEATURES
• Compare four configurable timeframes in one dashboard
• Read trend direction, volatility, momentum strength, and market regime for each timeframe
• View an overall bullish, bearish, mixed, or non-directional alignment summary
• Enable optional alerts when the alignment summary changes
• Customize bullish and bearish chart candle colors
• Position and resize the dashboard using indicator inputs
TIMEFRAME MATRIX
The default timeframes are M15, H1, H4, and D1. Each timeframe can be changed in the inputs. Select four different timeframes to avoid duplicate rows.
The dashboard displays:
• Trend: Bullish, Bearish, or Neutral
• Volatility: Low, Normal, or High
• Momentum: Strong, Building, Weak, or Mixed
• Regime: Trend, Expansion, Compression, or Range
HOW THE CLASSIFICATIONS WORK
Trend
The indicator compares a fast EMA with a slow EMA and checks the slow EMA’s direction over the configured lookback. It classifies the trend as bullish when both conditions point upward, bearish when both point downward, and neutral when they do not agree.
Volatility
The current closed-bar ATR is compared with the average ATR of a configurable number of preceding bars. The volatility is classified as Low, Normal, or High using the ratio thresholds in the inputs.
Momentum
RSI is used to check whether momentum supports the trend direction. ADX classifies the strength as Strong or Building when the RSI confirms the trend and the configured ADX threshold is met. Otherwise, momentum is Weak. Neutral trends are shown as Mixed.
Market Regime
Neutral conditions are classified as Range. High volatility combined with strong momentum is classified as Expansion. Low volatility is classified as Compression. Other directional conditions are classified as Trend.
ALIGNMENT SUMMARY
The dashboard summarizes directional agreement across the four selected timeframes. It can display Bullish Alignment, Bearish Alignment, Mixed Alignment, or No Directional Alignment. It shows a loading status until all four timeframes have enough data to calculate their readings.
CANDLE COLORS
Bullish and bearish candle colors can be customized independently. When candle coloring is enabled, the indicator changes the chart’s bullish and bearish candle and bar colors. It saves the previous chart colors and restores them when the indicator is removed, provided those colors have not since been changed by the user or another tool.
SETTINGS
Customize the indicator’s behavior through inputs for:
• Four timeframes
• Fast and slow EMA periods and slope lookback
• ATR period, baseline length, and volatility thresholds
• RSI and ADX periods and momentum thresholds
• Dashboard visibility, position, and width
• Alignment alerts
• Candle coloring and bullish/bearish colors
USAGE NOTES
MTF Trend Regime Matrix is an analytical indicator. It does not open, manage, or close trades. Its classifications depend on the selected periods and thresholds and are intended to help organize chart analysis, not to predict future price movement.
Candle colors are chart-wide settings. If another indicator or chart template also changes candle colors, the visible colors may depend on which setting was applied most recently.