Live Chart Notes MT5

Think on the chart, not beside it.

Your trading decisions happen on the chart. Your observations, ideas, setups and mistakes should be there too.

Live Chart Notes is a chart-annotation utility for MetaTrader 5 that lets you create, organize and manage notes directly on your trading charts.

Pin a thought to a specific candle, mark an important price level, record a trading idea or document a mistake. Your notes remain associated with their original chart locations, even when you scroll, zoom, change timeframes or restart the terminal.

No more scattered sticky notes, disconnected text files or trying to remember why you took a trade.

THE PROBLEM

It's Friday afternoon. You're reviewing the week's trading activity.

You remember watching an important price level on Tuesday. You remember having a reason for entering a particular trade. But where did you write it down?

A sticky note says "watch this level."

A text file says "retest = entry?"

Neither tells you which candle, which day or which instrument you were referring to.

The context behind your decisions gradually disappears.

MetaTrader is built around charts, but keeping your trading observations organized directly on those charts shouldn't require external applications.

THE SOLUTION

Live Chart Notes turns your chart into a workspace for your trading thoughts.

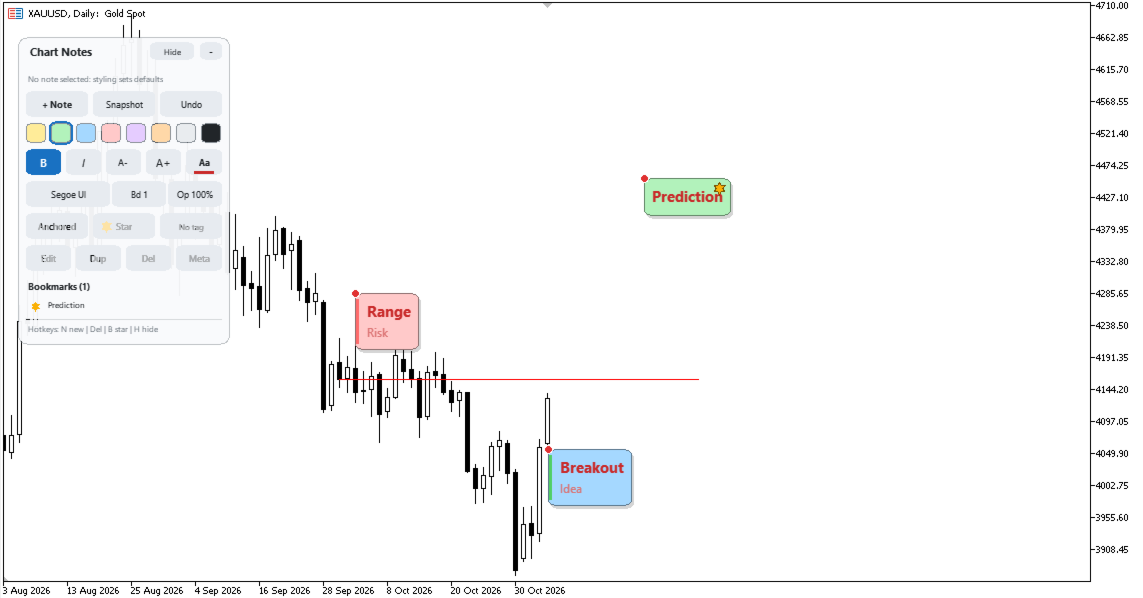
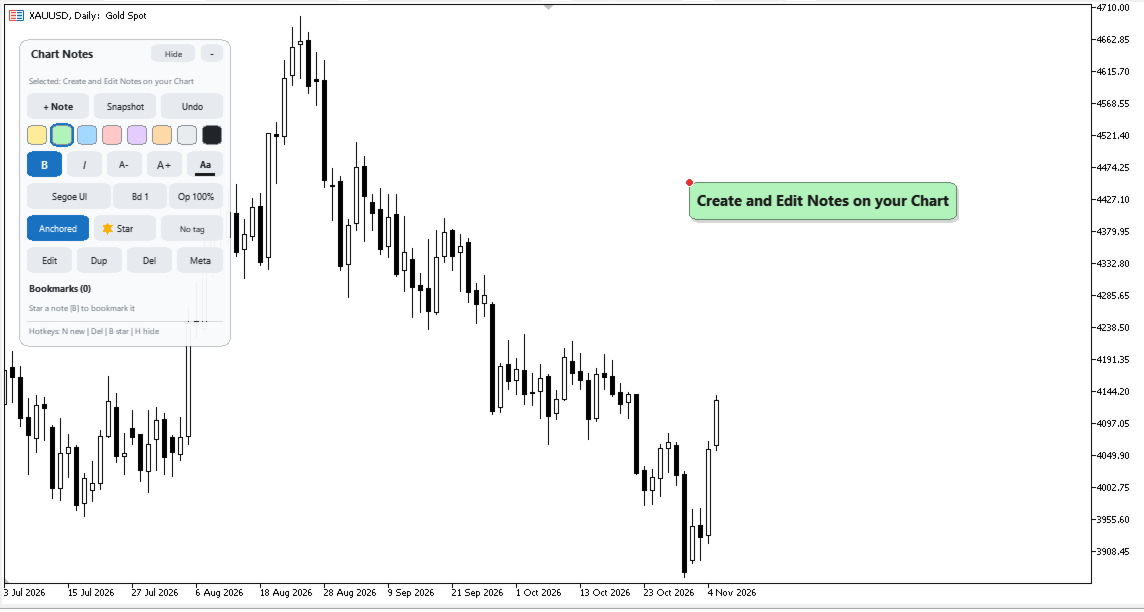
Press N, type your observation and place a note exactly where it belongs.

Notes can be anchored to price and time or fixed to the screen as conventional sticky notes.

They remain saved per symbol and persist across timeframe changes and terminal restarts.

When it's time to review your trading, you don't have to reconstruct your thinking.

You simply read it.

KEY FEATURES

1. Candle-Anchored & Fixed Notes

  • Anchor notes to specific price and time coordinates.

  • Alternatively, keep notes fixed on the chart screen.

  • Easily distinguish anchored and fixed notes using visual indicators.

  • Notes remain in their original positions when scrolling, zooming or changing timeframes.

  • Notes are saved per symbol and persist after restarting MetaTrader 5.

2. Precise Note Placement

  • Preview note placement using a ghost indicator before committing.

  • Magnet snapping to the candle's Open, High, Low or Close.

  • Live price and time information while positioning notes.

  • Place annotations precisely where your observations belong.

3. Customizable Note Styling

Make your notes visually meaningful and easy to distinguish.

  • Eight highlight colours.

  • Bold and italic formatting.

  • Four font options.

  • Adjustable font size and text colour.

  • Customizable border width and opacity.

  • Your last-used style is retained for faster note creation.

4. Tags, Bookmarks & Organization

Organize your trading observations using built-in categories:

  • Setup – Potential or confirmed trading opportunities.

  • Idea – Strategies, observations and hypotheses.

  • News – Market events and fundamental observations.

  • Risk – Risk-related warnings and considerations.

  • Mistake – Errors and lessons worth remembering.

Star important notes and use bookmarks to navigate directly to their locations on the chart.

5. Chart Snapshots & Review

Preserve your trading analysis for later reference.

With one click, export:

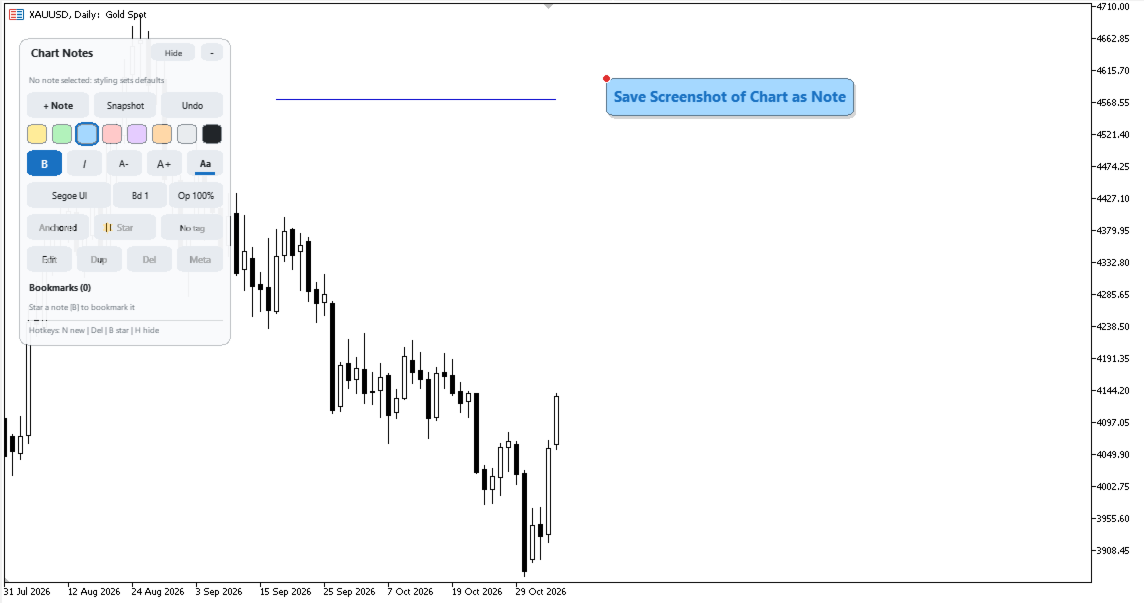
  • A PNG image of your chart.

  • A Markdown file containing your notes.

The notes panel automatically hides during the snapshot process, keeping your exported chart clean.

6. Lightweight Chart Interface

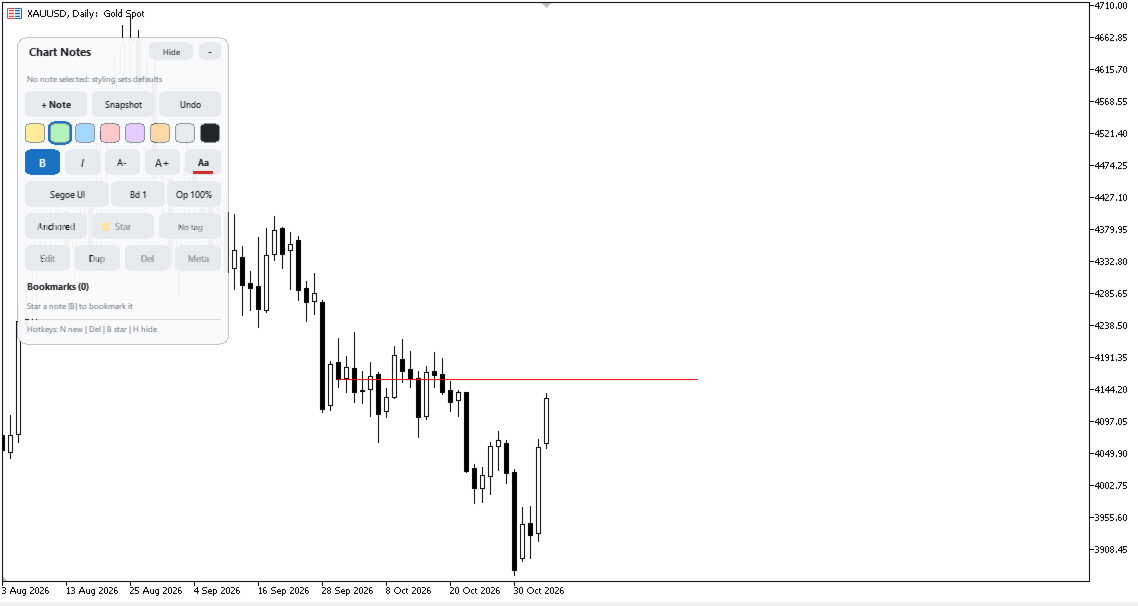
  • Compact, draggable and collapsible control panel.

  • Lightweight note rendering.

  • Designed to keep chart interaction smooth while dragging, scrolling and navigating.

KEYBOARD SHORTCUTS

Shortcut Action
N Create new note
Enter Edit selected note
Del Delete selected note
B Bookmark note
H Hide/show all notes
P Take chart snapshot
1–8 Select highlight colour
Ctrl + Z Undo
Ctrl + D Duplicate note
Ctrl + E Open paste-friendly editor

YOUR NEXT FRIDAY REVIEW

Open your charts.

Your observations are exactly where you left them. Your notes are tagged, your important ideas are bookmarked, and your trading history has context.

The Mistake notes remind you what to avoid.

The Setup notes show you what worked.

The Idea notes preserve what you want to investigate next.

Instead of relying on memory, you have a record of your thinking, attached to the market conditions that inspired it.

Live Chart Notes

Think on the chart, not beside it
추천 제품
Eazy RSI Divergence
Gawain Athur Stephan Cloete
Eazy Divergence is a non-repainting MT5 indicator designed to automatically detect and plot Regular and Hidden divergence signals in real time Key Features Dual-Window Plotting: Displays divergence trendlines and text badges directly on both the main price chart and the RSI subwindow. 100% Non-Repainting: Uses left/right pivot strength confirmation so signals stay fixed once drawn. Full Multi-Timeframe Support: Adapts instantly to whatever chart timeframe you are viewing. Fully Customizable: Eas
M & W Pattern Pro is an advanced scanner for M and W patters , it uses extra filters to ensure scanned patterns are profitable. The indicator can be used with all symbols and time frames. The indicator is a non repaint indicator with accurate statistics calculations. To use , simply scan the most profitable pair using the statistics dashboard accuracy , then enter trades on signal arrow and exit at the TP and SL levels. STATISTICS : Accuracy 1 : This is the percentage of the times price hits TP
EasyPivot — Smart Pivot Points with Pattern Prediction EasyPivot   is a professional MetaTrader 5 indicator that automatically detects significant High and Low pivot points, analyzes historical sequences of these signals, and provides a statistically based forecast of the next move. Perfect for swing traders, support/resistance traders, and pattern recognition enthusiasts. How It Works The indicator scans the chart and marks key reversal points: High pivot   — a bar whose high price is higher th
FREE
Smart ATR Grid Pro
Syamsurizal Dimjati
SMART ATR GRID PRO++ – Adaptive Grid Intelligence Suite is a next-generation, institutional-grade grid trading indicator engineered for traders who demand precision, adaptability, and comprehensive market structure analysis. By seamlessly integrating   Adaptive Volatility Grid System ,   KAMA Candle Trend Filtering ,   Multi-Factor Trend Detection (ADX + EMA20/50) ,   Dynamic Heatmap Zone Engine , and   Real-Time Market Regime Classification , this indicator delivers a complete decision-making
PatternDetector
Thien Thanh Tran
PatternScope — Multi-Pattern Recognition for MT5 PatternScope is a multi-pattern recognition indicator for MetaTrader 5. It scans price action for classic chart patterns, confirms breakouts, and draws clear   Entry, Stop Loss and Take Profit   levels. A compact dashboard shows the latest pattern, bias and Risk:Reward. Patterns:   Double Top/Bottom, Triple Top/Bottom, Head and Shoulders (and inverted), Bullish & Bearish Flag, Pennant, Rising & Falling Wedge, Triangle, Rectangle, Cup and Handle —
Mean Reversion Supply Demand Indicator Mean Reversion Supply Demand is the indicator to detect the important supply demand zone in your chart. The concept of supply demand trading relies on the quantity mismatching between buying and selling volumes in the financial market. Typically, supply demand zone serves to predict the turning point. The wave pattern, for any supply demand zone to work as an successful trade, looks like the price must touch the base zone, move away and then return to zone
Market Projection Pro — MT5 Want to visualize how the price cycles in your chosen chart section could extend? Market Projection Pro analyzes a historical window you select, extracts cycle components and draws a composite projection to its right. You control the source window and forward horizon to compare the scenario with price structure and potential turning zones. What you see on the chart Interactive boundaries let you select a historical analysis window directly on the chart. Cycle componen
这是一个非常好用的供需指标,具有以下特色: 1、可以精准的识别出供给区和需求区,且不重绘。 2、价格到达供给区或需求区会弹窗报警,且会改变颜色用来和未测试的供需区做区分。 3、价格突破供给区、需求区会弹窗报警并清除该失效的供需区。 4、供给区和需求区的进入边界价格直接标注在图表上,一目了然。 该指标配合均线使用效果更佳,用均线判断方向,用供需区的点位为设定入场位置,用供需区的边界来设定止损位置,便于以损定量,管理资金控制仓位,制定交易计划限价交易。当然也可以根据行情方向,在到达供给区或需求区报警触发后市价进厂做单,但前提是要提前做好计划,判断好方向,不可以盲目开单。关于止盈,使用供需指标来交易的话,盈亏比是比较划算的,保守的可以根据2:1或者3:1的盈亏比设置止盈,也可以把较远的供给区或需求区当作止盈目标。
Rocket Trend
Andriy Sydoruk
The Rocket Trend indicator is trending. The indicator draws two-color points connected by lines along the chart. This is a trend indicator, it is an algorithmic indicator. It is easy to work and understand when a blue circle appears, you need to buy, when a red one appears, sell. The indicator is used for scalping and pipsing, and has proven itself well. Rocket Trend is available for analyzing the direction of the trend for a specific period of time. Ideal for novice traders learning the laws o
Chỉ báo này sẽ thông báo cho bạn nếu cấu hình xu hướng thành công. Tín hiệu theo xu hướng không nên được tăng theo, nhưng tín hiệu mua ở mức giá thấp theo mô hình giao dịch thông thường của bạn, hoặc tín hiệu bán ở mức giá tốt, là một lựa chọn rất tốt. Hãy thiết lập nó trên khung thời gian lớn hơn và theo dõi các khung thời gian nhỏ hơn, bám sát các xu hướng chính. Tôi thường thiết lập ba khung thời gian gần nhau nhất và không bao giờ đi ngược tín hiệu của INdicator này. INdicator   này không có
PZ Mean Reversion MT5
PZ TRADING SLU
1 (1)
평균 회귀 거래에 대한 전문적이고 정량적인 접근 방식을 구현하는 고유한 지표입니다. 이는 가격이 예측 가능하고 측정 가능한 방식으로 평균으로 전환되고 반환된다는 사실을 이용하여 비정량적 거래 전략을 훨씬 능가하는 명확한 진입 및 퇴장 규칙을 허용합니다. [ Installation Guide | Update Guide | Troubleshooting | FAQ | All Products ] 명확한 거래 신호 놀랍도록 쉬운 거래 사용자 정의 가능한 색상 및 크기 성능 통계 구현 대부분의 거래 전략을 능가합니다. 적절한 SL 및 TP 레벨을 표시합니다. 이메일/음향/시각 알림을 구현합니다. 작동 원리 이 지표는 더 높은 기간에서 완전히 사용자 정의 가능한 이동 평균 주변의 표준 편차를 측정하고 추세 추종 접근 방식을 사용하여 정확하게 거래를 찾습니다. 거래는 현재 차트의 가격 동작을 살펴보고 선택한 더 높은 기간에서 계산된 평균 가격대로 가격이 돌아오면 닫힙니다. 코딩 방식 때문에 지
Multi Timeframe Smc Bias Finder Trading in alignment with higher timeframe structure is one of the most consistently profitable habits a trader can build. The difficulty has always been execution: switching between timeframes, manually reading structure, and keeping track of whether the Daily, 4-Hour and 1-Hour are all pointing in the same direction before committing to a position. Multi Timeframe Smc Bias Finder resolves that entirely. Three tools in one indicator: A live multi-timeframe bias d
DYJ BoS
Daying Cao
DYJ BoS 지표는 다음을 포함하여 시장 구조 변화의 필수 요소를 자동으로 식별하고 표시합니다. 구조 돌파(BoS): 가격이 크게 움직여 이전 구조 지점을 돌파할 때 감지됩니다. 상승 추세선과 하락 추세선(UP & DN, 즉 연속적인 신고가와 신저가)을 표시하고, 가격이 이러한 선을 돌파하면 빨간색(BEAR)과 초록색(BULL) 화살표를 표시합니다. BoS는 일반적으로 가격이 이전 가격 움직임에 의해 확립된 스윙 저점이나 스윙 고점을 확실히 통과할 때 발생합니다. 가격이 스윙 하이보다 높거나 스윙 로우보다 낮게 움직일 경우, 이는 단순히 이전에 형성된 시장 구조를 깨는 것이므로 "브레이크아웃" 구조라고 합니다. 이는 종종 시장 심리와 추세 방향의 변화를 나타내며, 기존 추세가 지속되거나 새로운 추세가 시작됨을 알립니다. 일반적으로 마감 정확도를 높이기 위해 손절매와 이익실현을 설정하지 않는 것이 좋습니다. 최종 포지션은 일반적으로 같은 방향의 다음 돌파점에서 마감되거나 반
The Non Repaint Buy/Sell Signals QCL MT5 Indicator is a powerful trading tool built on mathematical analysis. This software reduces chart noise avoids confusion when making trading decisions and provides clear market signals directly on MetaTrader 5 without repainting. Special launch discount price. Final price $149 Indicator User Manual User Manual Asset: XAUUSD Timeframe: 15 Minutes, We doing manual trading upon the signals sent by our Indicator Core Quantitative Architecture Adaptive Momentum
SPECIAL LAUNCH OFFER: $30 (1-Month Rent) Limited time offer to build our community and gather feedback! AmbM GOLD Institutional Scalper A high-precision M5 algorithm for XAUUSD (Gold) , engineered to trade exclusively at Institutional Liquidity Levels ($5/$10 psychological marks). PERFORMANCE DATA (BUY ONLY) • Win Rate: 87.09%. • Safe Growth: +$4,113 profit on $10k (13.75% Max Drawdown). • Extreme Stress Test: Successfully generated +$22,997 in a 5-year stress test (2020-2026), proving
Trade smarter, not harder: Empower your trading with Harmonacci Patterns This is arguably the most complete harmonic price formation auto-recognition indicator you can find for the MetaTrader Platform. It detects 19 different patterns, takes fibonacci projections as seriously as you do, displays the Potential Reversal Zone (PRZ) and finds suitable stop-loss and take-profit levels. [ Installation Guide | Update Guide | Troubleshooting | FAQ | All Products  ] It detects 19 different harmonic pric
ONNYX INDICATOR 버전 1.14 MetaTrader 5용 수요·공급 구역 분석 지표입니다. 확정된 스윙을 기준으로 구역을 생성하고 ATR로 폭을 조정하며 품질을 백분율로 표시합니다. 종가가 확정된 후 생성된 BUY/SELL 신호는 사라지지 않도록 설계되었습니다. 주요 기능 - 구역 내부에 품질 백분율을 표시하는 수요·공급 구역. - 확정 봉에서 나타나는 큰 BUY/SELL 화살표. - 선택 가능한 EMA 추세 필터와 캔들 거부 확인. - 추세, 가격 레벨 및 시장 상황 패널. - 관련 경제 뉴스 최대 5개 표시. 발표 전 Forecast/Previous, 발표 후 Actual 표시. - 60초 뉴스 갱신 및 전략 테스터용 캘린더 캐시. - 팝업, 푸시 및 이메일 알림. - iCustom 버퍼: 0=BUY 가격, 1=SELL 가격. 사용 방법 차트에 지표를 적용하고 히스토리 로딩을 기다린 뒤 추세와 활성 구역을 확인하십시오. 확정 봉 신호를 개인 리스크 관리와 함께 사용하십
KT Pin Bar MT5
KEENBASE SOFTWARE SOLUTIONS
KT Pin Bar identifies the pin bar formation which is a type of price action pattern which depicts a sign of reversal or rejection of the trend. When combined with support and resistance, BRN and other significant levels, Pin Bar pattern proved to be a very strong sign of reversal. Basically, a pin bar is characterized by a small body relative to the bar length which is closed either in upper or lower 50% part of its length. They have very large wicks and small candle body. A pin bar candlestic
The PUA MultiType Pivot indicator is built on the daily chart of the previous day. The PUA MultiType Pivot indicator is one of the most popular tools in technical analysis, used by traders to identify potential reversal points in financial markets. This indicator constructs three types of Pivot points: Classic, Fibonacci, and Camarilla, each offering its unique approach to market analysis. The advantages of this indicator include: Simplicity and Clarity PUA MultiType Pivot provides clearly defi
거래량 프로파일 멀티모드: 지표 방식이 아닌, 원하는 방식으로 거래량을 분석하세요. 대부분의 거래량 프로파일 지표는 거래자들이 미리 정해진 분석 범위 안에 갇히도록 만듭니다. 하지만 시장은 고정된 틀 안에서 움직이지 않는데, 분석까지 그럴 필요가 있을까요? 볼륨 프로파일 멀티 모드는 거래량 분석 시점, 장소, 방법을 완전히 자유롭게 결정할 수 있도록 해줍니다. 시장 구조 분석, 거래 세션 프로파일링, 더 높은 시간대의 활동 모니터링, 또는 진행 중인 경매 추적 등 어떤 목적이든 이 지표는 사용자의 거래 스타일에 맞춰 조정되므로 사용자가 거래 스타일에 맞춰야 할 필요가 없습니다. 직관적인 워크플로우를 원하는 초보자와 유연성을 요구하는 전문가를 위해 설계된 Volume Profile Multi-Mode는 네 가지 강력한 프로파일링 방법을 하나의 고도로 상호작용적이고 맞춤 설정 가능한 거래 도구로 결합합니다. 4가지 강력한 프로파일링 모드 1.       플렉서블 박스 : 대시보드에서 토
Structure King AI Signal
Shingala Gautamkumar
Structure King AI Signal Structure King AI Signal is a professional MetaTrader 5 trading indicator designed to help traders analyze market structure, trend direction, multi-timeframe confirmation and trade management from one clean dashboard. Key Features • Market Structure & Trend Analysis • BUY / SELL Signals • Multi-Timeframe (HTF) Confirmation • Entry Price Levels • Dynamic Stop Loss (SL) • TP1 / TP2 / TP3 Levels • ATR Volatility Analysis • ADX Trend Strength Filter • Adaptive Market Filter
Caicai L&S Yield Histogram Important Notice: This indicator is an integral tool of the automated EA Caicai Long and Short Pair Trading . This indicator visually displays the percentage deviation (Yield %) of a pair's current spread relative to its own historical mean. It is an excellent tool for quickly visualizing the gross financial potential of a market distortion in Long & Short operations. Main Features: Percentage Visualization: Understand the size of the distortion in palpable percentage
GP Confluence Scanner MT5 Advanced Multi-Timeframe Market Structure & Confluence Analysis Don't get stopped out easily again! GP Confluence Scanner MT5 is an advanced technical analysis indicator designed to reveal important market levels, hidden support and resistance, and multiple technical confluences before entering a setup. Rather than relying on a single indicator, GP Confluence Scanner examines multiple technical factors to identify areas where significant market reactions may occur. Key
Tani Cascade ICT1
Jeremy Andrew Keister
TANI CASCADE ICT v1.16 Multi-Timeframe Smart Money Concepts & Trade Confirmation Indicator for MetaTrader 5 Trade with Structure. Confirm with Precision. Manage with Confidence. Tani Cascade ICT is an advanced MetaTrader 5 trading indicator designed to help traders identify potential market opportunities using institutional-style price action concepts, multi-timeframe analysis, and structured trade confirmation. Built around a four-step trading framework, the indicator combines market structure,
FREE
Premium level Pro
Dmitriy Kashevich
Premium level is a unique indicator with more than 80% accuracy of correct predictions! This indicator has been tested for more than two months by the best Trading Specialists! The author's indicator you will not find anywhere else! From the screenshots you can see for yourself the accuracy of this tool! 1 is great for trading binary options with an expiration time of 1 candle. 2 works on all currency pairs, stocks, commodities, cryptocurrencies Instructions: As soon as the red arrow app
PZ Trend Trading MT5
PZ TRADING SLU
3.8 (5)
Capture every opportunity: your go-to indicator for profitable trend trading Trend Trading is an indicator designed to profit as much as possible from trends taking place in the market, by timing pullbacks and breakouts. It finds trading opportunities by analyzing what the price is doing during established trends. [ Installation Guide | Update Guide | Troubleshooting | FAQ | All Products ] Trade financial markets with confidence and efficiency Profit from established trends without getting whips
Apollo SR Master는 지지/저항 구간에서의 거래를 더욱 쉽고 안정적으로 만들어 주는 특수 기능을 갖춘 지지/저항 지표입니다. 이 지표는 지역 가격의 고점과 저점을 감지하여 시간 지연 없이 실시간으로 지지/저항 구간을 계산합니다. 새롭게 형성된 저항 구간을 확인하기 위해 지표는 해당 저항 구간을 실제 매도 또는 매수 신호로 활용할 수 있음을 나타내는 특수 신호를 표시합니다. 이 경우, 저항 구간의 강도가 높아지고, 따라서 저항 구간에서의 성공적인 거래 가능성도 높아집니다. 이것이 바로 이 지표의 핵심 아이디어입니다. SR 존은 손절매와 이익실현을 더욱 쉽게 할 수 있도록 해줍니다. 신호 방향에 따라 SR 존 위 또는 아래 공간을 손절매로 활용할 수 있습니다. 또한, 반대쪽 SR 존은 잠재적 이익실현 영역으로 활용할 수 있습니다. 또한 Apollo SR Master 지표를 사용하는 모든 사용자에게 "Apollo Price Action System" 지표를 무료로 제공합니다.
Market Direction Pro is a professional indicator for MetaTrader 5 that transforms complex market behavior into clear, confirmed direction.The indicator does not redraw signal arrows. Built around a proprietary multi-stage analytical process, it helps traders filter intrabar noise and focus on signals that remain stable after confirmation. Bullish and bearish arrows appear directly on the main price chart, while the dedicated visual interface presents direction, turning points and signal context
Chart Pattern MT5
Young Ho Seo
5 (1)
Introduction to Chart Pattern MT Chart Pattern MT is a chart pattern scanner to detect the triangle pattern, falling wedge pattern, rising wedge pattern, channel pattern and so on. Chart Pattern MT uses highly sophisticated chart pattern detection algorithm. However, we have designed it in the easy to use with intuitive user interface. Chart Pattern MT will show all the patterns in your chart in the most efficient format for your trading. You do not have to do tedious manual pattern detection an
Pivot Day Master is an automated, lightweight, and highly reliable technical analysis tool designed for MetaTrader 5. It automatically calculates and draws Daily Pivot Points, key Resistance and Support levels (R1-R3, S1-S3), as well as the Daily Open Price line directly on your chart. Whether you are a day trader, scalper, or swing trader, key Pivot levels serve as high-probability reaction zones for price action, breakouts, and trend reversals. Key Features: Automatic Daily Calculation: Automa
이 제품의 구매자들이 또한 구매함
Trend Sniper X
Sarvarbek Abduvoxobov
4.86 (44)
Trend Sniper X 는 트레이더가 추세 방향과 잠재적 반전 지점을 명확하고 정확하게 포착할 수 있도록 도와주는 MetaTrader 5용 멀티 타임프레임 추세 추종 지표입니다. MT4용: https://www.mql5.com/en/market/product/193245 가격 정보: 현재 가격은 프로모션 할인가이며, 향후 업데이트 및 새로운 기능이 출시됨에 따라 변동될 수 있습니다. 보너스 혜택: 본 지표 전용 무료 자동매매 Assistant EA를 받으시려면 구매 후 작성자에게 메시지를 보내주시기 바랍니다. Code2Profit 채널 멀티 타임프레임 분석으로 시장을 마스터하세요! Trend Sniper X로 승률을 극대화하는 방법: 핵심 규칙 및 세션 팁 기술 사양 플랫폼 MetaTrader 5 지표 유형 멀티 타임프레임 추세 지표 운용 타임프레임 모든 차트 타임프레임 지원, 독립적으로 선택 가능한 상위 타임프레임(M1–MN1) 주요 상품 외환, 금(XAUUSD) 및 기타 C
Gann Made Easy MT5
Oleg Rodin
5 (13)
Gann Made Easy 는 mr.의 이론을 사용하여 최고의 거래 원칙을 기반으로 하는 전문적이고 사용하기 쉬운 Forex 거래 시스템입니다. W.D. 간. 이 표시기는 Stop Loss 및 Take Profit Levels를 포함하여 정확한 BUY 및 SELL 신호를 제공합니다. PUSH 알림을 사용하여 이동 중에도 거래할 수 있습니다. 구매 후 거래 방법 안내 및 유용한 추가 지표를 무료로 받으시려면 저에게 연락주세요! 아마도 Gann 거래 방법에 대해 이미 여러 번 들었을 것입니다. 일반적으로 Gann의 이론은 초보자 거래자뿐만 아니라 이미 거래 경험이 있는 사람들에게도 매우 복잡한 것입니다. Gann의 거래 방식은 이론적으로 적용하기 쉽지 않기 때문입니다. 나는 그 지식을 연마하고 Forex 지표에 최고의 원칙을 적용하기 위해 몇 년을 보냈습니다. 표시기는 적용하기가 매우 쉽습니다. 차트에 첨부하고 간단한 거래 권장 사항을 따르기만 하면 됩니다. 지표는 지속적으로 시장 분석
Entry Points Pro for MT5
Yury Orlov
4.52 (152)
Entry Points Pro는 주문을 넣기 전에 어디에서 진입하고, 스탑을 어디에 두고, 어떤 랏으로 거래할지 보여 줍니다. 가격 지금 149 USD이며, 이 가격으로는 마지막 1카피입니다. 이후 가격은 199 USD로 오르고, 최종 가격은 349 USD입니다. 저는 시장에서 트레이딩으로 돈을 벌고 그것을 보여 드립니다. 그래서 이 인디케이터를 모두에게 팔 필요가 없습니다. 스스로 생각하는 트레이더를 위한 도구이지, 마법 버튼이 아닙니다. 화살표는 캔들이 마감될 때 나타나며 리페인팅되지 않습니다. 설정은 두 가지: 예치금과 거래당 리스크. 결제 전에 확인하세요: 무료 데모는 MT5 전략 테스터에서 작동하며 2분이면 됩니다. 구매 후에는 제가 직접 설정을 도와 드리겠습니다. 2019년, 저는 이 지표가 무엇을 할 수 있는지 전 세계에 보여 주었습니다. 실계좌에서 지표의 시그널에 따라 수동으로, 모두가 볼 수 있게 공개적으로 거래했습니다 — 계좌는 Myfxbook에서 모니터링되었고,
Ultra Indicator
Ihor Otkydach
5 (1)
ULTRA는 “올인원” 방식으로 작동하는 기술적 지표로, 시장을 독자적으로 분석하고, 매매 신호를 생성하며, 손절매 주문 설정 수준을 표시하고, 이익을 실현하거나 손실을 최소화하기 위해 포지션을 청산해야 할 시점을 제안합니다. 다시 말해, 시장을 분석하는 법을 모르거나, 가격 수준(손절매를 어디에 설정할지)을 파악하지 못하거나, 자금 관리에 어려움을 겪더라도 상관없습니다. ULTRA가 그 모든 것을 대신 해줄 테니까요! 구매자 특전 : ULTRA 지표를 구매하신 후, 저에게 비공개 메시지를 보내주시면 “ULTRA BOT”을 무료 선물로 드립니다. 이 도구는 해당 지표의 신호를 바탕으로 개설한 거래를 관리하는 데 도움을 주는 특별한 도구입니다(각 거래에 대해 손절매를 설정하고, 최상의 결과를 얻을 수 있도록 전략의 규칙에 따라 거래를 자동으로 청산해 줍니다).  또한 구매자분들께 다양한 자산에 바로 적용할 수 있는 설정값을 제공해 드리고 있으며, 이를 통해 지표가 최대 효율로 작동할
M1 Sniper MT5
Oleg Rodin
5 (7)
M1 SNIPER 는 사용하기 쉬운 거래 지표 시스템입니다. M1 시간대에 맞춰 설계된 화살표 지표입니다. 이 지표는 M1 시간대 스캘핑을 위한 단독 시스템으로 사용할 수 있으며, 기존 거래 시스템의 일부로도 사용할 수 있습니다. 이 거래 시스템은 M1 시간대 거래용으로 특별히 설계되었지만, 다른 시간대에도 사용할 수 있습니다. 원래는 XAUUSD와 BTCUSD 거래를 위해 이 방법을 설계했지만, 다른 시장 거래에도 유용하다는 것을 알게 되었습니다. 이 지표의 신호는 추세 방향과 반대로 거래될 수 있습니다. 저는 지표의 신호를 활용하여 양방향으로 거래할 수 있도록 돕는 특별한 거래 기법을 알려드립니다. 이 방법은 특별한 동적 지지선과 저항선 가격 영역을 활용하는 것을 기반으로 합니다. 구매하시면 M1 SNIPER 화살표 지표를 바로 다운로드하실 수 있습니다. 또한, 아래 스크린샷에 표시된 Apollo Dynamic SR 지표는 M1 SNIPER 도구를 사용하는 모든 사용자에게 무료로
Adaptive Price Action Engine 지표를 구매하면 EA(자동매매 프로그램)가 무료 멀티 타임프레임 기반 자기 최적화 추세 & 캔들 패턴 분석 시스템 시장은 끊임없이 변화하며, 모든 Price Action 패턴이 모든 시장 환경에서 동일한 가치를 가지는 것은 아닙니다. Adaptive Price Action Engine 은 변화하는 시장 환경에 적응할 수 있도록 설계되었으며, 추세 구조, 멀티 타임프레임 분석, 캔들 패턴 및 통계적 최적화 를 하나의 분석 프레임워크로 결합합니다. 두 가지 적응형 모드 Dual Alpha Trend Mode 낮은 타임프레임과 높은 타임프레임에서 적합한 Alpha Trend 파라미터를 자동으로 탐색하여, 최근 시장 움직임에 맞춰 추세 분석을 조정합니다. Candlestick + Alpha Mode Alpha Trend를 통한 시장 국면 분석과 22개의 상승 및 하락 캔들 패턴 을 결합합니다. 모든 패턴을 동일하게 취급하는 대신, 다양
FiboSniper Pro
Van Minh Nguyen
5 (4)
FiboSniper Pro – Multi-Filter Fibonacci System with Auto SL/TP and Control Panel FiboSniper Pro는 동적 Fibonacci Envelopes와 여러 확인 필터를 결합하여 선별된 Buy 및 Sell 신호를 생성하는 기술적 지표입니다. Fibonacci 레벨은 Moving Average와 ATR을 기반으로 계산된 후 ADX, EMA, RSI, ATR, Volume, Time 및 Candle 구조를 통해 필터링됩니다. 이 지표는 ATR 기반의 자동 Stop Loss 및 Take Profit 레벨을 차트에 직접 표시하며, 빠른 설정 조정을 위한 인터랙티브 Control Panel을 제공합니다. 구매 후 MQL5 메시지로 저에게 연락하시면 Auto Trader X를 무료로 받으실 수 있으며, 이 지표의 거래 신호를 자동화하는 방법에 대한 안내도 제공됩니다. User Guide 및 Set Files: [Click here
Auto Optimized SpeedAngle 은 지속적인 워크포워드 최적화(Walk-Forward Optimization, WFO)를 통해 곡선 적합(curve-fitting)을 제거한 기관 수준의 모멘텀 벡터화 시스템입니다. 시장 체제가 바뀔 때 성능이 떨어지는 정적 입력에 의존하는 대신, 이 지표는 표본 외(Out-of-Sample, OOS) 검증을 사용하여 매개변수를 동적으로 재보정하며, 표시되는 신호가 과거의 우연이 아닌 진정한 통계적 우위를 나타내도록 보장합니다. 핵심 기관용 프레임워크 워크포워드 최적화 엔진: 핵심 알고리즘은 수천 가지의 룩백(lookback) 및 임계값 조합을 지속적으로 스캔하며, 데이터를 인샘플(in-sample)과 표본 외(out-of-sample) 세트로 엄격하게 분리합니다. 미지의 데이터 환경에서 수학적 우수성이 증명된 경우에만 새로운 매개변수 구성을 채택합니다. 정량적 목적 함수: 순수한 총이익을 쫓는 대신, 최적화 엔진은 기관 수준의 안정성
ARICoins
Temirlan Kdyrkhan
ARICoin is a powerful trading companion designed to generate high-probability entry signals with dynamic TP/SL/DP levels based on volatility. Built-in performance tracking shows win/loss stats, PP1/PP2 hits, and success rates all updated live. Key Features: Buy/Sell signals with adaptive volatility bands Real-time TP/SL/DP levels based on ATR Built-in MA Filter with optional ATR/StdDev volatility Performance stats panel (Success, Profit/Loss, PP1/PP2) Alerts via popup, sound, push, or email Cust
Boba Analysis Suite
Trade Ready Solutions LLC
5 (2)
Boba Analysis Suite Boba Analysis Suite는 MetaTrader 5용 분석 지표입니다. 시장 구조, 주요 가격 영역, 전반적인 시장 상황을 하나의 차트 화면에 통합하여 표시합니다. 트레이더이자 트레이딩 코치로서의 실무 경험을 바탕으로 개발되었으며, 시장 방향 평가, 주요 가격 수준 식별, 여러 시간대의 종합적인 분석 등 체계적인 분석 과정을 지원합니다. 시장 맥락을 고려한 분석 개별 신호의 의미는 시장 상황에 따라 달라집니다. Boba Analysis Suite는 현재 차트 상황을 더 넓은 시장 구조와 연결하고, 사전에 정한 규칙에 따라 매매 아이디어를 검토할 수 있도록 돕습니다. 주요 분석 기능은 다음과 같습니다. 추세 및 시장 구조: 시장 방향과 관련 구조적 맥락을 평가합니다. 주요 가격 영역 및 수준: 추가 분석이 필요한 중요한 영역을 차트에 시각적으로 표시합니다. 여러 시간대: 서로 다른 시간대의 정보를 통합하여 전반적인 시장 상황을 평가합니다.
ScalpPoint
Temirlan Kdyrkhan
ScalpPoint is a powerful trading companion designed to generate high-probability entry signals with dynamic TP/SL/DP levels based on volatility. Built-in performance tracking shows win/loss stats, PP1/PP2 hits, and success rates — all updated live. Key Features: Buy/Sell signals with adaptive volatility bands Real-time TP/SL/DP levels based on ATR Built-in MA Filter with optional ATR/StdDev volatility Performance stats panel (Success, Profit/Loss, PP1/PP2) Alerts via popup, sound, push, or emai
Scalper Vault MT5
Oleg Rodin
5 (1)
Scalper Vault는 당일 매매(intraday trading)에서 일관된 성과를 내고자 하는 트레이더를 위해 설계된, 강력하고 모든 기능을 갖춘 트레이딩 시스템입니다. 이 고정밀 지표는 외환(Forex) 및 바이너리 옵션 트레이더 모두에게 기관급 분석을 제공하는 독립적인 종합 트레이딩 시스템 역할을 합니다. 구매 후 저에게 연락해 주시면, 트레이딩 팁과 함께 특별한 보너스를 제공해 드립니다! Scalper Vault는 추측에 의존하거나 복잡한 수동 분석을 할 필요를 없애주며, 사용하기 쉬운 트레이딩 기법을 통해 오직 매매 실행에만 집중할 수 있도록 돕습니다. 정확한 추세 추종 신호: 핵심 알고리즘이 시장 구조를 분석하여, 지배적인 시장 추세 방향과 일치하는 고확률 신호만을 제공함으로써 잘못된 진입을 획기적으로 줄여줍니다. 정밀한 고점 및 저점 탐지: 시장의 움직임이 소진되는 지점을 스캔하여 잠재적인 반전 구간을 식별합니다. 간(Gann) 이론 기반의 매수/매도 구간: 수학적
Apex Patterns PRO 인디케이터 구매 시 - 기반 Expert Advisor 무료 제공. 자체 최적화 차트 패턴 및 브레이크아웃 분석 시스템 기존의 패턴 스캐너는 고정된 파라미터에 의존하므로 시장 변동성과 구조가 변화할 때 성능이 저하되는 경우가 많습니다. Apex Patterns PRO는 구조적 차트 패턴 인식, 모멘텀 필터링, 통계적 자체 최적화를 하나의 분석 프레임워크로 결합하여 변화하는 시장 환경에 적응하도록 설계되었습니다. 적응형 스캐닝 엔진 자체 최적화 패턴 모드 최근 과거 데이터를 바탕으로 적절한 패턴 파라미터를 자동으로 탐색하여, 정적인 설정 대신 현재 시장 행보에 맞춰 인디케이터의 구조 감지 방식을 적응시킵니다. 스마트 브레이크아웃 필터링 클래식 패턴 인식과 모멘텀, 거래량, 프라이스 액션 지표를 결합합니다. 모든 브레이크아웃을 동일하게 다루는 대신, 시장의 기저 구조를 평가하여 현재 통계적 환경에 부합하는 셋업을 식별합니다. 주요 기능 리페인트 없는 고
Crystal Heikin Ashi Signals
Muhammad Jawad Shabir
5 (5)
Crystal Heikin Ashi Signals—Professional Trend & Signal Detection Indicator Advanced Heikin Ashi Visualization with Intelligent Signal System for Manual & Automated Trading Final Price: $149 ---------> Price goes up $10 after every 10 sales . Limited slots available — act fast . Overview User Guide PDF Crystal Heikin Ashi Signals is a professional-grade MetaTrader 5 indicator that combines pure Heikin Ashi candle visualization with an advanced momentum-shift detection system. Designed for both m
Volatility Master for MetaTrader is a real-time dashboard tool that scans up to  50 symbols  to identify high-volatility , trending markets instantly. With bullish/bearish signals, customizable alerts, and a user-friendly interface, it helps you avoid range-bound conditions and focus on high-probability trades. Clarity leads to confidence. Trade confidently and protect your capital effectively with this powerful dashboard. We don't offer free or bonus indicators in exchange of reviews from you.
SIO Oscillator
Davit Beridze
SIO Oscillator: 자기 최적화 세미분산 불균형 오실레이터 지표를 구매하시면 이를 기반으로 한 전문가 어드바이저(EA)를 무료로 받으실 수 있습니다. 대부분의 오실레이터는 모든 가격 움직임을 똑같이 취급합니다. SIO는 상승 압력과 하락 압력을 분리하여 둘 사이의 불균형을 측정하고, 매수자와 매도자 중 어느 쪽이 실제로 시장을 주도하고 있는지 보여줍니다. 불균형이 극단에 도달하면 SIO는 진입가, 손절(Stop Loss), 익절(Take Profit) 수준이 포함된 명확한 신호를 표시합니다. SIO의 차별점은 고정된 설정에 의존하지 않는다는 것입니다. 내장된 자기 최적화 엔진이 현재 종목과 시간 프레임에 맞는 파라미터를 지속적으로 탐색하고, 사용하기 전에 검증합니다. 두 가지 신호 모드 평균 회귀(Mean Reversion): 불균형의 극단에서 거래하며 균형으로의 복귀를 노립니다. 추세 추종(Trend Following): 지속적이고 우세한 불균형의 방향으로 거래합니다. 자
Dynamic Forex28 Navigator MT5
Bernhard Schweigert
5 (1)
다중 통화 강도 및 모멘텀 지표 MT5 Dynamic Forex28 Navigator는 오랫동안 사랑받아 온 저희 지표의 진화 버전으로, 세 가지 기능을 하나로 결합했습니다: Advanced Currency Strength28 Indicator (리뷰 700개) Advanced Currency IMPULSE with ALERT (리뷰 530개) CS28 Combo Signals (최근 보너스) 두 이전 지표는 MQL5 Market에서 합계 1,200개가 넘는 리뷰를 받았으며 2016년부터 MT4 커뮤니티의 필수품이었습니다. Dynamic Forex28 Navigator MT5는 검증된 동일한 로직을 그대로 이어갑니다. MetaTrader 5를 위해 완전히 다시 제작 – MT5의 네이티브 다중 심볼 아키텍처를 최대한 활용하도록 설계되었습니다. 사용 설명서: https://www.mql5.com/en/blogs/post/758844 MT4 버전을 찾고 계신가요? 여기를 클릭하세요: ht
Neuro Poseidon MT5
Daria Rezueva
4.68 (53)
Neuro Poseidon is a new indicator by Daria Rezueva. It combines precise trading signals with adaptive TP/SL levels - creating best possible trades as a result! Message me and get  Neuro Poseidon Assistant  as a gift to automize your trading process! What makes it stand out? 1. Proven profitability on all assets and timeframes 2. Only confirmed BUY and SELL signals present on the chart 3. Adaptive TP & SL levels generated by the software for each trade 4. Easy to understand - suitable for al
AriFocus
Temirlan Kdyrkhan
AriFocus - Non-Repainting Buy/Sell Signals AriFocus - one clear signal. AriFocus marks buy and sell signals directly on the chart and suggests a stop-loss level for each one. Every signal is confirmed on bar close and never repaints. - Buy/sell arrows, confirmed on bar close - Suggested stop-loss level for every signal - Trend band and candle coloring to show direction at a glance - 10 ready-made presets, or your own settings (14 calculation methods) - Pop-up, push and email alerts with entr
통화 강도 마법사는 성공적인 거래를 위한 올인원 솔루션을 제공하는 매우 강력한 지표입니다. 표시기는 여러 시간 프레임의 모든 통화 데이터를 사용하여 이 또는 해당 외환 쌍의 힘을 계산합니다. 이 데이터는 특정 통화의 힘을 확인하는 데 사용할 수 있는 사용하기 쉬운 통화 지수 및 통화 전력선의 형태로 표시됩니다. 필요한 것은 거래하려는 차트에 표시기를 부착하는 것뿐입니다. 표시기는 거래하는 통화의 실제 강세를 보여줍니다. 지표는 또한 추세와 거래할 때 유리하게 사용할 수 있는 구매 및 판매 거래량 압력의 극한값을 보여줍니다. 지표는 또한 피보나치에 기반한 가능한 대상을 보여줍니다. 표시기는 PUSH 알림을 포함한 모든 유형의 알림을 제공합니다. 구매 후 연락주세요. 나는 당신과 거래 팁을 공유하고 당신에게 무료로 훌륭한 보너스 지표를 줄 것입니다! 나는 당신에게 행복하고 유익한 거래를 기원합니다!
Advance AI Scanner
Mohamed Samsudeen
5 (1)
Advance AI Scanner is a multi-symbol analysis indicator for MetaTrader 5. It scans Forex pairs, metals, energy, stock indices and cryptocurrencies at the same time and rates each instrument with its own self-training model. It explains in plain English what moved each market and why, and it estimates how far upcoming economic news usually moves each symbol, measured on your broker's own price history. $199 instead of $499. 10 copies left at this price. One time purchase  Installation and User
Azimuth Pro
Ottaviano De Cicco
5 (7)
Azimuth Pro V2: Synthetic Fractal Structure and Confirmed Entries for MT5 Overview Azimuth Pro is a multi-level swing structure indicator by Merkava Labs . Four nested swing layers, swing-anchored VWAP, ABC pattern detection, three-timeframe structural filtering, and closed-bar confirmed entries — one chart, one workflow from micro-swings to macro-cycles. This is not a blind signal product. It is a structure-first workflow for traders who care about location, context, and timing. Halloween P
SkyHammer Signal Pro
Shengzu Zhong
5 (4)
SkyHammer Signal Pro Entry, SL, TP 레벨이 고정되는 전문 No-Repaint 추세 신호 인디케이터 SkyHammer Signal Pro는 명확하고 고정되며 검증 가능한 신호를 원하는 트레이더를 위해 설계된 구조적인 추세 및 모멘텀 신호 인디케이터입니다. 특히 M1 및 M5 같은 낮은 시간대에서 가장 효과적으로 작동합니다. 이 인디케이터는 시장의 고점이나 저점을 예측하려고 하지 않습니다. 대신 신호를 생성하기 전에 확인된 시장 구조, 추세 방향, 모멘텀 강도, 건강한 변동성, 그리고 목표까지의 충분한 공간을 기다립니다. 주요 기능 고정 신호 메커니즘 신호가 확인되면 화살표, Entry, Stop Loss, TP1, TP2 레벨이 차트에 영구적으로 고정됩니다. 이후 캔들 움직임 때문에 신호가 사라지거나, 이동하거나, 변경되지 않습니다. 이를 통해 트레이더는 각 신호를 명확하게 검토할 수 있으며, 실시간 시장에서 신호가 사라지는 일반적인 문제를 피할 수 있습니다
Bill Williams Advanced
Siarhei Vashchylka
5 (11)
Bill Williams Advanced is designed for automatic chart analysis using Bill Williams' "Profitunity" system. The indicator analyzes four timeframes at once. Manual (Be sure to read before purchasing) Advantages 1. Analyzes the chart using Bill Williams' "Profitunity" system. Signals are displayed in a table in the corner of the screen and on the price chart. 2. Finds all known AO and AC signals, as well as zone signals. Equipped with a trend filter based on the Alligator. 3. Finds "Divergence Bar
Power Candles MT5
Daniel Stein
4.58 (12)
Power Candles V3 - 자체 최적화 강도 지표 파워 캔들 V3는 적용된 모든 차트에서 통화 및 상품의 강세를 실행 가능한 거래 계획으로 전환합니다. 단순히 캔들에 색상을 입히는 대신, 백그라운드에서 실시간 자동 최적화를 수행하여 현재 보고 있는 종목에 대한 최적의 손절매, 익절 및 신호 임계값을 제공합니다. 한 번의 클릭으로 실시간 거래에 적용할 수 있으며, 진입점, 손절매 및 익절 선이 정확한 가격에 맞춰 차트에 표시되고, 방향과 함께 알림이 발령됩니다. 이 도구는 Stein Investments 에코시스템의 일부입니다. 18개 이상의 도구와 함께 당신의 1대1 AI 트레이딩 멘토 Max.  항상 대기 중, 모든 인디케이터를 깊이 있게 이해, 무언가를 차근차근 생각해보고 싶은 순간에 도움을 줍니다.  https://stein.investments 에서 만나보세요 매 종가 바마다 3,000회 이상의 트레이딩 시뮬레이션. 9가지 강도 상태. 2가지 전략을 병렬로 테스트.
Murrey Math Classic
Sarvarbek Abduvoxobov
5 (2)
Murrey Math Classic Murrey Math Classic 은 금융 시장의 가격 변동을 수학적 정밀함으로 예측하도록 설계된 전문적이고 역동적인 트레이딩 지표입니다. 이 시스템은 전설적인 가격-시간 기하학을 현대화하여 현대 금융 시장에 적합한 고도로 구조화된 수학적 모델로 변환했습니다. 머레이 수학(Murrey Math)의 핵심 논리는 금융 시장이 무작위로 움직이지 않고 특정 리듬에 따라 움직인다는 것입니다. 음악이 한 옥타브의 8개 음으로 나뉘는 것처럼, 주어진 가격 범위는 0/8부터 8/8까지 8개의 동일한 수학적 레벨로 나뉩니다. 이 선들은 숨겨져 있고 신뢰도가 높은 지지 및 저항 영역으로 작용하여, 가격이 도달하기도 전에 잠재적 반전 지점을 드러내 줍니다. Code2Profit 채널 지표 작동 방식 | 전체 전략 개요 궁극의 다중 확인 진입 전략 설명 Murrey Math Classic이 기존 지표보다 우수한 이유 Murrey Math Classic:
Divergence Bomber
Ihor Otkydach
4.89 (94)
이 지표를 구매하신 분께는 다음과 같은 혜택이 무료로 제공됩니다: 각 거래를 자동으로 관리하고, 손절/익절 수준을 설정하며, 전략 규칙에 따라 거래를 종료하는 전용 도우미 툴 "Bomber Utility" 다양한 자산에 맞게 지표를 설정할 수 있는 셋업 파일(Set Files) "최소 위험", "균형 잡힌 위험", "관망 전략" 모드로 설정 가능한 Bomber Utility의 셋업 파일 이 전략을 빠르게 설치, 설정, 시작할 수 있도록 돕는 단계별 영상 매뉴얼 주의: 위의 모든 보너스를 받기 위해서는 MQL5 개인 메시지 시스템을 통해 판매자에게 연락해 주세요. 독창적인 커스텀 지표인 “Divergence Bomber(다이버전스 봄버)”를 소개합니다. 이 지표는 MACD 다이버전스(괴리) 전략을 기반으로 한 올인원(All-in-One) 거래 시스템입니다. 이 기술 지표의 주요 목적은 가격과 MACD 지표 간의 다이버전스를 감지하고, **향후 가격이 어느 방향으로 움직일지를 알려주
Superhero
Ihor Otkydach
5 (3)
SUPERHERO 지표는 “올인원” 방식으로 설계된 다중 통화 거래 시스템입니다. 이 지표는 시장을 독자적으로 분석하여 포지션을 개설하고 청산할 시점에 대한 신호를 제공합니다. 손절매(Stop Loss) 및 익절(Take Profit) 주문을 활용하며, 위험 대비 수익 비율(R:R)은 1:1입니다. 이 시스템은 스마트폰으로 푸시 알림을 전송할 수 있으므로, PC에 묶여 있을 필요 없이 “이동 중에도” 매매를 할 수 있습니다. 이는 자체 거래 전문 회사에 안성맞춤입니다. 모든 고객님께 드리는 특별 혜택: 이 지표를 구매하시는 모든 분께는 제가 특별히 준비한 유틸리티를 선물로 드릴 예정이며, 이 유틸리티는 다음과 같은 기능을 제공합니다: 손절매 및 익절 주문을 자동으로 설정합니다 가격이 목표 수준에 도달하면 자동으로 포지션을 청산합니다 미결제 주문 거래를 지원합니다 평균화 거래 모드를 지원합니다 이 훌륭하고 매우 편리한 유틸리티를 선물로 받고 싶으시다면, SUPERHERO 지표를 구매하
Trend Lines PRO MT5
Roman Podpora
5 (1)
트렌드 라인즈 프로       이 지표는 시장이 실제로 어떤 방향으로 전환되는지 파악하는 데 도움이 됩니다. 실제 추세 반전 지점과 주요 시장 참여자들이 다시 진입하는 지점을 보여줍니다. 보시다시피       BOS 라인       복잡한 설정이나 불필요한 노이즈 없이 더 높은 시간대의 추세 변화와 주요 레벨을 확인할 수 있습니다. 신호는 차트에 다시 그려지지 않고 캔들이 마감된 후에도 계속 표시됩니다. VERSION MT 4   -   RFI LEVELS PRO   표시기   와 결합할 때 최대 잠재력을 발휘합니다. 지표가 보여주는 내용: 실제 변화       추세(BOS 라인) 한 번 신호가 나타나면 그 신호는 계속 유효합니다! 이는 신호를 발생시킨 후 변경될 수 있는 리페인팅 방식의 지표와 중요한 차이점입니다. 리페인팅 방식의 지표는 잠재적으로 자금 손실로 이어질 수 있습니다. 이제 더욱 높은 확률과 정확도로 시장에 진입할 수 있습니다. 또한 화살표가 나타난 후 목표가(익절)
FootPrint Chart MT5
Gayathiri Gopalakrishnan
5 (1)
Turn every candle into a bid x ask footprint built from real tick data. See who is actually trading at each price, with delta, volume profile, imbalance zones and a scored setup engine that prints entry, stop and target Order Flow Footprint Chart Pro Most indicators tell you what price did. This one tells you who did it. Order Flow Footprint Chart Pro rebuilds every candle on your chart from raw tick data and shows you the volume that traded at each individual price inside it, split into the am
제작자의 제품 더 보기
Swing Breakout EA
George Kamwanga
5 (2)
Swing Breakout EA is a fully automated breakout trading system designed for swing traders who prefer clean trend-following setups on the Daily timeframe. The EA identifies strong directional momentum, waits for controlled retracements, and executes trades only after breakout confirmation. This helps reduce false entries and avoids chasing overextended moves. The strategy is optimized for major Forex pairs and Gold while maintaining adaptability to changing market conditions. How the Strategy Wor
FREE
KeyLevels - trade psychological price points. What is this tool? A semi-automated 'round-numbers' trading tool. What are round numbers? Prices levels that traders round-off for market reading convenience, these levels are 'key' because they are constantly watched and reacted to.  How does the tool work? It calculates and draws key levels at round numbers based on defined spacing for the traded asset. Clicking a level opens a pending order ticket at that price, for a quick, consistent entry. H
Most traders know position size drives long-term results. Few know whether theirs is sensible. The Kelly Criterion answers that question, but it lives in spreadsheets or in your head, so you check it rarely, and never at the moment you size a trade. The cost is quiet. Bet too much for your edge and growth erodes, even with a sound strategy. Bet too little and growth is left on the table. Neither error announces itself. Kelly Risk Panel sits on your chart and answers one question: is my current
필터:
리뷰 없음
리뷰 답변