TPO Dashboard

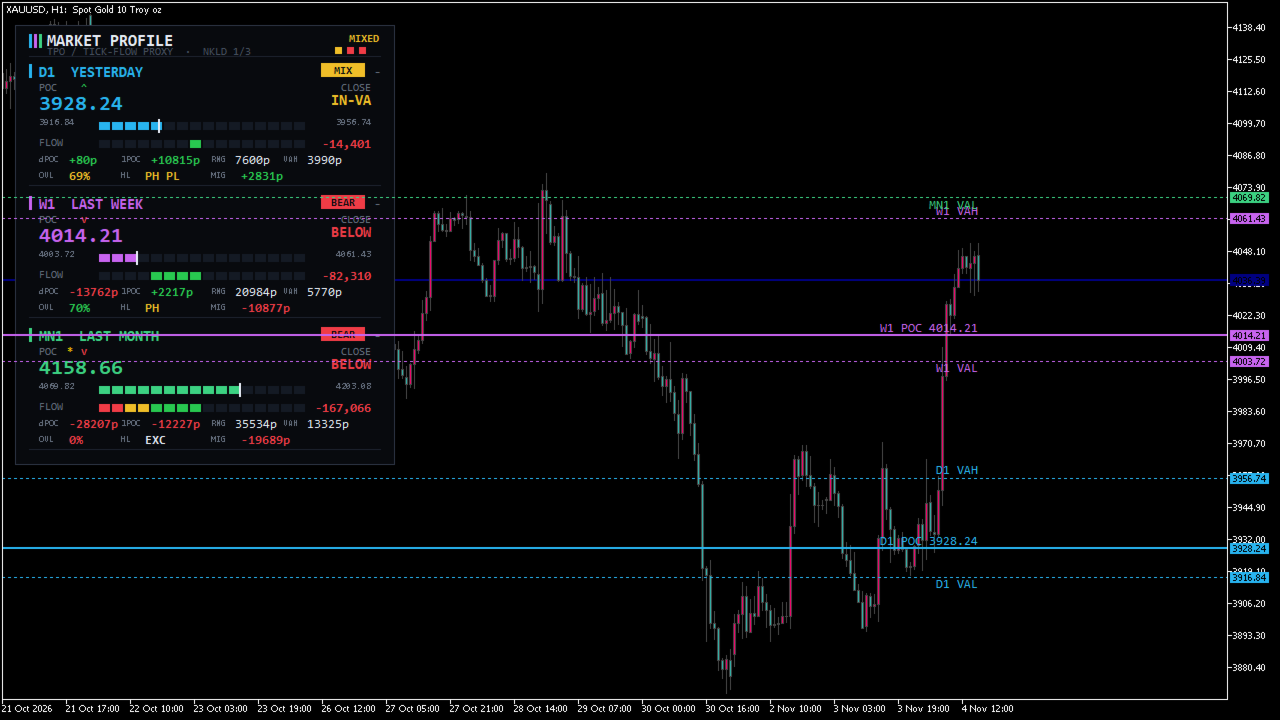
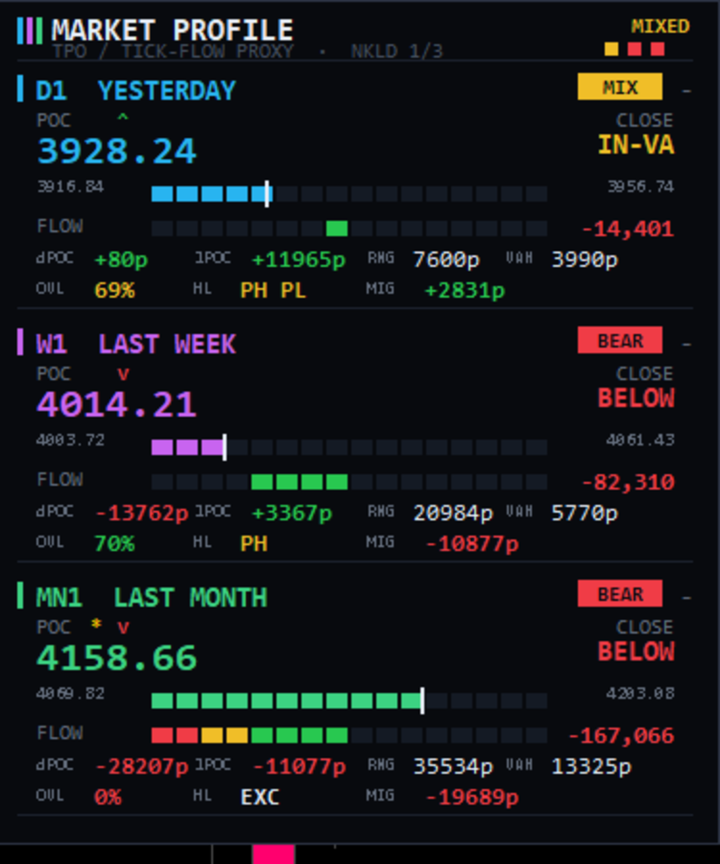
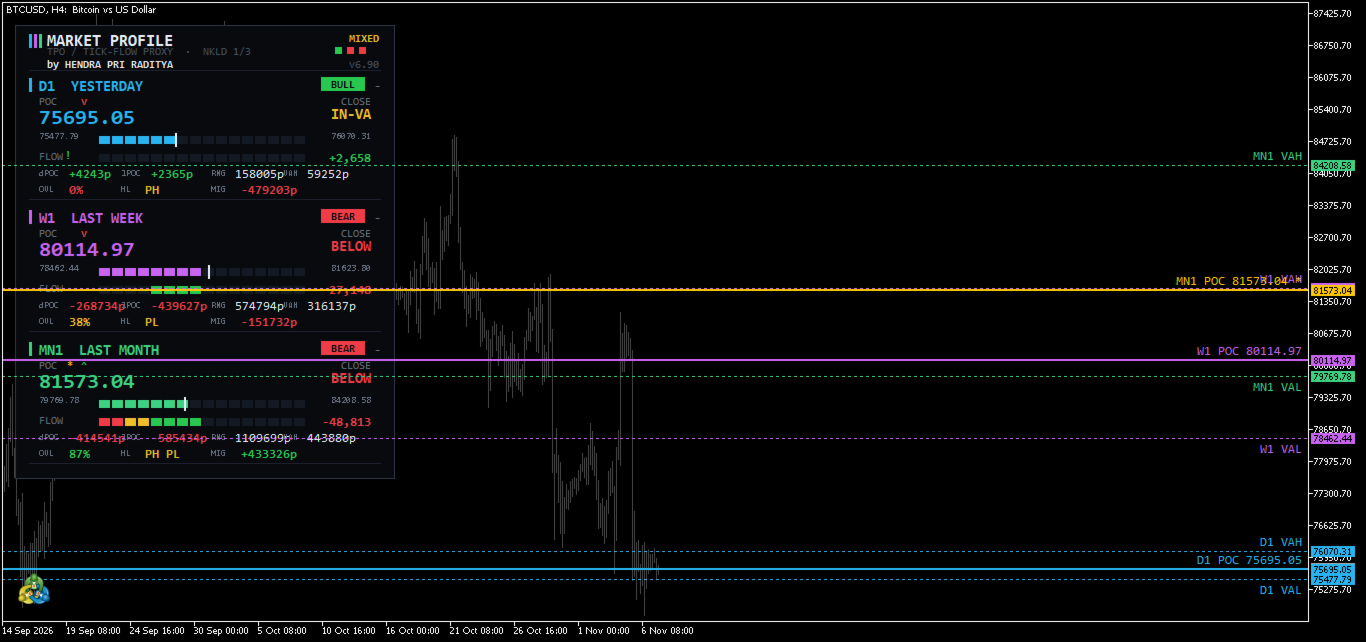
TPO Market Profile Levels — Plug & Play by HENDRA PRI RADITYA An on-chart Market Profile (TPO) analysis tool that highlights the most relevant price levels of the current Daily, Weekly and Monthly periods, together with a compact dashboard summarising the current market structure. WHAT IT SHOWS - POC (Point of Control) for the Daily, Weekly and Monthly period. - VAH and VAL (Value Area High / Low) for each period. - A naked POC marker, so a POC that has not yet been revisited stays visible. - Period statistics: range, value area width, migration, overlap and bias. - A tick-flow proxy reading that describes the intraday pressure inside the period (a volume-based estimate, not real bid/ask order flow). - A consensus line that summarises the agreement between the three periods. HOW IT BEHAVES - Plug and play: no input parameters. Attach the indicator and it starts drawing immediately with a fixed, consistent layout. - Price labels are always placed on the right side of the chart and stay attached to the level they describe when you change timeframe, zoom or scroll. - Lines never cross the label text, and labels of levels that are outside the visible chart area are removed automatically. - Own object prefix, so the indicator never touches objects of other programs, templates or your own drawings. - Works on any instrument and any chart timeframe: the periods are always built from Daily, Weekly and Monthly data. RECOMMENDED USE - Read the three periods together: the Monthly and Weekly levels describe the larger balance areas, the Daily level describes the current session. - Use the POC as the reference price of balance and the value area as the accepted trading range of the period. - Use the dashboard as context for your own decision process, not as a standalone buy or sell signal. NOTES - The indicator is an analysis tool. It does not open, modify or close orders and it does not provide trading advice. - Readings depend on the history available from your broker; on a new symbol allow the terminal a moment to download the data. - The flow reading is a proxy based on tick volume, not exchange-level bid/ask delta. Author: HENDRA PRI RADITYA Version: 6.90
추천 제품
The  OBV MTF  is an Enterprise-grade On-Balance Volume indicator that transforms standard OBV into a complete trading system. It combines gradient-aware momentum analysis, divergence detection, multi-timeframe alignment, and dynamic customisable midpoint-filtering in a single intuitive professional volume analysis tool. Core Features 1. 5-State Momentum Engine Aqua (Strong Bullish) : OBV slope rising with positive acceleration SteelBlue (Weak Bullish) : OBV rising but losing momentum Gray (Neutr
MFOP Market Forecast
Oscar Josue Pin Bacuzoy
Develop this indicator for periods of 30 minutes or more, focus on getting market trends right and making sure they are met. MFOP v8.1 gets straight to the point: it scans the market and tells you exactly when there is enough strength to enter a trade. This indicator doesn't do magic, it uses mathematical algorithms to filter out market noise, not enter into false breakouts and show you clear BUY (blue arrow) and SELL (red arrow) opportunities. It is designed and optimized specifically to take
Market Structure Evaluator MTF Market Structure Evaluator MTF is an institutional-grade price action indicator designed for Smart Money Concepts (SMC) and Market Structure traders. It automatically tracks Market Structure Breaks ( BOS ) and Change of Character ( CHOCH ) in real-time across multiple timeframes, giving you a complete macro-to-micro view of market trend alignment without cluttering your charts or having to analyse other timeframes. Whether you trade manually or build automated tr
Introduction to Fractal Pattern Scanner Fractal Indicator refers to the technical indicator that makes use of the fractal geometry found in the financial market. Fractal Pattern Scanner is the advanced Fractal Indicator that brings the latest trading technology after the extensive research and development work in the fractal geometry in the financial market. The most important feature in Fractal Pattern Scanner is the ability to measure the turning point probability as well as the trend probabil
RelicusRoad Dynamic Circles는 MetaTrader 4와 MetaTrader 5용 스윙 고점·저점 지표로, 9봉, 60봉, 156봉이라는 세 가지 관찰 구간에서 동시에 전환점을 원으로 표시합니다. 작은 전환과 큰 전환이 같은 차트에 있지만 서로 다르게 보입니다. 짧은 구간의 점은 작은 스윙을 보여주고, 더 큰 중간·긴 구간의 고리는 훨씬 긴 구간의 극값일 때만 나타납니다. 각 원에는 HH(60)이나 LL(156) 같은 짧은 텍스트 라벨이 붙을 수 있습니다. 작동 방식 모든 봉에 대해 지표는 그 봉의 고가가 직전 N봉(해당 봉 포함) 중 가장 높은 고가인지 확인합니다. 그렇다면 그 봉에 High 원이 표시됩니다. Low도 같은 방식으로 확인됩니다. 이 검사는 과거만 살펴보므로 봉이 지금까지의 극값이 되는 즉시 표시될 수 있습니다. 같은 검사가 각 구간마다 한 번씩, 총 세 번 실행됩니다: 짧은 구간: 기본값 9봉, 작은 점으로 표시. 중간 구간: 기본값 60봉, 고
Apex Heat Zone
Alier Nunez Fonseca
Veltrion Smart Fibonacci   is a clean automatic Fibonacci structure overlay for MetaTrader 5. It automatically detects recent swing highs and swing lows, then draws key Fibonacci retracement levels directly on the chart. The indicator is designed to help traders visualize market structure, retracement zones, and the golden zone without manually drawing Fibonacci tools. Key Features Automatic swing high and swing low detection Clean Fibonacci retracement overlay Horizontal Fibonacci levels for a
Gf Breakout
Kayode George Absi
A ZigZag indicator for MetaTrader 5 that finds swing highs and lows, spots W-bottom and M-top patterns, and gives a BUY or SELL signal when the second leg of a pattern forms at an H1 swing point and price breaks the trendline. 1. Key advantages See the structure at a glance. Clear red ZigZag lines join the major swings, with a down arrow on every swing high and an up arrow on every swing low. Trade with the higher timeframe. On M1, M5 or M15, a signal only appears when the second leg sits on an
Anchored VWAP Trading Indicator Struggling to identify true market value and key support/resistance levels? The Anchored VWAP Trading Indicator helps you track price based on real traded volume, giving you a clear edge in your trading decisions. This tool allows you to anchor VWAP from any point on the chart, making it ideal for analyzing trends, reversals, and institutional activity. Key Features Anchored VWAP from any candle Accurate volume-weighted price calculation Works on all symbol
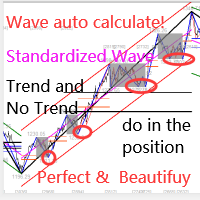
이 지표는 실제 거래에 완벽한 자동 파동 분석 지표입니다! 사례... 참고:   웨이브 그레이딩에 서양식 이름을 사용하는 데 익숙하지 않습니다. Tang Lun(Tang Zhong Shuo Zen)의 명명 규칙의 영향으로 기본 웨이브를   펜   으로 명명하고 2차 웨이브 밴드를   세그먼트   로 명명했습니다. 동시에, 세그먼트에는 추세 방향이 있습니다.   주요 추세 세그먼트에는   이름이 지정되지만(이 이름 지정 방법은 향후 노트에서 사용됩니다. 먼저 말씀드리겠습니다.) 알고리즘은 굴곡 이론과 거의 관련이 없으므로 그렇게 해서는 안 됩니다. 이는 나의 시장 분석을   통해 요약된 끊임없이 변화하고 복잡한 운영 규칙을   반영합니다. 밴드는 더 이상 사람마다 다르지 않도록 표준화되고 정의되었습니다. 인위적인 간섭의 드로잉 방법은 시장 진입을 엄격하게 분석하는 데 핵심적인 역할을 합니다. 이 지표를 사용하는 것은 거래 인터페이스의 미학을 개선하고 원래의 K-line 거래를
Ultimate Double Top & Bottom (Pro Volume Matrix) Stop trading retail breakouts. Start trading Institutional Traps. The   Ultimate Double Top & Bottom   is not a standard, lagging pattern scanner. It is a highly advanced, non-repainting structural engine equipped with a proprietary   3-Leg Volume Matrix . Designed exclusively for Smart Money Concepts (SMC) and order flow traders, this indicator mathematically dissects the tick volume inside M and W patterns to reveal true institutional intent:  
Introduction This indicator detects volume spread patterns for buy and sell opportunity. The patterns include demand and supply patterns. You might use each pattern for trading. However, these patterns are best used to detect the demand zone (=accumulation area) and supply zone (=distribution area). Demand pattern indicates generally potential buying opportunity. Supply pattern indicates generally potential selling opportunity. These are the underlying patterns rather than direct price action. T
Product Name: FXmans Pro SMC Structure Description: Navigate the markets with institutional precision. FXmans Pro SMC Structure is an advanced, algorithmically optimized indicator designed to decode Smart Money Concepts (SMC) directly on your chart. Built on a highly secure and lightweight engine, this tool avoids the lag of standard pivot points by utilizing Bill Williams' Fractal logic for laser-accurate market structure mapping. Whether you are a day trader or a swing trader, this indicator f
Aurum mid quant pro
N'da Lemissa Kouame
AURUM MID-QUANT PRO v5.60 Quantitative Excellence for Gold (XAU/USD) & Volatility Trading Gain a professional edge over institutional markets with AURUM MID-QUANT PRO , an advanced Price Action Pattern Detection and Breakout Engine designed exclusively for MetaTrader 5 . Built specifically to capture the unique volatility of Gold (XAU/USD) and other major financial instruments, this powerful indicator combines high-precision algorithmic pattern recognition with real-time dynamic accumulation z
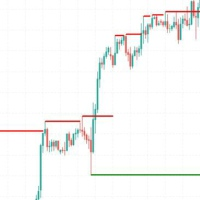
Descriptions A point point is a technical analysis indicator, or calculations, used to determine the overall trend of market over different time frames. This indicator calculate the highest or lowest pivots among left x and right y bars and show the high/low level during that period.   From that, you could clearly see the top resistance & bottom support level and how market goes break out. Instructions pivotLeft - pivot left bar count pivotRight - pivot right bar count pivotHighColor - color
Drawing Pack MT5
John Louis Fernando Diamante
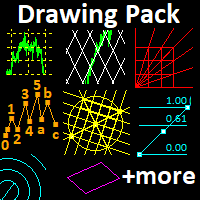
This indicator provides several drawing tools to assist in various methods of chart analysis. The drawings will keep their proportions (according to their handle trendline) across different chart scales, update in real time, and multiple drawings are supported. # Drawing Option Description  1 Grid box draggable boxed grid, user defines rows x colums, diagonal ray option  2 Grid partial or fullscreen grid, sized by handle line  3 Grid flex a diagonal grid, sized and sloped by handle line  4 Cyc
StretchTurnLevels
Kaustubh Pradeep Deshmukh
Stretch Turn Levels marks turning points on the chart. Instead of arrows, it draws the level that matters for each turn and tints the candles while that turn is still in play. There are no buy or sell calls: it shows the situation, and you decide what to do with it. What you see on the chart Turn level - a line at the extreme of each turn: under an up turn, above a down turn. It runs to the right until a candle closes beyond it, so you can see at a glance whether the turn is still holding. Tinte
Orderflow Super Candles - Simple Footprint Chart Indicator Platform: MetaTrader 5 (MT5)  (The last screenshot shows the use of the DOM tool in conjunction with the product.) 1. Product Introduction Orderflow Super Candles is a professional charting tool based on underlying Tick data analysis, designed to provide traders with a deep "X-ray" view of the market. By parsing the buy and sell volume distribution within each candlestick, this indicator visualizes the hidden market microstructure. It
RSIScalperPro
PATRICK WENNING
RSIScalperPro를 소개합니다 - 메타트레이더 5용 RSI 기반의 혁신적인 인디케이터로, 1분 차트에서의 스캘핑에 최적화되어 있습니다! RSIScalperPro를 사용하면 정확한 진입 및 청산 신호를 제공하는 강력한 도구를 손에 넣을 수 있습니다. RSIScalperPro는 서로 다른 두 가지 RSI 지표를 사용하여 과매수 및 과매도 레벨에 대한 명확한 신호를 제공합니다. 2개의 RSI의 시간 프레임 및 제한 값을 원하는 대로 조정하여 트레이딩 전략에 최적화된 결과를 얻을 수 있습니다. 차트 상의 개별 화살표는 거래 진입 및 청산 타이밍을 쉽게 파악하는 데 도움이 됩니다. 또한 RSIScalperPro의 특징 중 하나는 사용자 정의 가능한 3개의 이동 평균선입니다. 이를 통해 트렌드의 방향을 판단하고 강력한 거래 신호를 확인하는 데 도움이 됩니다. 이를 통해 조기에 트렌드를 감지하고 수익성 높은 거래에 참여할 수 있습니다. 뿐만 아니라 RSIScalperPro는 새로운 거래
Bid Price Timer Indicator — 정밀한 타이밍과 스마트한 가격 추적! Bid Price Timer Indicator 는 시간, 정확도, 명확성 을 중요시하는 트레이더를 위해 설계된 강력한 도구입니다. 주요 기능: 고정 타이머 표시 – 타이머는 항상 차트의 오른쪽 에 표시되며, X_Offset 으로 위치를 조정할 수 있습니다. 실시간 가격 추적 – 타이머는 매수 호가 (Bid 가격) 에 따라 위아래로 부드럽게 이동 합니다. 자동 위치 조정 – 가격이 변경되면 타이머가 자동으로 새로운 가격 수준에 맞게 이동 합니다. 선택 가능한 수평선 표시 – 정확한 Bid 가격 수준 을 시각적으로 보여줍니다. ️ 1초 단위 실시간 업데이트 – 타이머는 매초 갱신되며 , 다음 캔들까지의 카운트다운 을 실시간으로 보여줍니다. 트레이더들이 좋아하는 이유: 정확한 캔들 마감 타이밍 을 예측할 수 있습니다 차트를 깔끔하고 현대적이며 직관적 으로
Vertex Structure Dashboard delivers a complete multi-timeframe market structure analysis in a single, compact panel. It monitors up to 9   timeframes simultaneously and displays trend bias, structural breaks, momentum, and value zones in real time — no tab-switching, no manual   tracking.   The panel is fully draggable and collapsible. Its position persists across timeframe changes through GlobalVariables, so your layout stays   exactly where you placed it.   How It Works   Each enabled tim
Breakout Scanner Pro
Emma-ekong Ben Eshiet
Breakout Scanner Indicator: The Ultimate 4-Candle Harami Breakout Detection System The Market Never Sleeps—But Now Your Scanning Does Imagine having a tireless assistant that watches every single symbol in your Market Watch, across multiple timeframes simultaneously, scanning for one of the most powerful reversal patterns in technical analysis—and delivering the results to you in a clean, actionable dashboard before you've even finished your morning coffee. That's exactly what the Breakout S
Ha Pullback Resume
Ich Khiem Nguyen
HA Pullback Resume MT5 Systematic Trend Retracement and Momentum Resumption Engine The HA Pullback Resume indicator for MetaTrader 5 provides an objective analytical framework designed to identify high-probability trend-continuation setups following shallow corrective pullbacks. Active intraday traders and scalpers frequently encounter execution timing errors during trend pauses: entering prematurely before a correction completes, suffering stop-outs from erratic boundary wicks during quiet cons
DYNAMIC SR TREND CHANNEL Dynamic SR Trend Channel is a simple indicator for trend detection as well as resistance/support levels on the current timeframe. It shows you areas where to expect possible change in trend direction and trend continuation. It works with any trading system (both price action and other trading system that use indicators) and is also very good for renko charting system as well. In an uptrend, the red line (main line) serves as the support and the blue line serves as the r
Smart Money Trap Detector 는 스윙 고점과 스윙 저점에서 유동성 함정을 식별합니다 . 가격이 핵심 수준을 돌파한 후 반전할 때 기관 투자자가 설정한 잠재적 불 트랩 또는 베어 트랩을 감지합니다 . 각 감지된 트랩은 꼬리 크기 , 반전 속도 , 거래량에 기반한 1~5 의 강도 점수를 받습니다 .   작동 원리 인디케이터는 설정 가능한 룩백 기간을 사용하여 스윙 고저점을 추적합니다 . 가격이 스윙 고점 또는 저점을 돌파하면 , 설정된 확인 캔들 수 내에 가격이 수준을 다시 통과하여 반전하는지 모니터링합니다 . 돌파 꼬리가 최소 ATR 비율 임계값을 충족하고 가격이 범위 내로 되돌아 마감하면 트랩이 확인됩니다 . 모든 신호는 리페인팅을 방지하기 위해 확인된 종가 바에 배치됩니다 .   시각적 기능 차트의 화살표가 확인된 불 트랩 ( 위쪽 화살표 ) 과 베어 트랩 ( 아래쪽 화살표 ) 을 표시 . 유동성 영역이 스윙 포인트 주변에 색상 사각형으로 그려짐 . 텍스트 레이블
The indicator determines a special pattern of Joe Dinapoli. It gives very high probability buy and sell signals. Indicator does not repaint. Indicator Usage Buy Signal ''B'' Entry : Market buy order at signal bar close Stop : Low of signal bar Take Profit : First swing high Sell Signal ''S'' Entry : Market sell order at signal bar close Stop : High of signal bar Take Profit : First swing low Indicator Parameters Fast EMA : External Parameter (should be kept as default) Slow EMA: External Param
SmartScalp Scanner는 MetaTrader 5(MT5) 전용으로 설계된 강력한 실시간 다중 필터 스캘핑 지표입니다. 이 지표는 최첨단 AI 분석과 독자적인 트레이딩 전략을 결합하여 개발된 고도화된 알고리즘을 기반으로 작동합니다. 엄격한 추세 분석(EMA), 모멘텀 오실레이터(RSI), 그리고 고급 캔들스틱 패턴 인식 기능을 통합하여 정확도 높은 스캘핑 신호를 생성합니다. 유료 버전을 구매하기 전에 데모 버전을 먼저 체험해 보실 수 있습니다! 주요 외환(Forex) 통화쌍, 금(XAUUSD), 암호화폐 등 어떤 자산을 거래하든, SmartScalp Scanner는 시장의 노이즈를 걸러내고 고품질의 거래 기회(셋업)에만 집중할 수 있도록 도와줍니다. === 주요 기능 === • 다중 계층 신호 필터링: 신호 발생 전 추세, 모멘텀, 캔들 구조를 종합적으로 평가하여 높은 정확도를 보장합니다. • 동적 플로팅 정보 패널: 현재 캔들 타이머, 핍(pip) 변동폭, 추세 상태,
Seasonal Pattern Trader
Dominik Patrick Doser
Disclaimer : Keep in mind that seasonal patterns are not always reliable. Therefore, thoughtful risk management is crucial to minimize losses.  Seasonal patterns in the financial world are like a well-guarded secret that successful investors use to their advantage. These patterns are recurring price movements that occur during specific periods or around special events. Additionally, there are also intraday patterns that repeat. For example, Uncle Ted from Forex Family suggests examining previou
SMC Market Blueprint
Alex Amuyunzu Raymond
SMC Market Blueprint Institutional Market Structure Analyzer Based on Smart Money and ICT Concepts Overview SMC Market Blueprint is a comprehensive institutional-grade indicator designed to decode the true structure of the market using Smart Money Concepts (SMC) and ICT (Inner Circle Trader) methodology. It maps the internal market framework — identifying structure shifts, liquidity zones, and order flow transitions across multiple timeframes — giving traders a clear blueprint of how institution
Saturated Trend
Vitalii Zakharuk
The Saturated Trend indicator simplifies your decision making process by recognizing reversals with a built-in algorithm and then confirming signals at support/resistance levels. Implements a type of technical analysis based on the idea that the market is cyclical. Thus, the indicator follows the market trend with great reliability, ignoring sharp market fluctuations and noise around the average price. The indicator can be used both for pipsing on short periods and for long-term trading.
이 제품의 구매자들이 또한 구매함
Trend Sniper X
Sarvarbek Abduvoxobov
4.86 (43)
Trend Sniper X 는 트레이더가 추세 방향과 잠재적 반전 지점을 명확하고 정확하게 포착할 수 있도록 도와주는 MetaTrader 5용 멀티 타임프레임 추세 추종 지표입니다. MT4용: https://www.mql5.com/en/market/product/193245 가격 정보: 현재 가격은 프로모션 할인가이며, 향후 업데이트 및 새로운 기능이 출시됨에 따라 변동될 수 있습니다. 보너스 혜택: 본 지표 전용 무료 자동매매 Assistant EA를 받으시려면 구매 후 작성자에게 메시지를 보내주시기 바랍니다. Code2Profit 채널 멀티 타임프레임 분석으로 시장을 마스터하세요! Trend Sniper X로 승률을 극대화하는 방법: 핵심 규칙 및 세션 팁 기술 사양 플랫폼 MetaTrader 5 지표 유형 멀티 타임프레임 추세 지표 운용 타임프레임 모든 차트 타임프레임 지원, 독립적으로 선택 가능한 상위 타임프레임(M1–MN1) 주요 상품 외환, 금(XAUUSD) 및 기타 C
Smart Trend Trading System — MetaTrader 5 구매 후 MQL5에서 저에게 메시지를 보내시면 Smart Universal Expert Advisor를 무료로 받으실 수 있으며, 온라인 강좌, PDF 매뉴얼 및 비공개 그룹 이용 권한도 함께 제공됩니다. STTS는 추세 방향, 진입·청산 신호, 반전 구간, 주요 가격 수준을 차트에 모아 보여줍니다. 시스템을 참고해 수동으로 거래하거나, 별도의 호환 EA를 연결하여 선택한 설정에 따라 자동으로 거래를 실행할 수 있습니다. 하나의 시스템, 네 가지 트레이딩 접근법 STTS의 트레이딩 접근법은 크게 네 가지로 나뉩니다. • 스캘핑 — 단기 신호와 시장 움직임을 살펴봅니다. • 추세 매매 — 방향을 평가하고 추세 안에서 기회를 찾습니다. • 반전 매매 — 잠재적인 전환 구간과 방향 변화를 파악합니다. • 거래량 매매 — 거래량 기반 정보로 시장 활동을 평가합니다. 진입·청산 화살표, 추세 정보, 지지·저항 수
새로운 왕의 등장 - 인디케이터 + 주문 관리 표시(TP1 + TP2 + TP3) + 선택형 텔레그램 시그널 전송 기능 포함 (무료) (완전한 트레이딩 및 시그널 시스템) 골드를 위한 최고의 EA: Gold Slayer 이 인디케이터는 고급 전략, 사용자 지정 가능한 주문 관리 시스템, 그리고 엔벨로프 확장을 결합한 평균 회귀(mean reversion) 시스템을 포함하고 있습니다. 또한 RSI와 같은 여러 지능형 확인 필터를 통해 높은 확률의 반전 진입 구간을 포착하여 BUY 및 SELL 시그널을 제공합니다. 단순히 거래 방법만 배우는 것이 아니라, 여러 포지션을 효과적으로 관리하고 이전에 수익 중인 오픈 포지션으로 손실 거래를 커버하는 방법까지 익힐 수 있습니다. M5 전용으로 설계 및 최적화되었으며, 유동성이 풍부해 시그널이 더 깔끔하고 신뢰도 높은 BTCUSD와 XAUUSD에서 뛰어난 성능을 발휘합니다. 이 인디케이터는 ATR 기반으로 자동 계산된 진입가, 손절가, 익절가와
SuperScalp Pro
Van Minh Nguyen
4.54 (37)
SuperScalp Pro - Professional Multi-Layer Confluence Scalping System SuperScalp Pro는 기존 Supertrend에 여러 지능형 확인 필터를 추가하여 기능을 강화한 고급 스캘핑 지표입니다. 잘못된 신호를 크게 줄이면서 성공 가능성이 더 높은 Buy/Sell 거래 기회를 식별하는 데 도움을 줍니다. 명확한 Buy 및 Sell 화살표가 차트에 직접 표시되며, ATR 기반 Stop Loss 및 Take Profit 레벨도 실시간으로 자동 계산됩니다. 구매 후 MQL5 메시지로 저에게 연락하시면 SuperScalp Pro Auto Trader EA를 무료로 받으실 수 있으며, 사용자 가이드와 비공개 그룹 이용 권한도 제공됩니다. 권장 설정 파일 다운로드: [Set File] 전체 문서는 제품 블로그에서 확인할 수 있습니다: [User Guide] 업데이트를 받으려면 공식 채널에 참여하세요: [Official Channel]
M5 Sniper
MeanFX
5 (4)
당신의 트레이딩 우위를 한눈에 확인하세요! M5 Sniper 는 MeanFX의 새로운 지표입니다. 정확한 트레이딩 신호 와 적응형 TP/SL 레벨 을 결합하여, 결과적으로 가능한 최고의 통계적 트레이딩을 만들어냅니다! 5회 구매마다 가격이 인상되며, 다음 가격은 69$입니다. 구매 후 저에게 메시지를 보내주시면 팁/가이드와 보너스 EA를 제공해 드립니다. 무엇이 이 지표를 특별하게 만들까요? Gold XAUUSD에서 검증된 통계적 성과 ( 거의 모든 자산에서 작동 하며, 일관된 결과 없이 모든 것을 다루려고 하기보다는 하나의 타임프레임을 완전히 익히는 데 집중합니다) 각 심볼당 하루 1~8회의 트레이드 와 높은 승률을 제공하며, 모든 통계적 우위를 우리의 편으로 가져갑니다. 차트에는 확인된 BUY 및 SELL 신호만 표시됩니다. 각 트레이드에 대해 지표가 생성하는 적응형 TP 및 SL 레벨 평균 승률 75%+ 평균 Signal Ratio 최소 1.1+ 알람 및 알림이 휴대폰 으로도
Entry Points Pro for MT5
Yury Orlov
4.52 (152)
Entry Points Pro는 주문을 넣기 전에 어디에서 진입하고, 스탑을 어디에 두고, 어떤 랏으로 거래할지 보여 줍니다. 화살표는 캔들이 마감될 때 나타나며 리페인팅되지 않습니다. 설정은 두 가지: 예치금과 거래당 리스크. 결제 전에 확인하세요: 무료 데모는 MT5 전략 테스터에서 작동하며 2분이면 됩니다. 구매 후에는 제가 직접 설정을 도와 드리겠습니다. 2019년, 저는 이 지표가 무엇을 할 수 있는지 전 세계에 보여 주었습니다. 실계좌에서 지표의 시그널에 따라 수동으로, 모두가 볼 수 있게 공개적으로 거래했습니다 — 계좌는 Myfxbook에서 모니터링되었고, 저는 이 실험을 Facebook에 자세히 공유했습니다. 결과: 4개월 만에 10,000달러가 941,411달러가 되었습니다. 리스크는 의도적으로 극단적이었습니다 — 드로다운은 54%까지 이르렀습니다. 우리 직업에서 수익과 리스크는 언제나 함께 가기 때문입니다. Myfxbook 스크린샷은 갤러리의 첫 번째 이미지입니다.
SMC Intraday Formula
VividMind Digital Solutions
5 (26)
먼저 솔직하게 말하겠습니다. 어떤 인디케이터도 단독으로 당신을 수익성 있게 만들어주지 않습니다. 누군가 그렇게 말한다면, 그는 당신에게 꿈을 파는 것입니다. 완벽한 매수/매도 화살표를 보여주는 모든 인디케이터는 완벽하게 보이도록 만들 수 있습니다 — 단지 올바른 과거 구간을 확대하고 승리한 거래만 캡처하면 됩니다. 우리는 그렇게 하지 않습니다.  SMC Intraday Formula는 도구입니다. 시장 구조를 읽고, 가장 높은 확률의 가격 구간을 표시하며, 현재 스마트 머니의 흐름이 어떻게 보이는지 아주 단순한 언어로 보여줍니다. 최종 결정은 여전히 당신이 합니다. 실행도 당신이 합니다. 하지만 이제는 희망이 아니라 정확성으로 거래하게 됩니다. 우리는 이 인디케이터를 지난 약 3년 동안 골드(XAUUSD) 및 주요 외환 통화쌍의 데이 트레이딩 스캘핑에 사용해 왔습니다. M1, M5, M15, M30에서 우리의 핵심 도구입니다. 이 도구는 미래를 예측하려 하지 않습니다 — 지금 형성
M1 Sniper MT5
Oleg Rodin
5 (7)
M1 SNIPER 는 사용하기 쉬운 거래 지표 시스템입니다. M1 시간대에 맞춰 설계된 화살표 지표입니다. 이 지표는 M1 시간대 스캘핑을 위한 단독 시스템으로 사용할 수 있으며, 기존 거래 시스템의 일부로도 사용할 수 있습니다. 이 거래 시스템은 M1 시간대 거래용으로 특별히 설계되었지만, 다른 시간대에도 사용할 수 있습니다. 원래는 XAUUSD와 BTCUSD 거래를 위해 이 방법을 설계했지만, 다른 시장 거래에도 유용하다는 것을 알게 되었습니다. 이 지표의 신호는 추세 방향과 반대로 거래될 수 있습니다. 저는 지표의 신호를 활용하여 양방향으로 거래할 수 있도록 돕는 특별한 거래 기법을 알려드립니다. 이 방법은 특별한 동적 지지선과 저항선 가격 영역을 활용하는 것을 기반으로 합니다. 구매하시면 M1 SNIPER 화살표 지표를 바로 다운로드하실 수 있습니다. 또한, 아래 스크린샷에 표시된 Apollo Dynamic SR 지표는 M1 SNIPER 도구를 사용하는 모든 사용자에게 무료로
Gann Made Easy MT5
Oleg Rodin
5 (13)
Gann Made Easy 는 mr.의 이론을 사용하여 최고의 거래 원칙을 기반으로 하는 전문적이고 사용하기 쉬운 Forex 거래 시스템입니다. W.D. 간. 이 표시기는 Stop Loss 및 Take Profit Levels를 포함하여 정확한 BUY 및 SELL 신호를 제공합니다. PUSH 알림을 사용하여 이동 중에도 거래할 수 있습니다. 구매 후 거래 방법 안내 및 유용한 추가 지표를 무료로 받으시려면 저에게 연락주세요! 아마도 Gann 거래 방법에 대해 이미 여러 번 들었을 것입니다. 일반적으로 Gann의 이론은 초보자 거래자뿐만 아니라 이미 거래 경험이 있는 사람들에게도 매우 복잡한 것입니다. Gann의 거래 방식은 이론적으로 적용하기 쉽지 않기 때문입니다. 나는 그 지식을 연마하고 Forex 지표에 최고의 원칙을 적용하기 위해 몇 년을 보냈습니다. 표시기는 적용하기가 매우 쉽습니다. 차트에 첨부하고 간단한 거래 권장 사항을 따르기만 하면 됩니다. 지표는 지속적으로 시장 분석
Ultra Indicator
Ihor Otkydach
5 (1)
ULTRA는 “올인원” 방식으로 작동하는 기술적 지표로, 시장을 독자적으로 분석하고, 매매 신호를 생성하며, 손절매 주문 설정 수준을 표시하고, 이익을 실현하거나 손실을 최소화하기 위해 포지션을 청산해야 할 시점을 제안합니다. 다시 말해, 시장을 분석하는 법을 모르거나, 가격 수준(손절매를 어디에 설정할지)을 파악하지 못하거나, 자금 관리에 어려움을 겪더라도 상관없습니다. ULTRA가 그 모든 것을 대신 해줄 테니까요! 구매자 특전 : ULTRA 지표를 구매하신 후, 저에게 비공개 메시지를 보내주시면 “ULTRA BOT”을 무료 선물로 드립니다. 이 도구는 해당 지표의 신호를 바탕으로 개설한 거래를 관리하는 데 도움을 주는 특별한 도구입니다(각 거래에 대해 손절매를 설정하고, 최상의 결과를 얻을 수 있도록 전략의 규칙에 따라 거래를 자동으로 청산해 줍니다).  또한 구매자분들께 다양한 자산에 바로 적용할 수 있는 설정값을 제공해 드리고 있으며, 이를 통해 지표가 최대 효율로 작동할
다음 업데이트 — 버전 2.52 곧 출시! [신규] 시장 분석 및 트레이딩 워크플로를 향상시키기 위해 설계된 4가지 주요 신규 기능을 기대해 주세요. 트레이딩 요구 사항을 충족하도록 설계된 4가지 새로운 기능으로 시장 분석을 한 단계 더 발전시킵니다. 다음 기능을 소개합니다: 1. TRADE OVERVIEW DASHBOARD 2. CONFLUENCE AT ZONE 3. STRONG & WEAK HIGH/LOW 4. OTE 1. TRADE OVERVIEW DASHBOARD 시장 전체 상황을 더 쉽게 파악할 수 있도록 도와주는 대시보드입니다. 트레이딩 의사결정을 지원하는 가이드를 제공하며, 하나의 화면에서 시장을 분석하고 체계적으로 트레이딩을 계획할 수 있도록 도와줍니다. 멀티 타임프레임 시장 개요 (Multi-Timeframe Market Overview) 시장 방향과 가격 구조를 더욱 명확하게 파악 시장 상황을 빠르게 확인 체계적인 시장 분석 및 진입 계획을 위한 가이드 2. CO
Adaptive Price Action Engine 지표를 구매하면 EA(자동매매 프로그램)가 무료 멀티 타임프레임 기반 자기 최적화 추세 & 캔들 패턴 분석 시스템 시장은 끊임없이 변화하며, 모든 Price Action 패턴이 모든 시장 환경에서 동일한 가치를 가지는 것은 아닙니다. Adaptive Price Action Engine 은 변화하는 시장 환경에 적응할 수 있도록 설계되었으며, 추세 구조, 멀티 타임프레임 분석, 캔들 패턴 및 통계적 최적화 를 하나의 분석 프레임워크로 결합합니다. 두 가지 적응형 모드 Dual Alpha Trend Mode 낮은 타임프레임과 높은 타임프레임에서 적합한 Alpha Trend 파라미터를 자동으로 탐색하여, 최근 시장 움직임에 맞춰 추세 분석을 조정합니다. Candlestick + Alpha Mode Alpha Trend를 통한 시장 국면 분석과 22개의 상승 및 하락 캔들 패턴 을 결합합니다. 모든 패턴을 동일하게 취급하는 대신, 다양
Auto Optimized SpeedAngle 은 지속적인 워크포워드 최적화(Walk-Forward Optimization, WFO)를 통해 곡선 적합(curve-fitting)을 제거한 기관 수준의 모멘텀 벡터화 시스템입니다. 시장 체제가 바뀔 때 성능이 떨어지는 정적 입력에 의존하는 대신, 이 지표는 표본 외(Out-of-Sample, OOS) 검증을 사용하여 매개변수를 동적으로 재보정하며, 표시되는 신호가 과거의 우연이 아닌 진정한 통계적 우위를 나타내도록 보장합니다. 핵심 기관용 프레임워크 워크포워드 최적화 엔진: 핵심 알고리즘은 수천 가지의 룩백(lookback) 및 임계값 조합을 지속적으로 스캔하며, 데이터를 인샘플(in-sample)과 표본 외(out-of-sample) 세트로 엄격하게 분리합니다. 미지의 데이터 환경에서 수학적 우수성이 증명된 경우에만 새로운 매개변수 구성을 채택합니다. 정량적 목적 함수: 순수한 총이익을 쫓는 대신, 최적화 엔진은 기관 수준의 안정성
FiboSniper Pro
Van Minh Nguyen
5 (4)
FiboSniper Pro – Multi-Filter Fibonacci System with Auto SL/TP and Control Panel FiboSniper Pro는 동적 Fibonacci Envelopes와 여러 확인 필터를 결합하여 선별된 Buy 및 Sell 신호를 생성하는 기술적 지표입니다. Fibonacci 레벨은 Moving Average와 ATR을 기반으로 계산된 후 ADX, EMA, RSI, ATR, Volume, Time 및 Candle 구조를 통해 필터링됩니다. 이 지표는 ATR 기반의 자동 Stop Loss 및 Take Profit 레벨을 차트에 직접 표시하며, 빠른 설정 조정을 위한 인터랙티브 Control Panel을 제공합니다. 구매 후 MQL5 메시지로 저에게 연락하시면 Auto Trader X를 무료로 받으실 수 있으며, 이 지표의 거래 신호를 자동화하는 방법에 대한 안내도 제공됩니다. User Guide 및 Set Files: [Click here
ARICoins
Temirlan Kdyrkhan
ARICoin is a powerful trading companion designed to generate high-probability entry signals with dynamic TP/SL/DP levels based on volatility. Built-in performance tracking shows win/loss stats, PP1/PP2 hits, and success rates all updated live. Key Features: Buy/Sell signals with adaptive volatility bands Real-time TP/SL/DP levels based on ATR Built-in MA Filter with optional ATR/StdDev volatility Performance stats panel (Success, Profit/Loss, PP1/PP2) Alerts via popup, sound, push, or email Cust
Boba Analysis Suite
Trade Ready Solutions LLC
5 (2)
Boba Analysis Suite Boba Analysis Suite는 MetaTrader 5용 분석 지표입니다. 시장 구조, 주요 가격 영역, 전반적인 시장 상황을 하나의 차트 화면에 통합하여 표시합니다. 트레이더이자 트레이딩 코치로서의 실무 경험을 바탕으로 개발되었으며, 시장 방향 평가, 주요 가격 수준 식별, 여러 시간대의 종합적인 분석 등 체계적인 분석 과정을 지원합니다. 시장 맥락을 고려한 분석 개별 신호의 의미는 시장 상황에 따라 달라집니다. Boba Analysis Suite는 현재 차트 상황을 더 넓은 시장 구조와 연결하고, 사전에 정한 규칙에 따라 매매 아이디어를 검토할 수 있도록 돕습니다. 주요 분석 기능은 다음과 같습니다. 추세 및 시장 구조: 시장 방향과 관련 구조적 맥락을 평가합니다. 주요 가격 영역 및 수준: 추가 분석이 필요한 중요한 영역을 차트에 시각적으로 표시합니다. 여러 시간대: 서로 다른 시간대의 정보를 통합하여 전반적인 시장 상황을 평가합니다.
ScalpPoint
Temirlan Kdyrkhan
ScalpPoint is a powerful trading companion designed to generate high-probability entry signals with dynamic TP/SL/DP levels based on volatility. Built-in performance tracking shows win/loss stats, PP1/PP2 hits, and success rates — all updated live. Key Features: Buy/Sell signals with adaptive volatility bands Real-time TP/SL/DP levels based on ATR Built-in MA Filter with optional ATR/StdDev volatility Performance stats panel (Success, Profit/Loss, PP1/PP2) Alerts via popup, sound, push, or emai
Crystal Heikin Ashi Signals
Muhammad Jawad Shabir
5 (5)
Crystal Heikin Ashi Signals—Professional Trend & Signal Detection Indicator Advanced Heikin Ashi Visualization with Intelligent Signal System for Manual & Automated Trading Final Price: $149 ---------> Price goes up $10 after every 10 sales . Limited slots available — act fast . Overview User Guide PDF Crystal Heikin Ashi Signals is a professional-grade MetaTrader 5 indicator that combines pure Heikin Ashi candle visualization with an advanced momentum-shift detection system. Designed for both m
Scalper Vault MT5
Oleg Rodin
5 (1)
Scalper Vault는 당일 매매(intraday trading)에서 일관된 성과를 내고자 하는 트레이더를 위해 설계된, 강력하고 모든 기능을 갖춘 트레이딩 시스템입니다. 이 고정밀 지표는 외환(Forex) 및 바이너리 옵션 트레이더 모두에게 기관급 분석을 제공하는 독립적인 종합 트레이딩 시스템 역할을 합니다. 구매 후 저에게 연락해 주시면, 트레이딩 팁과 함께 특별한 보너스를 제공해 드립니다! Scalper Vault는 추측에 의존하거나 복잡한 수동 분석을 할 필요를 없애주며, 사용하기 쉬운 트레이딩 기법을 통해 오직 매매 실행에만 집중할 수 있도록 돕습니다. 정확한 추세 추종 신호: 핵심 알고리즘이 시장 구조를 분석하여, 지배적인 시장 추세 방향과 일치하는 고확률 신호만을 제공함으로써 잘못된 진입을 획기적으로 줄여줍니다. 정밀한 고점 및 저점 탐지: 시장의 움직임이 소진되는 지점을 스캔하여 잠재적인 반전 구간을 식별합니다. 간(Gann) 이론 기반의 매수/매도 구간: 수학적
Azimuth Pro
Ottaviano De Cicco
5 (7)
Azimuth Pro V2: Synthetic Fractal Structure and Confirmed Entries for MT5 Overview Azimuth Pro is a multi-level swing structure indicator by Merkava Labs . Four nested swing layers, swing-anchored VWAP, ABC pattern detection, three-timeframe structural filtering, and closed-bar confirmed entries — one chart, one workflow from micro-swings to macro-cycles. This is not a blind signal product. It is a structure-first workflow for traders who care about location, context, and timing. Halloween P
Trend Catcher ind mt5
Ramil Minniakhmetov
5 (18)
트렌드 캐처 인디케이터 트렌드 캐처 인디케이터는 개발자가 자체 개발한 맞춤형 적응형 트렌드 분석 지표들을 조합하여 시장 가격 움직임을 분석합니다. 단기적인 노이즈를 제거하고 근본적인 모멘텀 강도, 변동성 확대, 가격 구조 움직임에 집중하여 진정한 시장 방향을 파악합니다. 또한 이동 평균, RSI, 변동성 필터와 같은 맞춤형 지표들을 활용하여 가격을 평활화하고 트렌드를 필터링합니다. 실제 운영 모니터링 및 기타 제품은 다음 링크에서 확인하실 수 있습니다:   https://www.mql5.com/en/users/mechanic/seller 텔레그램에서는 EA나 설정 파일을 판매하지 않습니다. 사기이니 주의하세요. 모든 설정 파일은 블로그에서 무료로 제공됩니다. 중요! 구매 후 즉시 연락 주시면 사용 방법 및 보너스를 드립니다!
Volatility Master for MetaTrader is a real-time dashboard tool that scans up to  50 symbols  to identify high-volatility , trending markets instantly. With bullish/bearish signals, customizable alerts, and a user-friendly interface, it helps you avoid range-bound conditions and focus on high-probability trades. Clarity leads to confidence. Trade confidently and protect your capital effectively with this powerful dashboard. We don't offer free or bonus indicators in exchange of reviews from you.
Apex Patterns PRO 인디케이터 구매 시 - 기반 Expert Advisor 무료 제공. 자체 최적화 차트 패턴 및 브레이크아웃 분석 시스템 기존의 패턴 스캐너는 고정된 파라미터에 의존하므로 시장 변동성과 구조가 변화할 때 성능이 저하되는 경우가 많습니다. Apex Patterns PRO는 구조적 차트 패턴 인식, 모멘텀 필터링, 통계적 자체 최적화를 하나의 분석 프레임워크로 결합하여 변화하는 시장 환경에 적응하도록 설계되었습니다. 적응형 스캐닝 엔진 자체 최적화 패턴 모드 최근 과거 데이터를 바탕으로 적절한 패턴 파라미터를 자동으로 탐색하여, 정적인 설정 대신 현재 시장 행보에 맞춰 인디케이터의 구조 감지 방식을 적응시킵니다. 스마트 브레이크아웃 필터링 클래식 패턴 인식과 모멘텀, 거래량, 프라이스 액션 지표를 결합합니다. 모든 브레이크아웃을 동일하게 다루는 대신, 시장의 기저 구조를 평가하여 현재 통계적 환경에 부합하는 셋업을 식별합니다. 주요 기능 리페인트 없는 고
Neuro Poseidon MT5
Daria Rezueva
4.68 (53)
Neuro Poseidon is a new indicator by Daria Rezueva. It combines precise trading signals with adaptive TP/SL levels - creating best possible trades as a result! Message me and get  Neuro Poseidon Assistant  as a gift to automize your trading process! What makes it stand out? 1. Proven profitability on all assets and timeframes 2. Only confirmed BUY and SELL signals present on the chart 3. Adaptive TP & SL levels generated by the software for each trade 4. Easy to understand - suitable for al
SIO Oscillator
Davit Beridze
SIO Oscillator: 자기 최적화 세미분산 불균형 오실레이터 지표를 구매하시면 이를 기반으로 한 전문가 어드바이저(EA)를 무료로 받으실 수 있습니다. 대부분의 오실레이터는 모든 가격 움직임을 똑같이 취급합니다. SIO는 상승 압력과 하락 압력을 분리하여 둘 사이의 불균형을 측정하고, 매수자와 매도자 중 어느 쪽이 실제로 시장을 주도하고 있는지 보여줍니다. 불균형이 극단에 도달하면 SIO는 진입가, 손절(Stop Loss), 익절(Take Profit) 수준이 포함된 명확한 신호를 표시합니다. SIO의 차별점은 고정된 설정에 의존하지 않는다는 것입니다. 내장된 자기 최적화 엔진이 현재 종목과 시간 프레임에 맞는 파라미터를 지속적으로 탐색하고, 사용하기 전에 검증합니다. 두 가지 신호 모드 평균 회귀(Mean Reversion): 불균형의 극단에서 거래하며 균형으로의 복귀를 노립니다. 추세 추종(Trend Following): 지속적이고 우세한 불균형의 방향으로 거래합니다. 자
Tokyo mt5 Indicator
Vasiliy Strukov
5 (14)
Tokyo Indicator는 추세 방향, 잠재적 거래 신호 및 시장 상황을 명확하고 시각적으로 보여줍니다. 색상으로 구분된 계단식 추세선은 강세 구간(파란색)과 약세 구간(자홍색)을 명확히 구별해 줍니다. 추세가 전환될 때 나타나는 방향성 화살표는 잠재적인 매수 및 매도 기회를 강조하여 보여줍니다. 통합 대시보드는 현재 신호, 시장 성향(bias), 모멘텀, 변동성, 신호 품질 등의 정보를 한눈에 파악할 수 있도록 구성되어 있습니다. 이를 통해 트레이더는 별도의 패널을 오갈 필요 없이 가격 움직임(price action)과 지표의 데이터를 동시에 분석할 수 있습니다. 깔끔한 차트 화면과 간결한 시장 개요를 제공하는 Tokyo Indicator는 체계적인 추세 분석과 거래 결정을 지원합니다. 모든 시간대와 다양한 자산(특히 금)에서 활용할 수 있습니다. 추세 방향, 잠재적 거래 신호 및 시장 상황을 명확하고 시각적으로 보여줍니다. 색상으로 구분된 계단식 추세선은 강세 구간(파란색)
통화 강도 마법사는 성공적인 거래를 위한 올인원 솔루션을 제공하는 매우 강력한 지표입니다. 표시기는 여러 시간 프레임의 모든 통화 데이터를 사용하여 이 또는 해당 외환 쌍의 힘을 계산합니다. 이 데이터는 특정 통화의 힘을 확인하는 데 사용할 수 있는 사용하기 쉬운 통화 지수 및 통화 전력선의 형태로 표시됩니다. 필요한 것은 거래하려는 차트에 표시기를 부착하는 것뿐입니다. 표시기는 거래하는 통화의 실제 강세를 보여줍니다. 지표는 또한 추세와 거래할 때 유리하게 사용할 수 있는 구매 및 판매 거래량 압력의 극한값을 보여줍니다. 지표는 또한 피보나치에 기반한 가능한 대상을 보여줍니다. 표시기는 PUSH 알림을 포함한 모든 유형의 알림을 제공합니다. 구매 후 연락주세요. 나는 당신과 거래 팁을 공유하고 당신에게 무료로 훌륭한 보너스 지표를 줄 것입니다! 나는 당신에게 행복하고 유익한 거래를 기원합니다!
AriFocus
Temirlan Kdyrkhan
AriFocus - Non-Repainting Buy/Sell Signals AriFocus - one clear signal. AriFocus marks buy and sell signals directly on the chart and suggests a stop-loss level for each one. Every signal is confirmed on bar close and never repaints. - Buy/sell arrows, confirmed on bar close - Suggested stop-loss level for every signal - Trend band and candle coloring to show direction at a glance - 10 ready-made presets, or your own settings (14 calculation methods) - Pop-up, push and email alerts with entr
Break and Retest Hunter
Mohamed Hassan
4 (4)
Break and Retest Hunter is a powerful MetaTrader 5 indicator designed to automatically identify support and resistance levels, breakout structures, and potential retest opportunities in real time. Bonus Indicator: After purchasing Break and Retest Hunter , contact me to receive Trade Indicator Assistant EA completely free as a bonus utility. $65 for the next 10 copies . Next price is $120.  Combining adaptive market analysis, clear BUY/SELL signals, Fibonacci-based profit targets, and a premiu
Advance AI Scanner
Mohamed Samsudeen
5 (1)
Advance AI Scanner is a multi-symbol analysis indicator for MetaTrader 5. It scans Forex pairs, metals, energy, stock indices and cryptocurrencies at the same time and rates each instrument with its own self-training model. It explains in plain English what moved each market and why, and it estimates how far upcoming economic news usually moves each symbol, measured on your broker's own price history. $199 instead of $499. 10 copies left at this price. One time purchase  Installation and User
필터:
리뷰 없음
리뷰 답변