TPO Dashboard
- インディケータ
- バージョン: 6.70
- アップデート済み: 4 11月 2026
- アクティベーション: 5

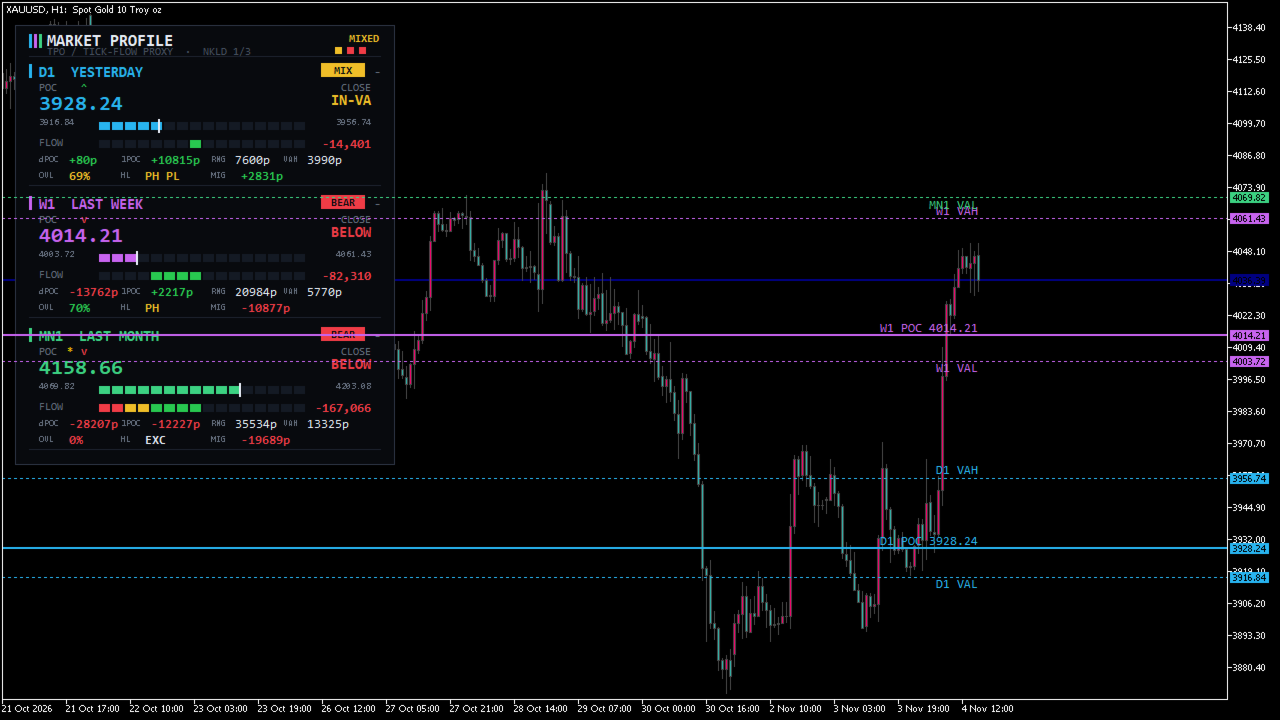
Market Profile TPO + CVD Dashboard is a MetaTrader 5 indicator that displays a compact on-chart dashboard with profile data for three reference periods: Yesterday (D1), Last Week (W1), and Last Month (MN1). It is fully plug-and-play — no input parameters.
Key Features
-
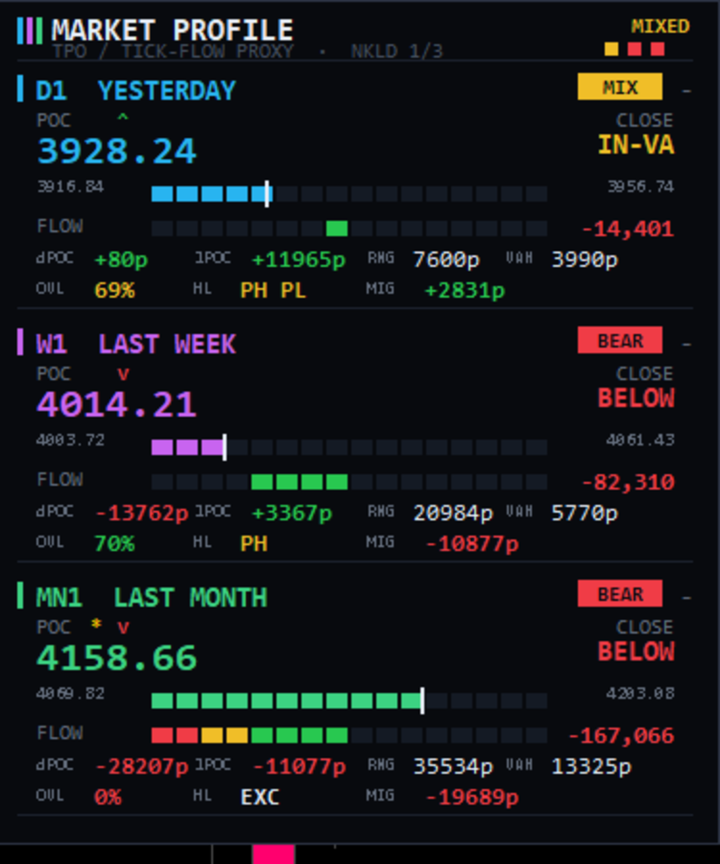
Three collapsible sections (D1 / W1 / MN1) in a single panel. Click a section header to expand or collapse it.
-
TPO-style profile built from M15 bars, with 40 price rows and a 70% Value Area. Displays POC, VAH, and VAL per period.
-
POC position bar (16 segments) with a needle marker showing where POC sits inside the Value Area.
-
Volume pressure bar (16 segments, bipolar): green to the right for positive pressure, red to the left for negative pressure, with brightness indicating strength. Scaled by delta percentage so periods of different length remain comparable.
-
Bias chip per section: BULL / BEAR / MIX, derived from close versus POC and the direction of volume pressure.
-
Metrics row per section: close position versus Value Area (ABOVE / BELOW / IN-VA), distance from close to POC in pips (dPOC), and period range in pips (RNG).
-
Automatic chart lines: POC (solid, thick), VAH and VAL (dotted) drawn per period, with price labels on the chart.
-
Performance-conscious: updates in place without flicker, caches per bar, does not re-render on chart scroll or zoom, and auto-restores the panel if objects are removed.
Data Source and Methodology
-
All TPO and volume pressure values are computed from M15 bars inside each reference period (Yesterday, Last Week, Last Month).
-
POC is the price row with the highest TPO count. Ties are resolved toward the middle of the period range.
-
Value Area is built by expanding outward from POC until 70% of total TPO is covered.
-
Volume pressure (CVD) is an approximation, not tick-by-tick order flow. It is calculated as the close position within each M15 bar's range, multiplied by that bar's tick volume, then summed across the period. It reflects directional pressure estimated from intrabar close position and tick volume — it is not exchange-level delta.
Input Parameters
None. Fully plug-and-play. Built-in defaults: 40 profile rows, 70% Value Area, M15 source resolution. No configuration required.
Usage Recommendation
Attach to any chart on any timeframe. The dashboard always references D1, W1, and MN1 internally, so it works regardless of your chart timeframe. Use the bias chip and POC/VA lines as confluence for your existing analysis. The volume pressure bar is a directional gauge, not a standalone trading signal.
Notes
-
MetaTrader 5 only.
-
Volume pressure values are approximations based on tick volume and intrabar close position; they should not be interpreted as exchange-level order flow.
-
TPO profile is derived from M15 bars, not from raw tick data.
-
The panel uses fixed on-chart coordinates and is not affected by zoom or scroll.