Advanced Patterns Master Pro
- 지표
- 버전: 4.48
- 활성화: 20

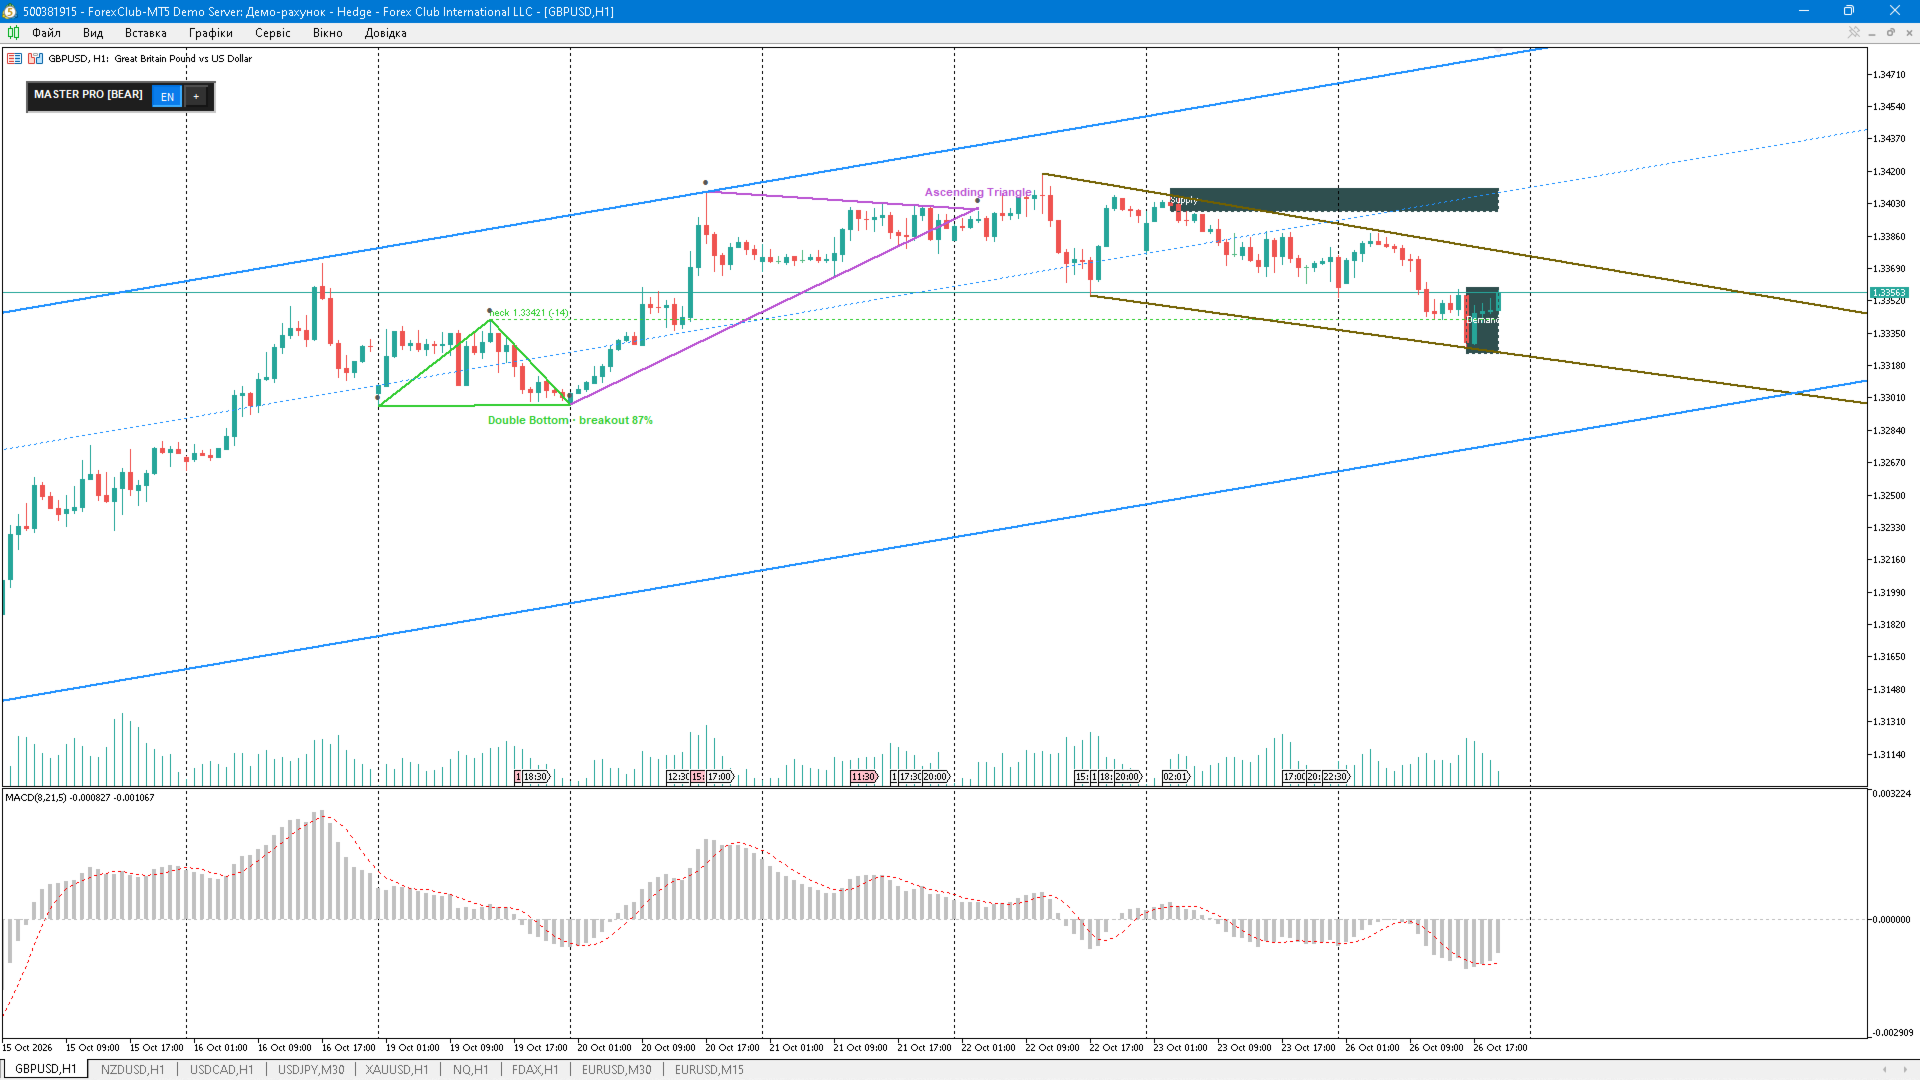
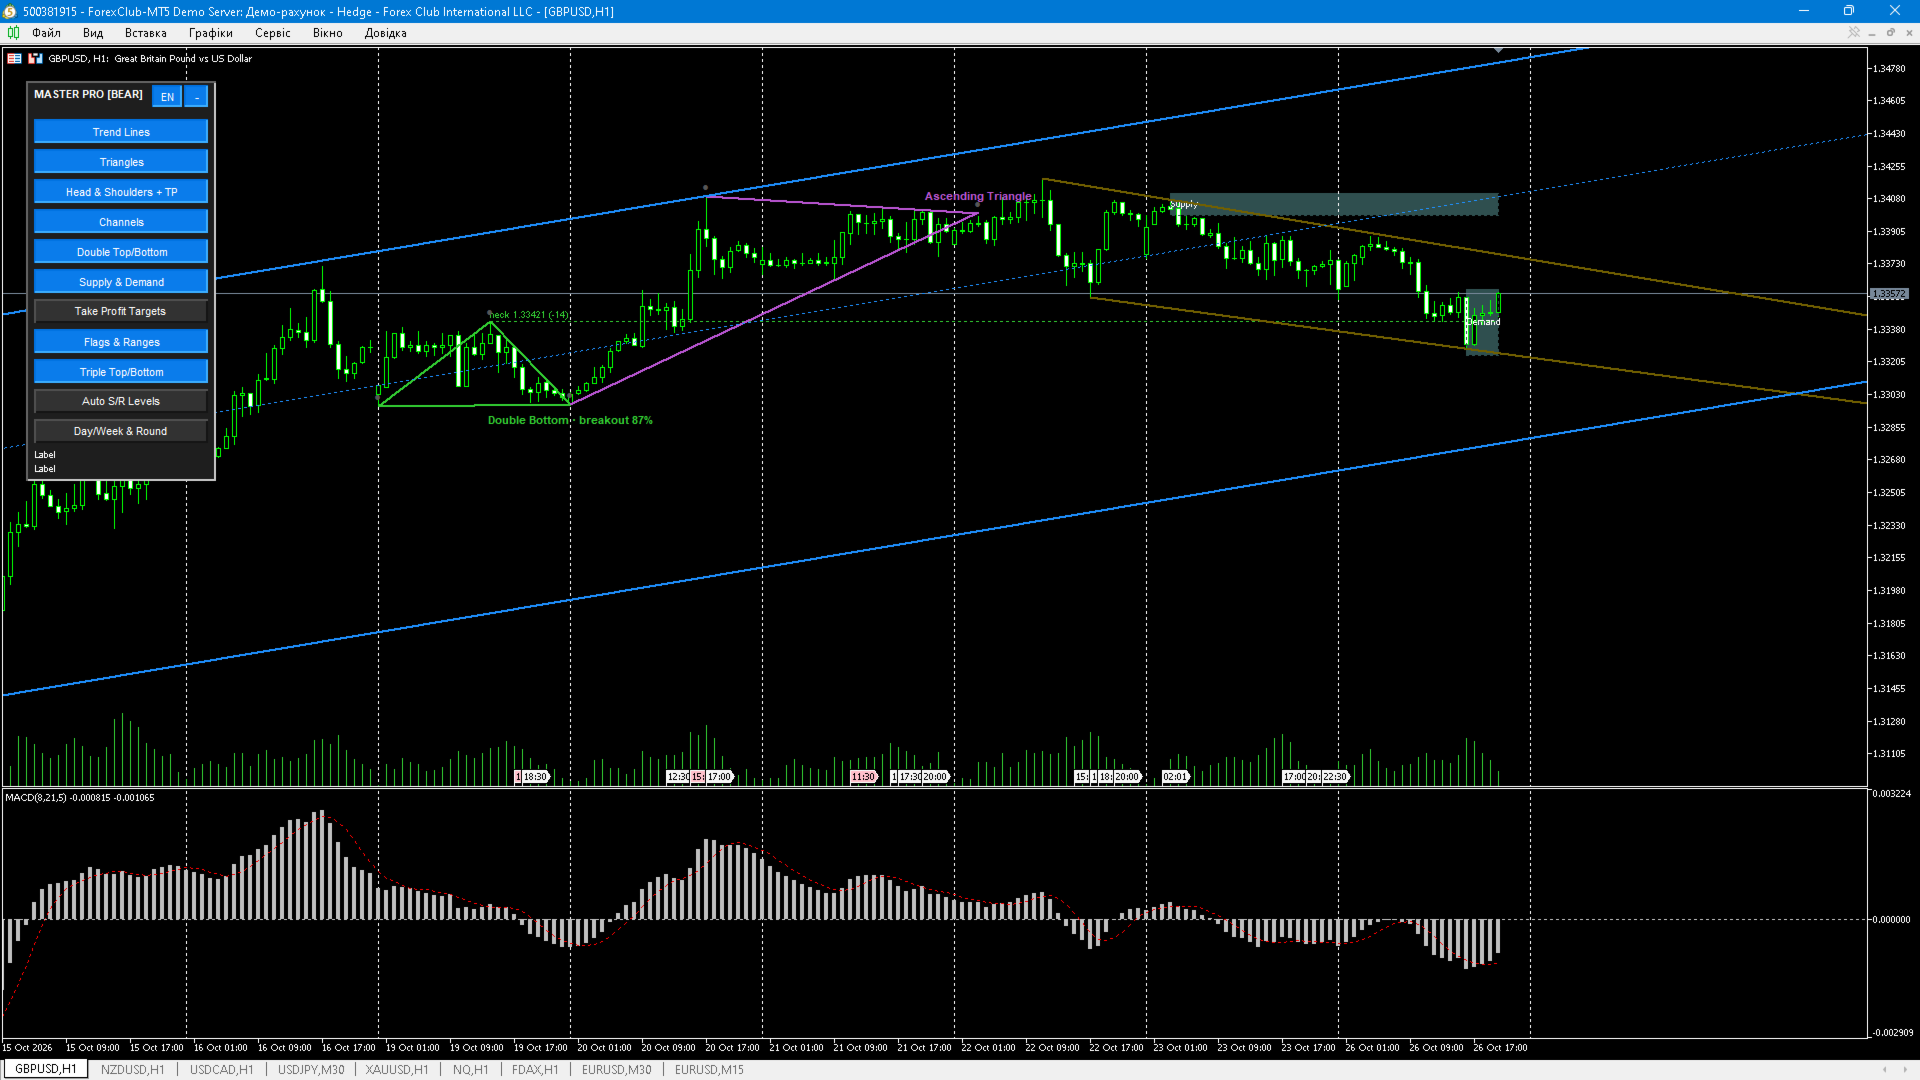
Advanced Patterns Master Pro is a chart-pattern scanner for MetaTrader 5. It analyses the recent bars, detects confirmed swing pivots and draws the classical formations directly on the chart, together with the levels that matter for a trade: necklines, Take Profit targets, supply/demand zones, automatic support/resistance and market context levels.
What it draws
- Head & Shoulders (regular and inverse) with neckline extension and targets
- Double and triple tops / bottoms
- Triangles (symmetrical, ascending, descending) and wedges
- Trend lines, flags and consolidation ranges after an impulse
- Regression price channel of close with +/-N sigma borders
- Supply and demand zones
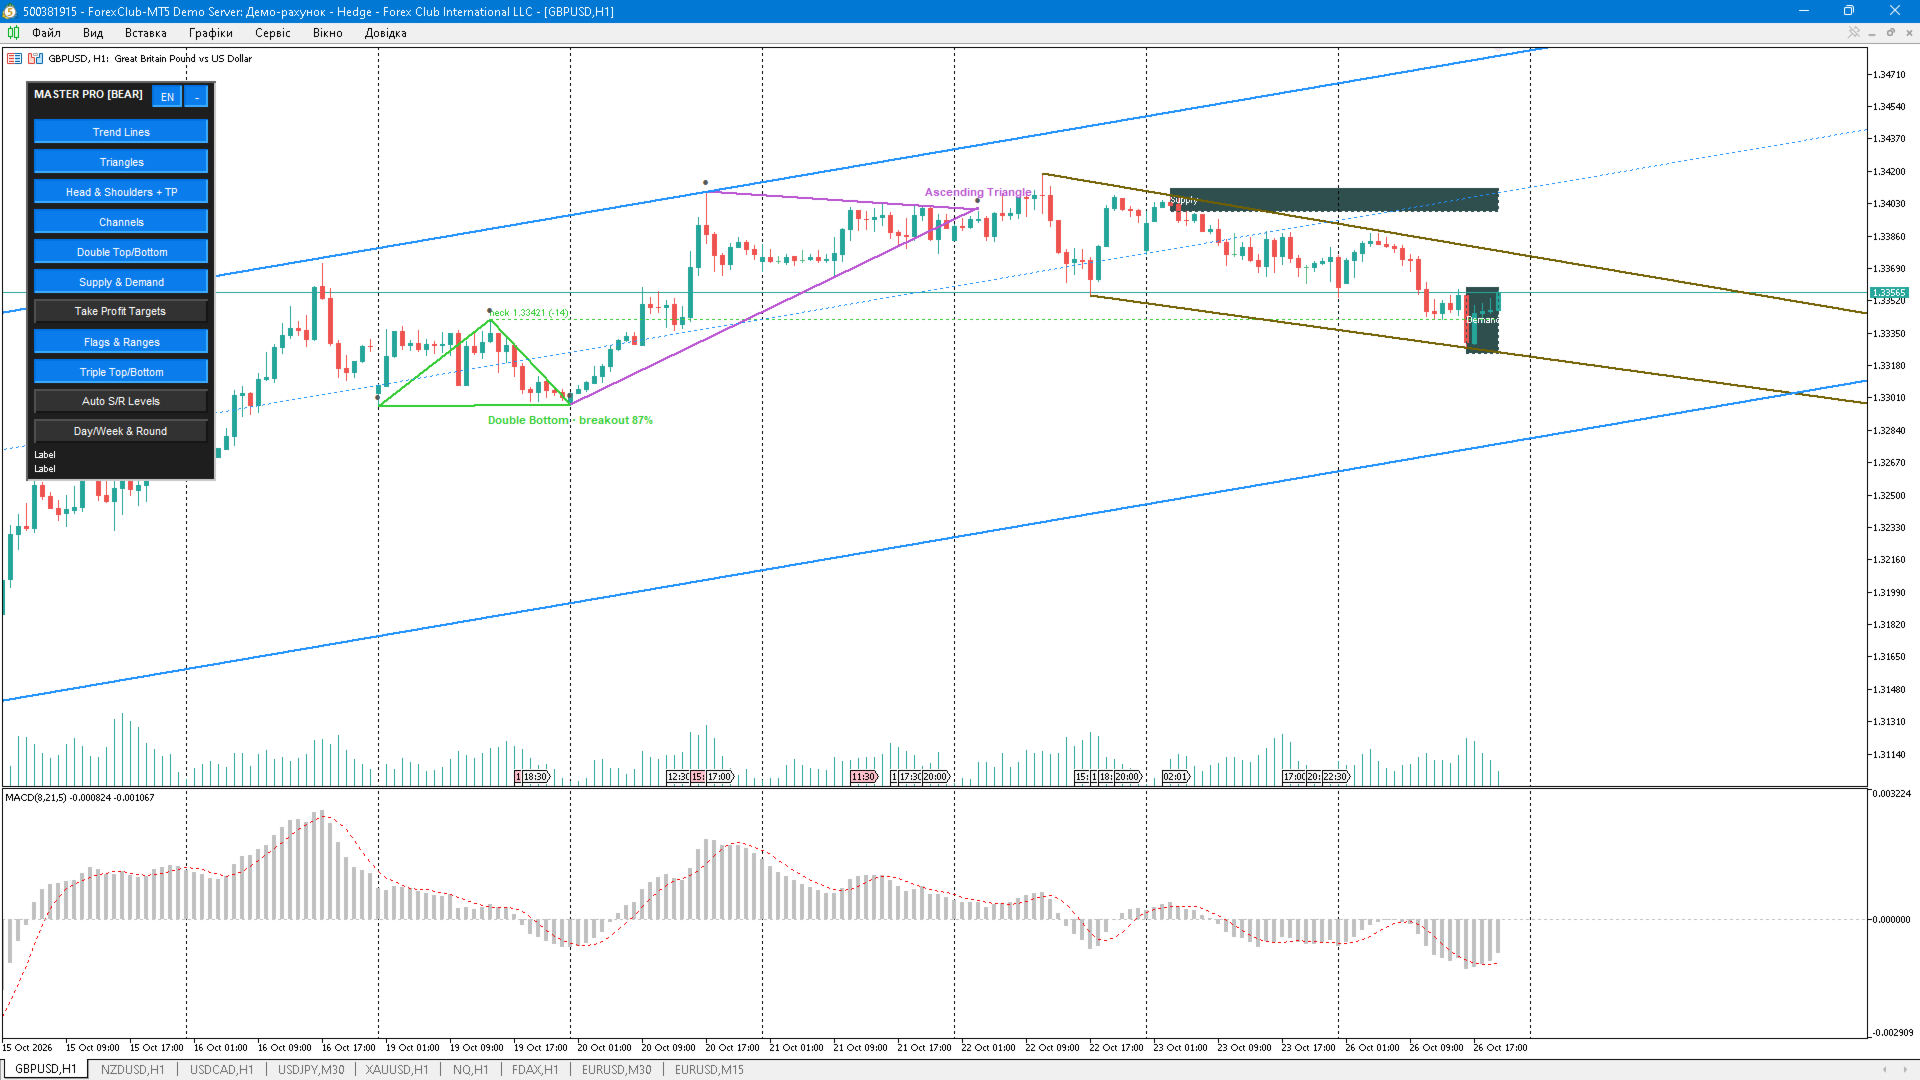
- Take Profit targets: TP1 = 0.618 and TP3 = 1.618 of the pattern height measured from the neckline
- Automatic S/R levels from touch clusters, daily and weekly Hi-Lo, round levels
Key features
- 0 buffers and 0 plots: everything is drawn with chart objects, so the indicator works on any symbol and timeframe and does not occupy the Data Window
- Figure state in the caption (forming, confirmed, breakout, cancelled) plus a quality score from 0 to 100
- Distance to every level in pips right on the label
- Layer buttons on a draggable panel; the panel position and the layer set are stored per symbol and survive a restart
- Hover tooltips on pattern lines, zones and panel buttons
- Alerts on a new figure and on a confirmed breakout of a watched level (neckline or target), with a cooldown in bars and suppression of repeats of the same figure
- MTF trend filter in the panel title (MA of a higher timeframe; timeframe, period and method are inputs)
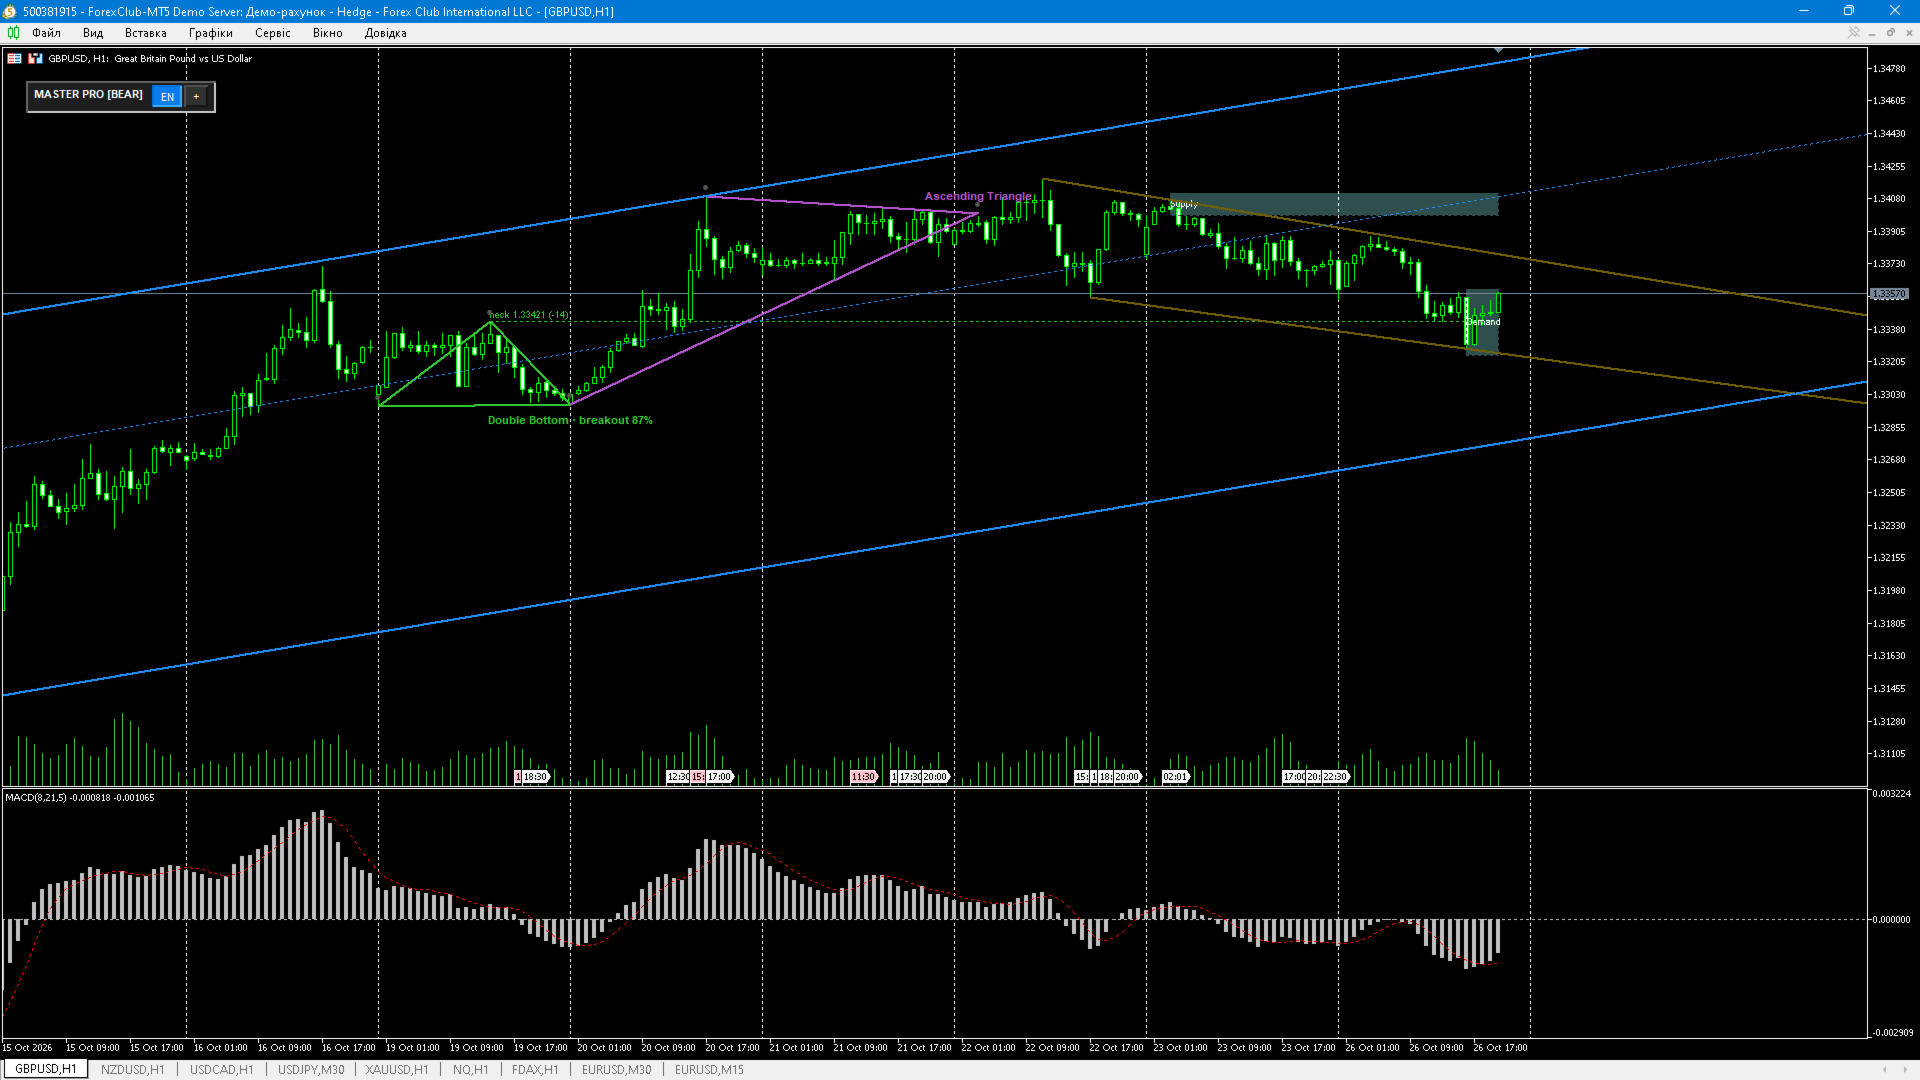
- Auto contrast: colours adapt to a light or dark chart background
- Works both as an indicator and as an EA wrapper, so the panel buttons also work in the Strategy Tester
Inputs Interface: panel background, text and button colours, anchor corner, X/Y offsets. Pattern detection: pivot depth, bars to scan, tolerance %, minimum pattern width, forming patterns, breakout requirement, maximum pattern age and width, minimum height in ATR. Appearance: colour per layer, line widths, caption and level font sizes, pivot markers, zone outline, auto theme, distance in pips. Quality and targets: state and quality display, TP1 / TP3 coefficients, target zone, TP multiplier. Extra patterns and context: flags, triples, auto S/R, daily/weekly and round levels, channel sigma, channel minimum bars, triangle side extension. Layer visibility at start: which layers are shown on the first run. Analysis and alerts: terminal alert, push notification, sound file, cooldown in bars, same-figure tolerance in ATR, alert on figure, "require price levels" filter, MTF timeframe / period / method.
How to use Attach the indicator to the chart of the instrument and timeframe you trade (H1-H4 and above suit the classical formations best), enable the layers you need with the panel buttons and tune the pivot depth to the timeframe. Everything is recalculated on a new bar; the objects are rebuilt on a new bar, when history is updated and after a panel click.
Good to know
- The product does not trade, does not open or modify orders and does not access the account
- The current unfinished bar can change until it closes, which is normal for a forming pattern
- A chart with enough loaded bars is required, otherwise the scan window is limited by the available history
- Visual mode in the Strategy Tester is much slower than the "Open prices" model, because the objects are redrawn on every bar
Disclaimer This product is an analysis tool. Past performance and backtest results do not guarantee future results. Use it as an addition to your own trading plan and risk management.