N22 smc ICT zones
- 지표
-
Anold Stephen Minja
 Full-Cycle MQL5 Developer | Algorithmic Trading Systems & Automation
Specializing in robust MetaTrader 5 Expert Advisors, custom technical indicators, and automated risk engines.
Core Capabilities: - 버전: 1.0
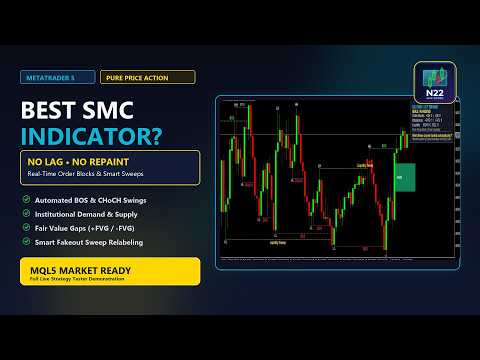
N22 SMC ICT Zones draws Smart Money Concepts (SMC / ICT) price action on your chart automatically, so you can analyse the market manually without drawing every zone by hand. It uses pure price action with no lagging tools.
WHAT IT SHOWS
- Market structure: swing labels (HH, HL, LH, LL), Break of Structure (BOS) and Change of Character (CHoCH).
- Order Blocks (OB): bullish and bearish zones, with optional display of mitigated zones.
- Fair Value Gaps (FVG): bullish and bearish imbalances with a minimum size setting.
- Supply and Demand zones: base candles followed by explosive displacement.
- Liquidity pools: Equal Highs (EQH) and Equal Lows (EQL). Two levels are marked as equal only when they differ by 5 points or less (adjustable).
- Liquidity Sweeps: a CHoCH is first drawn as CHoCH. After a watch window of at least 5 candles, if price closed back through the broken level and is still on the reversed side, the label changes to Liquidity Sweep. If price continued, it stays CHoCH.
- On-chart dashboard: current structure bias and the number of active order blocks, fair value gaps and liquidity pools. It can be placed in the top-left or top-right corner.
- Optional alerts for new BOS and CHoCH events.
HOW TO USE
1. Attach the indicator to any symbol and timeframe.
2. Look at the structure and zones the indicator draws.
3. Combine them with your own analysis and risk management before making any decision.
Hover over a zone to see its price range and whether it is active or mitigated.
IMPORTANT NOTES
- Analysis uses closed candles only, so the forming candle does not change existing zones.
- Swing labels are confirmed after a number of candles to the right of the swing (the Swing Pivot Strength setting). This is normal for swing detection.
- Zones near the start of the analysed history can change as the lookback window moves forward.
- Main inputs: analysis lookback candles, swing pivot strength, minimum fair value gap size, equal highs and lows maximum gap (in points), CHoCH watch window, colours, alerts, and dashboard position.
DISCLAIMER
This indicator is an educational visualisation tool for manual analysis. It does not give trade signals and does not guarantee any result. Trading carries a high risk of loss, and past market structure does not predict future price movement.
Questions, suggestions and bug reports are welcome in the comments section of this page.