My Big Bars
- 지표
- 버전: 2.7
- 업데이트됨: 7 2월 2023

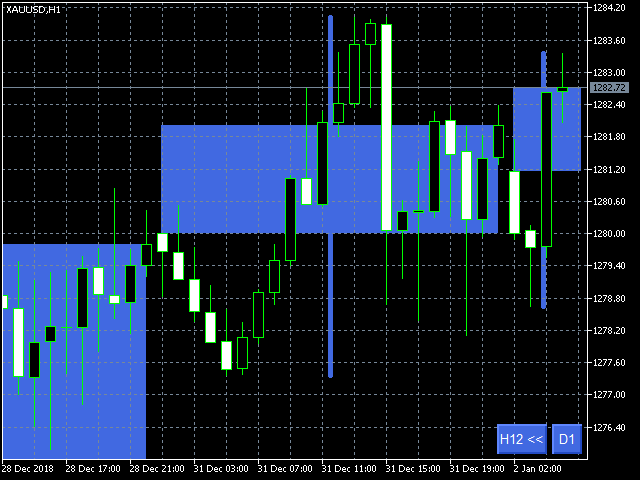
The indicator My Big Bars can show bars (candles) of a higher timeframe. If you open an H1 (1 hour) chart, the indicator puts underneath a chart of H4, D1 and so on.
The following higher timeframes can be applied: M3, M5, M10, M15, M30, H1, H3, H4, H6, H8, H12, D1, W1 and MN.
The indicator chooses only those higher timeframes which are higher than the current timeframe and are multiple of it. If you open an M30 chart (30 minutes), the higher timeframes exclude M5, M15 and M30.
There are 2 handy buttons in the lower right corner. The right button always shows the current higher timeframe. Click it to switch to the next higher timeframe. The left button appears if there is a higher timeframe which is less than the current. This way you can easily switch among the higher timeframes.
A higher timeframe may be delayed when you click the button and there is no available history for the moment.
Due to the limitations of MetaTrader 4, the upper and lower "legs" of a bar are pushed to the left if the higher timeframe bar contains an even number of bars of the current timeframe.
2 properties of the indicator allow to set the colors for the growing bar and the falling bar.


The indicator is excellent, it would also be good if the text color of the buttons were customized. But anyway it helps a lot in my analysis.