Triple Timeframe Alignment
- 지표
- 버전: 1.0
- 활성화: 5

# Triple Timeframe Alignment - Three horizons, one score
*Category: Multi Timeframe Hybrids | Difficulty: intermediate | Window: separate window below the chart | Markets: Universal (Forex, indices, commodities, crypto, stocks) | Suggested timeframes: M5, M15, M30, H1, H4*
## Short description
> Checks whether current, middle and higher timeframes point the same way, showing both the overall score and each horizon direction.
## Full description
### Overview
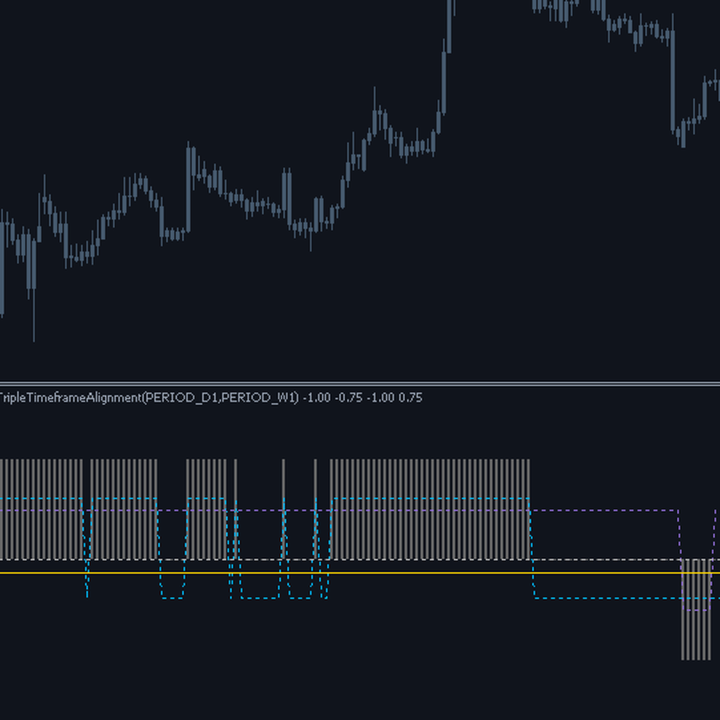
Full alignment of the three time horizons is the condition where directional strategies work best, and it is also the rarest: most of the time at least one of the three disagrees. The added value of this indicator is not knowing that the three agree, which could be guessed by looking at three charts, but seeing exactly which one disagrees when they do not. The distinction is operationally decisive: disagreement from the higher timeframe is a serious warning, because it means trading against the underlying structure; disagreement from the current timeframe is often just a pullback within an intact move, and may in fact be the very entry window one was waiting for. The three separate lines make that reading immediate.
### How the calculation works
1. On each timeframe an average close is computed and it is checked whether price sits above or below.
2. On the current timeframe the running bar is used, which is legitimate because it is the bar being computed.
3. On the two higher timeframes the last already closed bar is used, avoiding any form of repaint.
4. Each timeframe contributes plus one, minus one or zero if data are insufficient.
5. The overall score is the sum of the three contributions and equals three only when all agree.
6. The three lines are visually separated with a configurable offset, otherwise they would overlap.
### How to use it
- Treat only full score contexts, positive or negative, as tradable: that is where directional strategies pay.
- Look at which line disagrees: the gold higher timeframe one is the most important to respect.
- Disagreement from the blue current line alone is often a pullback rather than a problem.
- A shift from full positive to full negative score is a regime change to be handled by closing positions.
- Leaving both timeframes on automatic produces a sensible progression with no configuration at all.
### Who it is for and on which timeframes
It targets traders applying multi timeframe analysis who want to automate the comparison instead of opening three charts. It works from M5 to H4. Reading it takes some habituation because it shows four pieces of information together, but that density is precisely its value: it replaces three charts with one subwindow. Like every multi timeframe indicator in the pack, it uses exclusively closed bars of the higher timeframes.
### Practical example of reading a signal
On GBPUSD M30 the score has been at plus three for two days: current, H4 and D1 are all bullish and the trader goes only long, with good results. Then the blue current timeframe line drops to minus one while the other two stay positive: the score falls to plus one. Seeing which line moved, the trader understands this is a pullback on the small chart within an intact structure, and indeed it is the ideal window to add to the position. Two weeks later the opposite occurs: the gold D1 line drops to minus one while the other two stay positive. This time the disagreement comes from above and is a serious warning: the trader reduces exposure.
## Input parameters
| Parameter | Default | Description |
|---|---|---|
| `InpMiddleTf` | PERIOD_CURRENT | Middle timeframe. With the default value the first natural multiple of the current one is chosen automatically. |
| `InpHigherTf` | PERIOD_CURRENT | Higher timeframe. With the default value the first natural multiple of the middle one is chosen. |
| `InpMaPeriod` | 20 | Period of the average used on all three timeframes, so the directional criterion stays homogeneous. |
| `InpSpacing` | 0.25 | Visual separation between the three lines. It only prevents them from overlapping perfectly. |
## Advantages / strengths
- It replaces three charts with a single subwindow, drastically cutting analysis time.
- It shows which horizon disagrees, information the overall score alone would hide.
- The two higher timeframes are chosen automatically in a natural progression.
- No repaint: on the higher timeframes it uses exclusively already closed bars.
## Limitations and warnings
- The score can take only seven values and therefore moves in fairly abrupt steps.
- Full alignment is rare: the indicator stays in the neutral zone most of the time.
- Four pieces of information in the same subwindow require habituation before they can be read quickly.
- The lag on higher timeframes means alignment is recognised after it has formed.
**No repaint:** values printed on a closed bar are never modified afterwards.
**Disclaimer.** This product is a technical analysis tool, not an automated trading system, and it offers no profit guarantee whatsoever. Financial markets carry the risk of total loss of the invested capital. Past performance is not indicative of future results. Every signal must be confirmed with your own analysis, a money management plan and prior testing on a demo account. The author is not responsible for trading decisions taken on the basis of this indicator.
## Suggested tags / keywords for MQL5
`multi timeframe`, `alignment`, `trend filter`, `no repaint`, `confluence`, `consensus`, `intraday`, `hierarchy`