BrioQuant Heiken Ashi
- 지표
-
Mitchell Dean Ede
 트레이더, 도구 개발자 & 마켓 닌자
저는 2010년부터 시장에서 활동해 온 트레이더이자 트레이딩 도구 개발자입니다. 불필요하게 복잡하지 않으면서 유용한 시장 정보를 제공하는 깔끔한 MetaTrader 5용 지표와 EA를 개발합니다.
각 도구는 한 가지 기능을 제대로 수행하도록 설계되며, 모든 설정은 이해하기 쉬운 언어로 설명됩니다. 매매 결정은 항상 트레이더 본인의 몫으로 남겨 둡니다. 모든 지표와 EA는 공개 전에 독립적인 재계산을 통해 검증합니다. 제품과 지원은 제가 직접 제공합니다. - 버전: 1.11
- 업데이트됨: 30 8월 2026
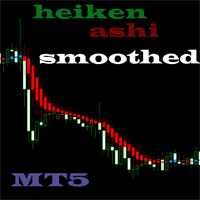
Heiken Ashi candles drawn in the main chart window, with the option to hide the chart's own candles so only the Heiken Ashi bodies remain.
Heiken Ashi averages each bar with the one before it. Direction changes less often than on standard candles, which makes a trend easier to hold and a stall easier to see. It is a different way of drawing the same price, not a signal.
What it does
- Plots Heiken Ashi open, high, low and close as coloured candles
- Separate colours for rising and falling candles
- Optionally hides the chart's own candles while attached, and puts them back when removed
- Publishes its values to the Data Window, readable from other programs
How it is calculated
- Close: the average of the bar's open, high, low and close
- Open: the midpoint of the previous Heiken Ashi open and close
- High and low: the extremes of the bar and of the Heiken Ashi body
Related
Inputs
- Bull candle - colour for a rising candle
- Bear candle - colour for a falling candle
- Hide the chart's own candles while attached - on or off
Notes
Closed bars do not repaint. The forming bar updates with price, as it should.
With the hiding option on, the original chart colours are stored and put back when the indicator is removed, including after a terminal restart. If a second copy is attached it leaves the colours to the first one.
Heiken Ashi is a way of drawing price, not a trading system. It lags ordinary candles by design, and the open and close it shows are averages rather than traded prices.
Tell me what would make this more useful. Post the change you want in the comments - I read every one and build what I can.