Smart mcd
- 지표
- 버전: 1.0

Smart MCD (Hot Money) is a MetaTrader 5 indicator that visualizes three market-participant groups as color-coded histograms in a separate window, all normalized to a 0-20 scale. It uses a sensitivity-weighted, offset-adjusted RSI engine to suggest when large capital is entering or leaving the market.
Features
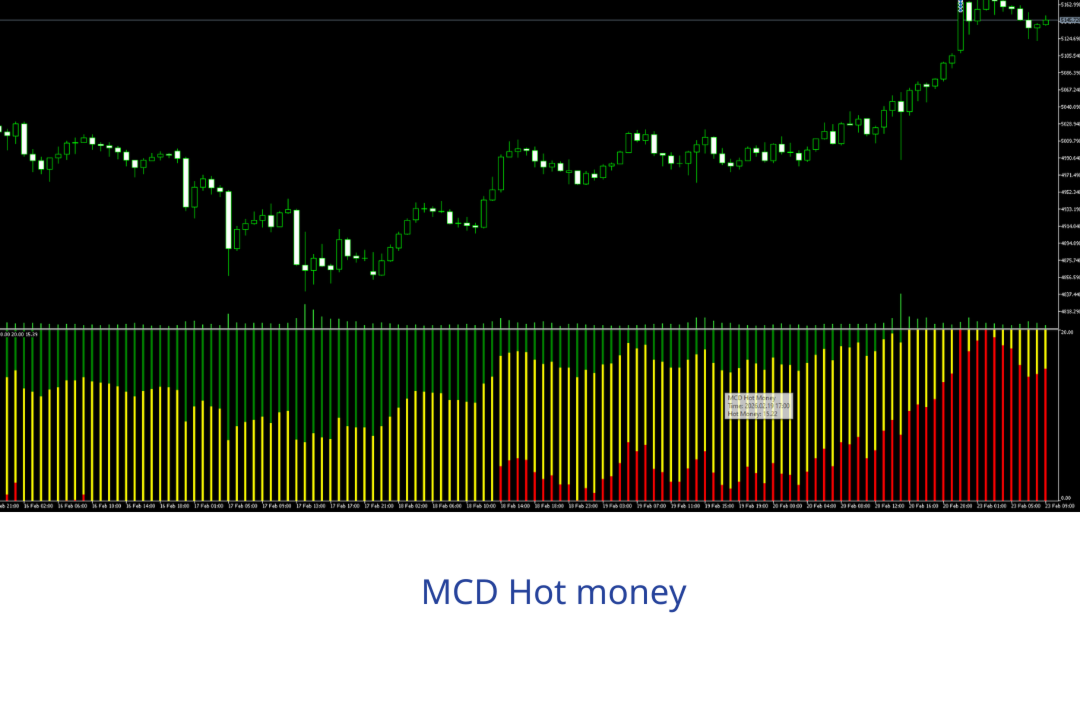
- Three participant views: Retailer (a fixed ceiling reference at 20), Hot Money (short-term institutional flow) and Banker (longer-term smart-money flow).
- Normalized scale: all groups read on the same 0-20 range, so you compare them directly.
- RSI-based engine: each group is derived from an RSI calculation with its own offset and sensitivity, tuned to separate fast and slow capital.
- Clean sub-window display that works on any symbol and timeframe.
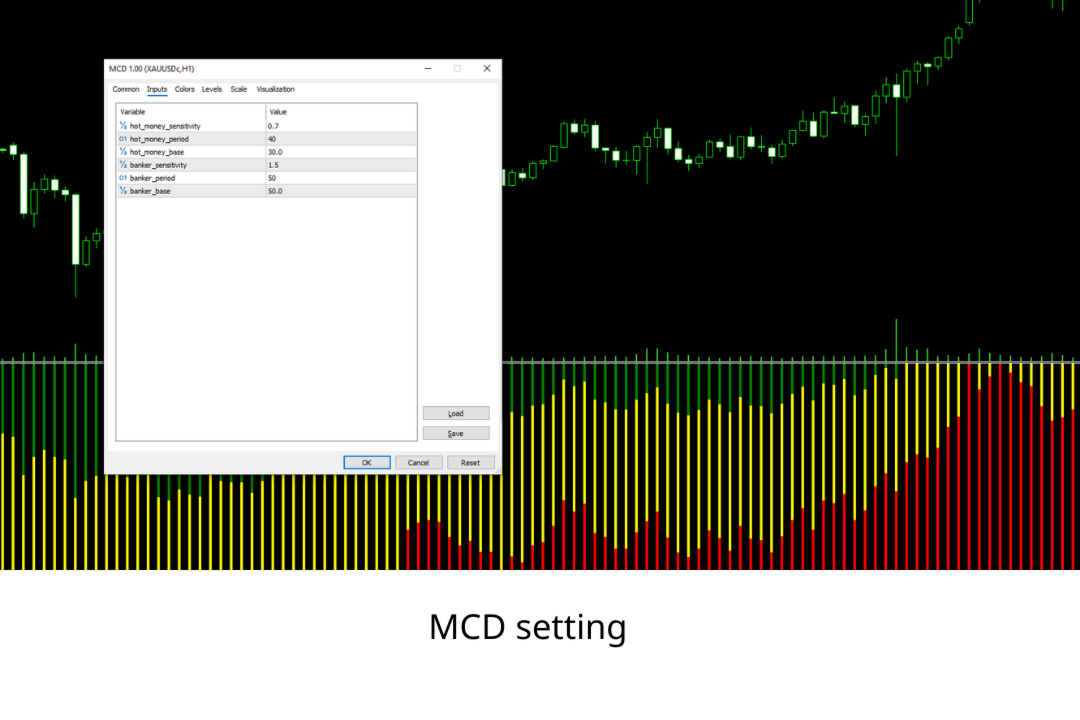
Inputs
- Hot Money RSI Period, Offset and Sensitivity (for example RSI 40, offset 30, sensitivity 0.7).
- Banker RSI Period, Offset and Sensitivity (slower, smart-money flow).
- Retailer reference level (fixed at 20).
- Color options per group.
Outputs
- Three histograms in a sub-window: Retailer, Hot Money and Banker, each on the 0-20 scale.
Alerts
Optional alerts can be sent as a screen popup, sound, push notification and email when Banker or Hot Money flow crosses a level you set.
Limitations
Read the relationship between the groups rather than any single bar; this is a flow-context tool, not a buy/sell signal. The model is RSI-derived, so it interprets momentum rather than measuring real order flow. Combine with price structure.
Full guide with buffer settings: see the Comments section.
Group support: https://www.mql5.com/en/channels/vuongphamtrading