Price Structure RSI

PRICE STRUCTURE RSI

Price Structure RSI is a market-structure oscillator for MetaTrader 5. Instead of calculating RSI directly from ordinary price changes, it measures the balance between confirmed bullish and bearish price-structure breaks.

The indicator tracks pivot highs and pivot lows. A break above an active pivot high increases the cumulative structure value, while a break below an active pivot low decreases it. Wilder RSI smoothing is then applied to this structure data, producing an oscillator between 0 and 100.

This provides a different view of momentum by showing how aggressively the market is breaking established structure.

SIGNAL LOGIC

  • A bullish signal appears when Structure RSI crosses back above the oversold level.

  • A bearish signal appears when Structure RSI crosses back below the overbought level.

  • Signals are based on confirmed closed-candle structure information.

  • The default overbought and oversold levels are 80 and 20.

STRUCTURE-BREAK MODES

Two methods are available for confirming a structure break:

  • High/Low Mode counts a break when the candle high or low passes the relevant structure level.

  • Close Mode requires the candle close to pass the structure level.

High/Low Mode reacts faster, while Close Mode provides stricter confirmation.

DYNAMIC OSCILLATOR COLOURS

The Structure RSI line automatically changes colour according to its current position:

  • Grey indicates a neutral reading.

  • Red indicates an overbought reading.

  • Aqua indicates an oversold reading.

Horizontal reference levels are displayed at the overbought level, oversold level and the neutral 50 level.

MOVING AVERAGE

An optional moving average can be applied directly to the Structure RSI.

Available moving-average types:

  • Exponential Moving Average

  • Simple Moving Average

  • Weighted Moving Average

The moving average can be enabled or disabled, and its length can be adjusted independently.

HISTORICAL OUTCOME STATISTICS

Separate bullish and bearish performance tables display:

  • Winning outcomes

  • Losing outcomes

  • Historical win rate

The user can configure the percentage target and stop distance used for these calculations.

For more realistic results:

  • Entry is measured from the signal candle’s closing price.

  • The target and stop are evaluated only on subsequent closed candles.

  • The currently open candle is excluded from completed results.

  • If the target and stop are both reached during the same candle, the result is counted conservatively as a loss because OHLC data cannot determine which level was reached first.

  • Only one historical position is tracked at a time. Additional signals are ignored until the active position reaches its target or stop.

The tables can be placed in any of nine positions inside the indicator window. Additional row and column offsets are available for layout adjustment.

LIGHT AND DARK CHART SUPPORT

The indicator includes separate appearance presets for light and dark chart backgrounds. Moving-average and table-text colours automatically adjust for readability.

MAIN INPUTS

  • RSI length

  • Overbought level

  • Oversold level

  • Structure-break confirmation method

  • Show or hide moving average

  • EMA, SMA or WMA selection

  • Moving-average length

  • Light or dark colour preset

  • Show or hide performance tables

  • Take-profit percentage

  • Stop-loss percentage

  • Bullish table position

  • Bearish table position

  • Table row and column offsets

IMPORTANT INFORMATION

Price Structure RSI is an analytical indicator and does not open, manage or close trades.

Historical outcome statistics do not include spread, commission, slippage, execution delay or lower-timeframe price movement. They are intended for research and comparison and do not guarantee future performance.

The indicator can be used on any symbol or timeframe supported by MetaTrader 5.


추천 제품
The chaos wave
Letlhogo Mokgatle
This is the best indicator we have created by far, this indicator replicates the well known heiken ashi indicator,  but with a more precise entry point, this indicator can work on all time-frames and is strong on all the time frames , this indicator does not repaint nor does it lag , this indicator strategy combined with price action will change your trading experience , elevate your experience to the next level.
Holiday Sales Zones Indicator The Zones Indicator is your everyday Trading tool that  leverages advanced algorithms, including ICT institutional concepts like order blocks , engulfing candle patterns , and Level interactions , to identify critical levels of supply and demand (Resistance & Support). Visual signals are generated and clearly marked on the chart, providing a straightforward guide for traders to spot key opportunities. Key Features Advanced Algorithmic Analysis : Identifies supply
Titan Pro Scalper is an indicator that tells you where to enter and exit (100% NO DELAY; 100% NO-REPAINT). You'll not only know where to enter and exit but also where to re-enter the market (As long as the arrows that appear are still in the same direction, you can add positions if you want) No settings are required; simply attach it to a chart on any timeframe and let the indicator calculate all the necessary parameters. You only need to fill in how much money you risk for each transaction, th
MTF Isolator EMA
Jake Jesus Herrera Turizo
Características Principales 1. Medía Móvil Multi-Timeframe (MTF) con Estabilidad Temporal EMA Macro ( InpMATimeframe ): Permite proyectar y visualizar en el gráfico actual una Media Móvil Exponencial (EMA) calculada desde una temporalidad superior (por defecto en gráfico diario PERIOD_D1 ). Independencia de Temporalidad: Mantiene los cálculos exactos y fijos del periodo que se requiera (la temporalidad macro seleccionada) sin que estos se modifiquen, distorsionen o recalibren indebidamente al
FREE
MACD FuturePredict Panel Pro MT5 MACD indicator for MT5 with non-repainting BUY/SELL arrows confirmed on candle close, a forward momentum projection, higher-timeframe filter and a 7-point signal score. Go Beyond the MACD Crossover A MACD crossover tells you momentum has changed. It does not tell you whether the trend agrees, whether the higher timeframe agrees, or whether the move has room to run. MACD FuturePredict Panel Pro answers those questions on one chart, so you can tell a strong setup
Thahab Indicator
Ahmed Jumaa Saif Ali Almheiri
Thahab Indicator is built around a powerful heatmap engine that makes it easy to spot key support and resistance areas directly on the chart. By highlighting price zones with strong accumulation and activity, traders can quickly identify where the market is accepting, rejecting, or building pressure. What makes Thahab Indicator special is that it combines: Heatmap-based accumulation zones VWAP POC Value Area Interactive dashboard controls all inside one tool. It is designed to give traders a cle
KAMA Confluence Engine
Ivan Stefanov
5 (2)
KAMA Confluence Engine 트렌드에 따라 거래하고, 시장이 반전되는 순간에 즉시 진입, 스톱, 목표가를 확인하세요. KAMA Confluence Engine은 Kaufman Adaptive Moving Average(KAMA)를 기반으로 한 올인원 트렌드 지표로, 틱 거래량 가중치, 멀티 타임프레임 확인, 자동 거래 레벨 기능이 강화되어 있습니다. 시장 상황에 따라 자동으로 적응하며, 트렌드 구간에서는 빠르고 민감하게, 횡보 구간에서는 안정적이고 노이즈를 필터링하여 항상 올바른 방향에서 거래할 수 있도록 돕습니다. 특징 거래량 가중 적응형 엔진 실제 틱 거래량이 증가하면 KAMA 라인이 빨라지고, 거래량이 줄어들면 느려집니다. 강한 움직임에는 머물고, 가짜 신호는 피할 수 있습니다. 눈에 띄는 네온 리본 밝고 부드러운 라인으로, 아래에는 짙은 그림자가 있습니다. 녹색 = 상승 추세, 빨간색 = 하락 추세, 회색 = 횡보/비거래. 멀리서도 한눈에 추세를 파악할 수 있습니
Adjustable Consecutive Fractals  looks for 2 or more fractals in one direction and sends out a on screen alert, sound alert and push notification, for strong reversal points . Adjustable Consecutive Fractals, shows the fractals on chart along with a color changing text for buy and sell signals when one or more fractals appear on one side of price. Adjustable Consecutive Fractals is based Bill Williams Fractals . The standard Bill Williams fractals are set at a non adjustable 5 bars, BUT withe th
초보자도 쉽게 시장의 진짜 힘을 식별하세요. 모멘텀 섀도우 인디케이터(MSI)는 초보자와 전문가 모두에게 완벽합니다. 시장이 실제로 힘이 있는지를 보여주어, 매수 또는 매도 타이밍을 확신 있게 결정할 수 있습니다. 혼란 없음. 추측 없음. 진짜인지 아닌지를 알려주는 간단한 선만 있습니다. 매우 쉬운 사용법 — 모든 수준에 적합 명확한 매수 및 매도 신호 20분 이상 차트에 최적화, 스캘핑에도 유용 합성 변동성 지수에서 가장 잘 작동합니다 — 뉴스가 이러한 시장에 영향을 미치지 않기 때문에 순수한 모멘텀 신호를 얻을 수 있습니다. 작동 원리: 차트에는 세 개의 선이 표시됩니다: 단기 추세선 (노란색) 장기 추세선 (파란색) 모멘텀 섀도우 선 (흰색) — 과거 가격 움직임을 따름 매수 신호: 가격이 노란색과 파란색 선 위에 있고, 섀도우도 위에 있으면: 강한 상승 모멘텀. 매수 고려. 매도 신호: 가격이 두 선 아래로 떨어지고, 섀도우도 아래에 있으면: 강한 하락
In the context of trading, Malaysia SNR (Support and Resistance) refers to the technical analysis of support and resistance levels in financial markets, particularly for stocks, indices, or other assets traded. This is single timeframe version. Multiple timeframe version is avaiable here . There are three type of Malaysia SNR level Classic , GAP and Flipped 1. Classic Support is the price level at which an asset tends to stop falling and may start to rebound. It acts as a "floor" where demand is
Alpha One MT5
Burak Baltaci
알파 원 MT5 - 고급 추세 탐지 시스템 알파 원은 전문적인 추세 추종 지표로, 차트에 직접 표시되는 자동 진입, 손절매, 세 가지 이익 실현 수준과 함께 명확한 매수 및 매도 신호를 제공합니다. 이 지표는 실시간 추세 강도와 방향을 반영하기 위해 녹색과 빨간색 사이를 전환하는 15개의 동적 라인으로 구성된 독특한 에너지 필드 시각화 기능을 갖추고 있습니다. 녹색 에너지는 강세 우세를, 빨간색 에너지는 약세 압력을 나타내어 시장 모멘텀을 즉시 시각적으로 파악할 수 있게 합니다. 신호 시스템 신호는 여러 독립적인 분석 차원에서의 모멘텀 변화를 분석하는 다중 확인 과정을 통해 생성됩니다. 각 신호는 차트에 표시되기 전에 여러 구성 요소의 일치된 판단이 필요합니다. 리페인트 없음 보장 모든 신호는 확정된 마감 바에서만 계산됩니다. 신호가 표시되면 절대 이동, 변경 또는 사라지지 않습니다. 과거 데이터에서 보는 것은 실시간에 나타난 것과 정확히 동일합니다. 백테스트 결과는 실제 성
VibeFox Squeeze Detector — 스퀴즈 압축, 모멘텀, 진입 지점 VibeFox Squeeze Detector는 MetaTrader 5를 위한 실시간 Squeeze Detector 지표입니다. 시장이 좁은 범위로 압축되는 구간을 식별하고 그 수면 아래에서 쌓여가는 모멘텀을 측정하므로, 시장이 속박에서 벗어나는 순간 곧바로 행동할 수 있습니다. 고전적인 스퀴즈 로직과 모멘텀 히스토그램은 별도의 하위 창에 표시되고, 진입 표시는 가격 차트 위에 바로 찍히며, 모든 컨트롤은 하나의 현대적인 인터랙티브 패널에 모여 있습니다. 지표가 측정하는 것 핵심 개념은 서로 다른 속도로 확장하고 수축하는 두 변동성 밴드의 비교입니다. Bollinger Bands 는 변동성에 빠르게 반응합니다. 이 밴드가 Keltner Channel 안쪽으로 좁아지면 시장은 스퀴즈에 들어간 것입니다——방향성 있는 움직임이 오기 전에 에너지가 축적되는 압축된 범위의 구간입니다. Bollinger Bands
RevTech
Bashier Awny Husein Ismail Alhafy
Revtech MT5 Indicator brings together institutional concepts, market-structure logic, and classic price action patterns in one advanced trading tool. From Fair Value Gaps and Order Blocks to Head & Shoulders and Triangle formations, Revtech helps traders identify quality setups with clear chart visuals and execution levels. With dashboard monitoring, alerts, and timeframe-based strategy alignment, Revtech is designed to turn raw price action into a structured trading opportunity. The indicator
Chessmark
Matheus Oliveira Rossi
Trend Indicator  This indicator is about long buy and long sell using a simple visualization of trend.  The green candle after a long sell period means a good moment to buy. A red candle after a long sequence of buyers means a good moment for sell. After all, you can use all time-frames on this indicator. * * If you prefer a better visualization, use long period on chart. Ex: 1H and 4H.   
Breakout Entry Signals MT5
Christopher Graham Parish
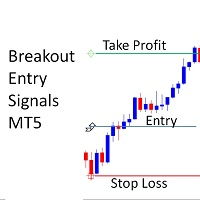
!! FLASH SALE !!   Over 80% off !!     For ONE week only. Now only $47 - normally $297! >>>      Ends on 30 June 2023 - Don't miss it! Buy and Sell Alerts when price breaks out following strict price action. Sends Alerts – #On MT5 To Your Phone To Your Email Does not repaint . Works on any Forex pair, any timeframe. 10 Activations allowed so you are free from limitations >> MT4 Version Here For spreads from a tiny 0.1pip RAW/ECN Accounts,  click here . Check out my Waka Esque EA signal here
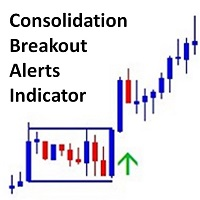
The Consolidation Breakout Alerts Indicator will revolutionize your trading strategy. Our innovative indicator offers unique buy and sell arrows when price breaks out from consolidation, allowing you to get in at the most optimal entry with minimal risk and maximum reward potential. Never again will you miss out on the lucrative trading opportunities available in volatile markets. Let the Consolidation Breakout Alerts Indicator do the work for you and reap the rewards! Buy and Sell Arrows when
Limitless MT5
Dmitriy Kashevich
Limitless MT5 is a universal indicator suitable for every beginner and experienced trader. works on all currency pairs, cryptocurrencies, raw stocks Limitless MT5 - already configured and does not require additional configuration And now the main thing Why Limitless MT5? 1 complete lack of redrawing 2 two years of testing by the best specialists in trading 3 the accuracy of correct signals exceeds 80% 4 performed well in trading during news releases Trading rules 1 buy signal - the ap
Ichimatrix Indicator
Arif Lesmana Yoga
IchiMatrix Indicator A MetaTrader 5 chart indicator (signals only, no order execution) that plots BUY/SELL arrows on closed bars, so signals do not repaint. It combines Ichimoku, SNR/SND zones and swing fractal breakouts. All thresholds are ATR/percentile-based, so it works on any pair and timeframe. •        Signals: three triggers (zone breakout, swing breakout, Tenkan/Kijun cross) filtered by a minimum score of 0–100 (default 60). •        10 filters: Ichimoku trend, Chikou, higher-timeframe
Confluence Dashboard
Allan Aparece Ninal
Confluence Dashboard is a dashboard indicator for MetaTrader 5. One row per symbol shows six checks (EMA, ADX, MACD, RSI, SuperTrend, UT Bot) and a BUY, SELL or WAIT verdict, with alerts. You choose how many checks must agree before the verdict turns BUY or SELL, so you see at a glance which symbols line up on one timeframe. It places no orders and does not repaint. Rows use closed bars only, and one copy shows one timeframe. Standalone: everything is built in. You do not need to buy or install

Footprint Chart Visualizer Footprint Chart Visualizer turns your main chart into a professional footprint chart, overlaying buy and sell volume at every price level directly on top of the candles, bar by bar. Key features Price level footprint : each bar is split into horizontal cells showing buy and sell volume separately, with distinct colors for an instant read of order flow pressure. Delta panel : a delta bar (buy minus sell) for every candle, so you can spot directional imbalance at a glanc
The indicator is designed to close positions on the market in time. For example: to take profits ahead of schedule if the price has not reached TakeProfit, and the market is turning around. The indicator analyzes the momentum, not the trend. He does not give any information about the trend. The indicator is well suited for finding divergence. The Ershov 38 Parrots indicator dynamically adjusts to the market and detects price movement impulses of medium and high amplitude. It almost does not rea
Rheon Indica
Tsepang Lawrence Nkisi
Rheon Indica v1.1 by DipRip — Yellow Line Rejection Signal Indicator A multi-timeframe rejection-signal indicator for MetaTrader 5, built around H4 trend structure and M15 support/resistance "yellow lines." Rheon v1.1 is the signal engine behind the Rheon ScalpGrid strategy, packaged as a pure, non-trading indicator. It draws the same H4 structure levels and M15 "yellow lines" the strategy trades from, and marks every valid rejection with a clean arrow the moment it's confirmed — so you can watc
Your feedback is very valuable to us. By sharing your experience, you help us improve and provide you with better service. Thank you! PIPnova Candle Signals: Catch the Clearest Reversal Signals in the Market! PIPnova Candle Signals is a professional MetaTrader 5 indicator designed to instantly detect critical moments in price action—namely, potential trend reversals and points of indecision. It reliably catches the most powerful and trustworthy candle patterns, Pinbars and Dojis, with custo
FREE
CDC Trend Matrix
Peechanat Chatsermsak
The CDC Trend Matrix is a next-generation indicator that seamlessly combines trend detection with momentum insights, helping you spot optimal entry and exit zones at a glance. Its intuitive “zone” coloring immediately signals Bullish, Bearish, or Sideways market phases, while on-chart alerts keep you informed without cluttering your screen. Highlights Color-coded bars for instant trend zone recognition Clear BUY/SELL labels for precise action points Fully customizable settings to match your ri
Machine Learning Adaptive SuperTrend - Take Your Trading to the Next Level! Introducing the   Machine Learning Adaptive SuperTrend , an advanced trading indicator designed to adapt to market volatility dynamically using machine learning techniques. This indicator employs k-means clustering to categorize market volatility into high, medium, and low levels, enhancing the traditional SuperTrend strategy. Perfect for traders who want an edge in identifying trend shifts and market conditio
B3 및 CME 선물(WIN, WDO, B3 주식, ES, NQ, CL, GC) Delta Aggression Volume PRO는 공격적 매수자와 공격적 매도자 중 누가 더 많이 거래했는지 봉마다 보여주고, 공격 체결과 가격 방향이 어긋난 봉을 표시합니다. 종목의 실제 체결을 공격 주체(매수 또는 매도)와 함께 제공하는 브로커가 필요합니다. 외환, CFD, 대부분의 암호화폐 데이터에는 체결이 없어 해당 종목의 실시간 차트에서는 창이 비어 있습니다. 무료 Delta Aggression Volume 으로 봉별 기본 델타를 볼 수 있습니다. PRO는 리버스 바, 레인지 채널, 총 거래량 이동평균, 알림 6개, EA용 버퍼 20개를 추가합니다. Aggression Wave PRO 와 함께 쓰기 좋습니다: 여기서는 봉별 델타, 거기서는 하루 동안 누적된 공격 체결을 봅니다. 기능 델타 막대: 공격적 매수가 많으면 녹색, 공격적 매도가 많으면 빨간색. 리버스 바: 델타가 양수인데 봉이 하락
MSNR Precision Entry Pro Short description Rule-based MSNR support/resistance engine with freshness tracking, SBR/RBS role-reversal, liquidity sweep detection, market structure (BOS/MSS) and a non-repainting confluence-scored entry signal. Full description: MSNR Precision Entry Pro is a non-repainting MetaTrader 5 indicator built around the MSNR (Market Structure & Support/Resistance) methodology: trading from well-defined price zones only after they show a genuine reaction, not simply because
**Twin Range Filter** is a trend-following signal indicator that filters out market noise using **two smoothed volatility ranges** — a fast one and a slow one — blended into a single adaptive filter line. It prints clear **Long** and **Short** labels only when price breaks decisively through the filter *and* the previous signal was the opposite direction, so you get one clean signal per swing instead of a stream of noise. It works on **any symbol and any timeframe** (Forex, indices, metals, cr
News Radar Pro
Musa Terrance Khosa
News Radar Pro transforms MT5’s built-in economic calendar into a live, on-chart trading tool. View upcoming macroeconomic events directly on your chart with impact-based filtering, countdown timers, and intelligent alerts, all in your chosen timezone. No external websites, APIs, or data feeds required. How It Works Economic Calendar Integration Access MT5’s global economic events database directly on your chart. Event Filtering Filter economic events by impact level (High, Medium, Low) and cu
Breakout Index
Waleed Saleem
Monster Breakout Index V2 is a clean, visual momentum indicator engineered to spot potential breakout opportunities by evaluating extreme price extensions against median historical range channels. Overview The indicator continuously monitors the median price across a configurable lookback window and compares it against current high and low extremes. When price expansion breaks out of the established median bounds, MBI V2 immediately plots distinct histogram bars in a separate window, allowing tr
이 제품의 구매자들이 또한 구매함
Trend Sniper X
Sarvarbek Abduvoxobov
4.87 (46)
Trend Sniper X 는 트레이더가 추세 방향과 잠재적 반전 지점을 명확하고 정확하게 포착할 수 있도록 도와주는 MetaTrader 5용 멀티 타임프레임 추세 추종 지표입니다. MT4용: https://www.mql5.com/en/market/product/193245 가격 정보: 현재 가격은 프로모션 할인가이며, 향후 업데이트 및 새로운 기능이 출시됨에 따라 변동될 수 있습니다. 보너스 혜택: 본 지표 전용 무료 자동매매 Assistant EA를 받으시려면 구매 후 작성자에게 메시지를 보내주시기 바랍니다. Code2Profit 채널 멀티 타임프레임 분석으로 시장을 마스터하세요! Trend Sniper X로 승률을 극대화하는 방법: 핵심 규칙 및 세션 팁 기술 사양 플랫폼 MetaTrader 5 지표 유형 멀티 타임프레임 추세 지표 운용 타임프레임 모든 차트 타임프레임 지원, 독립적으로 선택 가능한 상위 타임프레임(M1–MN1) 주요 상품 외환, 금(XAUUSD) 및 기타 C
새로운 왕의 등장 - 인디케이터 + 주문 관리 표시(TP1 + TP2 + TP3) + 선택형 텔레그램 시그널 전송 기능 포함 (무료) (완전한 트레이딩 및 시그널 시스템) 골드를 위한 최고의 EA: Gold Slayer 이 인디케이터는 고급 전략, 사용자 지정 가능한 주문 관리 시스템, 그리고 엔벨로프 확장을 결합한 평균 회귀(mean reversion) 시스템을 포함하고 있습니다. 또한 RSI와 같은 여러 지능형 확인 필터를 통해 높은 확률의 반전 진입 구간을 포착하여 BUY 및 SELL 시그널을 제공합니다. 단순히 거래 방법만 배우는 것이 아니라, 여러 포지션을 효과적으로 관리하고 이전에 수익 중인 오픈 포지션으로 손실 거래를 커버하는 방법까지 익힐 수 있습니다. M5 전용으로 설계 및 최적화되었으며, 유동성이 풍부해 시그널이 더 깔끔하고 신뢰도 높은 BTCUSD와 XAUUSD에서 뛰어난 성능을 발휘합니다. 이 인디케이터는 ATR 기반으로 자동 계산된 진입가, 손절가, 익절가와
Entry Points Pro for MT5
Yury Orlov
4.55 (153)
Entry Points Pro는 주문을 넣기 전에 어디에서 진입하고, 스탑을 어디에 두고, 어떤 랏으로 거래할지 보여 줍니다. 가격 지금 199 USD이며, 이 가격으로는 8카피입니다. 이후 가격은 249 USD, 최종 가격은 349 USD입니다. 저는 시장에서 트레이딩으로 돈을 벌고 그것을 보여 드립니다. 그래서 이 인디케이터를 모두에게 팔 필요가 없습니다. 스스로 생각하는 트레이더를 위한 도구이지, 마법 버튼이 아닙니다. 돌파가 없으면 거래도 없습니다. 회색 화살표는 취소된 신호입니다. 가격이 신호 캔들을 돌파하지 못했으므로 진입도 손실도 없습니다. 화살표는 캔들이 마감될 때 나타나며 리페인팅되지 않습니다. 설정은 두 가지: 예치금과 거래당 리스크. 결제 전에 확인하세요: 무료 데모는 MT5 전략 테스터에서 작동하며 2분이면 됩니다. 구매 후에는 제가 직접 설정을 도와 드리겠습니다. 2019년, 저는 이 지표가 무엇을 할 수 있는지 전 세계에 보여 주었습니다. 실계좌에서 지표의
Gann Made Easy MT5
Oleg Rodin
5 (13)
Gann Made Easy 는 mr.의 이론을 사용하여 최고의 거래 원칙을 기반으로 하는 전문적이고 사용하기 쉬운 Forex 거래 시스템입니다. W.D. 간. 이 표시기는 Stop Loss 및 Take Profit Levels를 포함하여 정확한 BUY 및 SELL 신호를 제공합니다. PUSH 알림을 사용하여 이동 중에도 거래할 수 있습니다. 구매 후 거래 방법 안내 및 유용한 추가 지표를 무료로 받으시려면 저에게 연락주세요! 아마도 Gann 거래 방법에 대해 이미 여러 번 들었을 것입니다. 일반적으로 Gann의 이론은 초보자 거래자뿐만 아니라 이미 거래 경험이 있는 사람들에게도 매우 복잡한 것입니다. Gann의 거래 방식은 이론적으로 적용하기 쉽지 않기 때문입니다. 나는 그 지식을 연마하고 Forex 지표에 최고의 원칙을 적용하기 위해 몇 년을 보냈습니다. 표시기는 적용하기가 매우 쉽습니다. 차트에 첨부하고 간단한 거래 권장 사항을 따르기만 하면 됩니다. 지표는 지속적으로 시장 분석
Ultra Indicator
Ihor Otkydach
5 (1)
ULTRA는 “올인원” 방식으로 작동하는 기술적 지표로, 시장을 독자적으로 분석하고, 매매 신호를 생성하며, 손절매 주문 설정 수준을 표시하고, 이익을 실현하거나 손실을 최소화하기 위해 포지션을 청산해야 할 시점을 제안합니다. 다시 말해, 시장을 분석하는 법을 모르거나, 가격 수준(손절매를 어디에 설정할지)을 파악하지 못하거나, 자금 관리에 어려움을 겪더라도 상관없습니다. ULTRA가 그 모든 것을 대신 해줄 테니까요! 구매자 특전 : ULTRA 지표를 구매하신 후, 저에게 비공개 메시지를 보내주시면 “ULTRA BOT”을 무료 선물로 드립니다. 이 도구는 해당 지표의 신호를 바탕으로 개설한 거래를 관리하는 데 도움을 주는 특별한 도구입니다(각 거래에 대해 손절매를 설정하고, 최상의 결과를 얻을 수 있도록 전략의 규칙에 따라 거래를 자동으로 청산해 줍니다).  또한 구매자분들께 다양한 자산에 바로 적용할 수 있는 설정값을 제공해 드리고 있으며, 이를 통해 지표가 최대 효율로 작동할
SuperScalp Pro
Van Minh Nguyen
4.54 (37)
SuperScalp Pro - Professional Multi-Layer Confluence Scalping System SuperScalp Pro는 기존 Supertrend에 여러 지능형 확인 필터를 추가하여 기능을 강화한 고급 스캘핑 지표입니다. 잘못된 신호를 크게 줄이면서 성공 가능성이 더 높은 Buy/Sell 거래 기회를 식별하는 데 도움을 줍니다. 명확한 Buy 및 Sell 화살표가 차트에 직접 표시되며, ATR 기반 Stop Loss 및 Take Profit 레벨도 실시간으로 자동 계산됩니다. 구매 후 MQL5 메시지로 저에게 연락하시면 SuperScalp Pro Auto Trader EA를 무료로 받으실 수 있으며, 사용자 가이드와 비공개 그룹 이용 권한도 제공됩니다. 권장 설정 파일 다운로드: [Set File] 전체 문서는 제품 블로그에서 확인할 수 있습니다: [User Guide] 업데이트를 받으려면 공식 채널에 참여하세요: [Official Channel]
Azimuth Pro
Ottaviano De Cicco
5 (7)
Azimuth Pro V2: Synthetic Fractal Structure and Confirmed Entries for MT5 Overview Azimuth Pro is a multi-level swing structure indicator by Merkava Labs . Four nested swing layers, swing-anchored VWAP, ABC pattern detection, three-timeframe structural filtering, and closed-bar confirmed entries — one chart, one workflow from micro-swings to macro-cycles. This is not a blind signal product. It is a structure-first workflow for traders who care about location, context, and timing. 1. What Change
FX Power MT5 NG
Daniel Stein
5 (33)
FX Power: 통화 강세 분석으로 더 스마트한 거래 결정을 개요 FX Power 는 어떤 시장 상황에서도 주요 통화와 금의 실제 강세를 이해하기 위한 필수 도구입니다. 강한 통화를 매수하고 약한 통화를 매도함으로써 FX Power 는 거래 결정을 단순화하고 높은 확률의 기회를 발견합니다. 트렌드를 따르거나 극단적인 델타 값을 사용해 반전을 예측하고자 한다면, 이 도구는 귀하의 거래 스타일에 완벽히 적응합니다. 단순히 거래하지 말고, FX Power 로 더 스마트하게 거래하세요. 1. FX Power가 거래자에게 매우 유용한 이유 통화와 금의 실시간 강세 분석 • FX Power 는 주요 통화와 금의 상대적 강세를 계산하고 표시하여 시장 역학에 대한 명확한 통찰력을 제공합니다. • 어떤 자산이 앞서고 있고 어떤 자산이 뒤처지는지 모니터링하여 보다 현명한 거래 결정을 내릴 수 있습니다. 포괄적인 멀티 타임프레임 뷰 • 단기, 중기 및 장기 타임프레임에서 통화와 금의 강세를
FiboSniper Pro
Van Minh Nguyen
5 (4)
FiboSniper Pro – Multi-Filter Fibonacci System with Auto SL/TP and Control Panel FiboSniper Pro는 동적 Fibonacci Envelopes와 여러 확인 필터를 결합하여 선별된 Buy 및 Sell 신호를 생성하는 기술적 지표입니다. Fibonacci 레벨은 Moving Average와 ATR을 기반으로 계산된 후 ADX, EMA, RSI, ATR, Volume, Time 및 Candle 구조를 통해 필터링됩니다. 이 지표는 ATR 기반의 자동 Stop Loss 및 Take Profit 레벨을 차트에 직접 표시하며, 빠른 설정 조정을 위한 인터랙티브 Control Panel을 제공합니다. 구매 후 MQL5 메시지로 저에게 연락하시면 Auto Trader X를 무료로 받으실 수 있으며, 이 지표의 거래 신호를 자동화하는 방법에 대한 안내도 제공됩니다. User Guide 및 Set Files: [Click here
Power Candles MT5
Daniel Stein
4.58 (12)
Power Candles V3 - 자체 최적화 강도 지표 파워 캔들 V3는 적용된 모든 차트에서 통화 및 상품의 강세를 실행 가능한 거래 계획으로 전환합니다. 단순히 캔들에 색상을 입히는 대신, 백그라운드에서 실시간 자동 최적화를 수행하여 현재 보고 있는 종목에 대한 최적의 손절매, 익절 및 신호 임계값을 제공합니다. 한 번의 클릭으로 실시간 거래에 적용할 수 있으며, 진입점, 손절매 및 익절 선이 정확한 가격에 맞춰 차트에 표시되고, 방향과 함께 알림이 발령됩니다. 이 도구는 Stein Investments 에코시스템의 일부입니다. 18개 이상의 도구와 함께 당신의 1대1 AI 트레이딩 멘토 Max.  항상 대기 중, 모든 인디케이터를 깊이 있게 이해, 무언가를 차근차근 생각해보고 싶은 순간에 도움을 줍니다.  https://stein.investments 에서 만나보세요 매 종가 바마다 3,000회 이상의 트레이딩 시뮬레이션. 9가지 강도 상태. 2가지 전략을 병렬로 테스트.
M1 Sniper MT5
Oleg Rodin
5 (7)
M1 SNIPER 는 사용하기 쉬운 거래 지표 시스템입니다. M1 시간대에 맞춰 설계된 화살표 지표입니다. 이 지표는 M1 시간대 스캘핑을 위한 단독 시스템으로 사용할 수 있으며, 기존 거래 시스템의 일부로도 사용할 수 있습니다. 이 거래 시스템은 M1 시간대 거래용으로 특별히 설계되었지만, 다른 시간대에도 사용할 수 있습니다. 원래는 XAUUSD와 BTCUSD 거래를 위해 이 방법을 설계했지만, 다른 시장 거래에도 유용하다는 것을 알게 되었습니다. 이 지표의 신호는 추세 방향과 반대로 거래될 수 있습니다. 저는 지표의 신호를 활용하여 양방향으로 거래할 수 있도록 돕는 특별한 거래 기법을 알려드립니다. 이 방법은 특별한 동적 지지선과 저항선 가격 영역을 활용하는 것을 기반으로 합니다. 구매하시면 M1 SNIPER 화살표 지표를 바로 다운로드하실 수 있습니다. 또한, 아래 스크린샷에 표시된 Apollo Dynamic SR 지표는 M1 SNIPER 도구를 사용하는 모든 사용자에게 무료로
SQN Max indicator for MT5 by ITC
Renaud Herve Francois Candel
Sqn Max Indicator Sqn Max is an exclusive indicator to trade the market with high effectiveness. The indicator is based on price action, volatility and trend. This indicator is as simple as possible but not too simple. The indicator can generate alerts to ease the trading process. You don't have to stay all day in front of your screen. The indicator can be used with any class of assets and with any time frame. It is possible to achieve better results trading our list of selected assets. We achi
Auto Optimized SpeedAngle 은 지속적인 워크포워드 최적화(Walk-Forward Optimization, WFO)를 통해 곡선 적합(curve-fitting)을 제거한 기관 수준의 모멘텀 벡터화 시스템입니다. 시장 체제가 바뀔 때 성능이 떨어지는 정적 입력에 의존하는 대신, 이 지표는 표본 외(Out-of-Sample, OOS) 검증을 사용하여 매개변수를 동적으로 재보정하며, 표시되는 신호가 과거의 우연이 아닌 진정한 통계적 우위를 나타내도록 보장합니다. 핵심 기관용 프레임워크 워크포워드 최적화 엔진: 핵심 알고리즘은 수천 가지의 룩백(lookback) 및 임계값 조합을 지속적으로 스캔하며, 데이터를 인샘플(in-sample)과 표본 외(out-of-sample) 세트로 엄격하게 분리합니다. 미지의 데이터 환경에서 수학적 우수성이 증명된 경우에만 새로운 매개변수 구성을 채택합니다. 정량적 목적 함수: 순수한 총이익을 쫓는 대신, 최적화 엔진은 기관 수준의 안정성
Apex Patterns PRO 인디케이터 구매 시 - 기반 Expert Advisor 무료 제공. 자체 최적화 차트 패턴 및 브레이크아웃 분석 시스템 기존의 패턴 스캐너는 고정된 파라미터에 의존하므로 시장 변동성과 구조가 변화할 때 성능이 저하되는 경우가 많습니다. Apex Patterns PRO는 구조적 차트 패턴 인식, 모멘텀 필터링, 통계적 자체 최적화를 하나의 분석 프레임워크로 결합하여 변화하는 시장 환경에 적응하도록 설계되었습니다. 적응형 스캐닝 엔진 자체 최적화 패턴 모드 최근 과거 데이터를 바탕으로 적절한 패턴 파라미터를 자동으로 탐색하여, 정적인 설정 대신 현재 시장 행보에 맞춰 인디케이터의 구조 감지 방식을 적응시킵니다. 스마트 브레이크아웃 필터링 클래식 패턴 인식과 모멘텀, 거래량, 프라이스 액션 지표를 결합합니다. 모든 브레이크아웃을 동일하게 다루는 대신, 시장의 기저 구조를 평가하여 현재 통계적 환경에 부합하는 셋업을 식별합니다. 주요 기능 리페인트 없는 고
Divergence Bomber
Ihor Otkydach
4.89 (94)
이 지표를 구매하신 분께는 다음과 같은 혜택이 무료로 제공됩니다: 각 거래를 자동으로 관리하고, 손절/익절 수준을 설정하며, 전략 규칙에 따라 거래를 종료하는 전용 도우미 툴 "Bomber Utility" 다양한 자산에 맞게 지표를 설정할 수 있는 셋업 파일(Set Files) "최소 위험", "균형 잡힌 위험", "관망 전략" 모드로 설정 가능한 Bomber Utility의 셋업 파일 이 전략을 빠르게 설치, 설정, 시작할 수 있도록 돕는 단계별 영상 매뉴얼 주의: 위의 모든 보너스를 받기 위해서는 MQL5 개인 메시지 시스템을 통해 판매자에게 연락해 주세요. 독창적인 커스텀 지표인 “Divergence Bomber(다이버전스 봄버)”를 소개합니다. 이 지표는 MACD 다이버전스(괴리) 전략을 기반으로 한 올인원(All-in-One) 거래 시스템입니다. 이 기술 지표의 주요 목적은 가격과 MACD 지표 간의 다이버전스를 감지하고, **향후 가격이 어느 방향으로 움직일지를 알려주
다음 업데이트 — 버전 2.52 곧 출시! [신규] 시장 분석 및 트레이딩 워크플로를 향상시키기 위해 설계된 4가지 주요 신규 기능을 기대해 주세요. 트레이딩 요구 사항을 충족하도록 설계된 4가지 새로운 기능으로 시장 분석을 한 단계 더 발전시킵니다. 다음 기능을 소개합니다: 1. TRADE OVERVIEW DASHBOARD 2. CONFLUENCE AT ZONE 3. STRONG & WEAK HIGH/LOW 4. OTE 1. TRADE OVERVIEW DASHBOARD 시장 전체 상황을 더 쉽게 파악할 수 있도록 도와주는 대시보드입니다. 트레이딩 의사결정을 지원하는 가이드를 제공하며, 하나의 화면에서 시장을 분석하고 체계적으로 트레이딩을 계획할 수 있도록 도와줍니다. 멀티 타임프레임 시장 개요 (Multi-Timeframe Market Overview) 시장 방향과 가격 구조를 더욱 명확하게 파악 시장 상황을 빠르게 확인 체계적인 시장 분석 및 진입 계획을 위한 가이드 2. CO
Adaptive Price Action Engine 지표를 구매하면 EA(자동매매 프로그램)가 무료 멀티 타임프레임 기반 자기 최적화 추세 & 캔들 패턴 분석 시스템 시장은 끊임없이 변화하며, 모든 Price Action 패턴이 모든 시장 환경에서 동일한 가치를 가지는 것은 아닙니다. Adaptive Price Action Engine 은 변화하는 시장 환경에 적응할 수 있도록 설계되었으며, 추세 구조, 멀티 타임프레임 분석, 캔들 패턴 및 통계적 최적화 를 하나의 분석 프레임워크로 결합합니다. 두 가지 적응형 모드 Dual Alpha Trend Mode 낮은 타임프레임과 높은 타임프레임에서 적합한 Alpha Trend 파라미터를 자동으로 탐색하여, 최근 시장 움직임에 맞춰 추세 분석을 조정합니다. Candlestick + Alpha Mode Alpha Trend를 통한 시장 국면 분석과 22개의 상승 및 하락 캔들 패턴 을 결합합니다. 모든 패턴을 동일하게 취급하는 대신, 다양
통화 강도 마법사는 성공적인 거래를 위한 올인원 솔루션을 제공하는 매우 강력한 지표입니다. 표시기는 여러 시간 프레임의 모든 통화 데이터를 사용하여 이 또는 해당 외환 쌍의 힘을 계산합니다. 이 데이터는 특정 통화의 힘을 확인하는 데 사용할 수 있는 사용하기 쉬운 통화 지수 및 통화 전력선의 형태로 표시됩니다. 필요한 것은 거래하려는 차트에 표시기를 부착하는 것뿐입니다. 표시기는 거래하는 통화의 실제 강세를 보여줍니다. 지표는 또한 추세와 거래할 때 유리하게 사용할 수 있는 구매 및 판매 거래량 압력의 극한값을 보여줍니다. 지표는 또한 피보나치에 기반한 가능한 대상을 보여줍니다. 표시기는 PUSH 알림을 포함한 모든 유형의 알림을 제공합니다. 구매 후 연락주세요. 나는 당신과 거래 팁을 공유하고 당신에게 무료로 훌륭한 보너스 지표를 줄 것입니다! 나는 당신에게 행복하고 유익한 거래를 기원합니다!
Naked Forex Tweezer Pro Indicator Tweezer Pro Indicator is a pattern recognition indicator for Forex, Stocks, Indices, Futures, Commodities and Cryptos. The standard Tweezer is a two bar pattern. Our enhanced version is a multi-bar pattern. We filter the patterns for you so that you only get the     best and most effective patterns   and ignore the noise. The Tweezer pattern is a simple and effective pattern to trade. The strategy that comes with the Tweezer is based on price action. The Twe
FX Levels Premium indicator for MT5
Renaud Herve Francois Candel
Fx Levels Premium Indicator Support and Resistance are important concepts in trading. Fx Levels Premium was created to easily draw important levels of support and resistance for the active trader. The indicator will give you all important levels (support/resistance) to watch for a wide range of assets. Trading without these levels on your chart is like driving a car for a long journey without a roadmap. You would be confused and blind. Support and resistance levels should be used as guideline
Crystal Heikin Ashi Signals
Muhammad Jawad Shabir
5 (5)
Crystal Heikin Ashi Signals—Professional Trend & Signal Detection Indicator Advanced Heikin Ashi Visualization with Intelligent Signal System for Manual & Automated Trading Final Price: $149 ---------> Price goes up $10 after every 10 sales . Limited slots available — act fast . Overview User Guide PDF Crystal Heikin Ashi Signals is a professional-grade MetaTrader 5 indicator that combines pure Heikin Ashi candle visualization with an advanced momentum-shift detection system. Designed for both m
FX Volume MT5
Daniel Stein
4.79 (24)
FX Volume: 브로커 시각에서 바라보는 진짜 시장 심리 간단 요약 트레이딩 접근 방식을 한층 더 향상시키고 싶으신가요? FX Volume 는 소매 트레이더와 브로커의 포지션을 실시간으로 파악할 수 있게 해 줍니다. 이는 COT 같은 지연된 보고서보다 훨씬 빠릅니다. 꾸준한 수익을 추구하는 분이든, 시장에서 더 깊은 우위를 원하시는 분이든, FX Volume 을 통해 대규모 불균형을 찾아내고, 돌파 여부를 확인하며 리스크 관리를 정교화할 수 있습니다. 지금 시작해 보세요! 실제 거래량 데이터가 의사결정을 어떻게 혁신할 수 있는지 직접 경험해 보시기 바랍니다. 1. 트레이더에게 FX Volume이 매우 유익한 이유 탁월한 정확도를 지닌 조기 경보 신호 • 다른 사람들보다 훨씬 앞서, 각 통화쌍을 매수·매도하는 트레이더 수를 거의 실시간으로 파악할 수 있습니다. • FX Volume 은 여러 리테일 브로커에서 추출한 실제 거래량 데이터를 종합해 명확하고 편리한 형태로 제공하는
Apollo SR Master는 지지/저항 구간에서의 거래를 더욱 쉽고 안정적으로 만들어 주는 특수 기능을 갖춘 지지/저항 지표입니다. 이 지표는 지역 가격의 고점과 저점을 감지하여 시간 지연 없이 실시간으로 지지/저항 구간을 계산합니다. 새롭게 형성된 저항 구간을 확인하기 위해 지표는 해당 저항 구간을 실제 매도 또는 매수 신호로 활용할 수 있음을 나타내는 특수 신호를 표시합니다. 이 경우, 저항 구간의 강도가 높아지고, 따라서 저항 구간에서의 성공적인 거래 가능성도 높아집니다. 이것이 바로 이 지표의 핵심 아이디어입니다. SR 존은 손절매와 이익실현을 더욱 쉽게 할 수 있도록 해줍니다. 신호 방향에 따라 SR 존 위 또는 아래 공간을 손절매로 활용할 수 있습니다. 또한, 반대쪽 SR 존은 잠재적 이익실현 영역으로 활용할 수 있습니다. 또한 Apollo SR Master 지표를 사용하는 모든 사용자에게 "Apollo Price Action System" 지표를 무료로 제공합니다.
FX Trend MT5 NG
Daniel Stein
5 (6)
FX Trend NG: 차세대 멀티 마켓 트렌드 인텔리전스 개요 FX Trend NG 는 다중 시간 프레임 기반의 전문 트렌드 분석 및 시장 모니터링 도구입니다. 몇 초 만에 전체 시장 구조를 파악할 수 있도록 설계되었습니다. 여러 차트를 일일이 전환할 필요 없이, 어떤 종목이 추세에 있는지, 어디에서 모멘텀이 약화되고 있는지, 그리고 어떤 시간 프레임이 서로 정렬되어 있는지 즉시 확인할 수 있습니다. 출시 기념 특별 혜택 – FX Trend NG 를 $30 (6개월) 또는 $80 평생 라이선스 로 이용할 수 있습니다. 이미 Stein Investments 고객이신가요? -> 메시지를 보내 전용 고객 그룹에 참여하세요. 설정이나 사용 방법이 필요하신가요? -> Stein Investments 공식 페이지 를 방문하세요. 1. FX Trend NG가 특별한 이유 3단계 추세 로직 – 단순한 Buy / Sell이 아닙니다 • 대부분의 지표는 Buy 또는 Sell 두 가지 상태만 제
Astral Volume
Ottaviano De Cicco
Astral Volume 거래량 가중 모멘텀을 더 넓은 맥락에서 읽으세요. 출시 특별가 — $78 · 35% 할인 · 출시 할인 후 $120. 현재 시간대의 강한 움직임도 상위 시간대에서는 다르게 보일 수 있습니다. 가격과 거래량을 함께 분석하는 트레이더를 위해 Astral Volume은 방향 변화를 평가하기 전에 현재 값과 더 넓은 시각을 한곳에 모아 줍니다. 움직임의 맥락을 판단하세요. 틱 거래량 가중 모멘텀을 보고 그 강도가 최근 이력과 비교해 어느 수준인지 확인하세요. 일치와 불일치를 파악하세요. 서로 다른 차트를 머릿속으로 조합하지 않고 현재 값 옆에서 두 상위 시간대를 확인하세요. 일관된 확인 조건을 정하세요. 방향 전환 신호를 받아들이기 전에 어떤 시간대가 일치해야 하는지 선택하세요. 모멘텀, 상대 강도, 시간대 간 일치를 함께 보는 방법에 Volume을 활용하세요. 브로커 틱 거래량을 사용하며, 중앙화된 시장의 실제 체결 거래량이나 체결 주문 흐름을 측정하지 않습니다.
Neuro Poseidon MT5
Daria Rezueva
4.68 (53)
Neuro Poseidon is a new indicator by Daria Rezueva. It combines precise trading signals with adaptive TP/SL levels - creating best possible trades as a result! Message me and get  Neuro Poseidon Assistant  as a gift to automize your trading process! What makes it stand out? 1. Proven profitability on all assets and timeframes 2. Only confirmed BUY and SELL signals present on the chart 3. Adaptive TP & SL levels generated by the software for each trade 4. Easy to understand - suitable for al
Boba Analysis Suite
Trade Ready Solutions LLC
5 (2)
Boba Analysis Suite Boba Analysis Suite는 MetaTrader 5용 분석 지표입니다. 시장 구조, 주요 가격 영역, 전반적인 시장 상황을 하나의 차트 화면에 통합하여 표시합니다. 트레이더이자 트레이딩 코치로서의 실무 경험을 바탕으로 개발되었으며, 시장 방향 평가, 주요 가격 수준 식별, 여러 시간대의 종합적인 분석 등 체계적인 분석 과정을 지원합니다. 시장 맥락을 고려한 분석 개별 신호의 의미는 시장 상황에 따라 달라집니다. Boba Analysis Suite는 현재 차트 상황을 더 넓은 시장 구조와 연결하고, 사전에 정한 규칙에 따라 매매 아이디어를 검토할 수 있도록 돕습니다. 주요 분석 기능은 다음과 같습니다. 추세 및 시장 구조: 시장 방향과 관련 구조적 맥락을 평가합니다. 주요 가격 영역 및 수준: 추가 분석이 필요한 중요한 영역을 차트에 시각적으로 표시합니다. 여러 시간대: 서로 다른 시간대의 정보를 통합하여 전반적인 시장 상황을 평가합니다.
SIO Oscillator
Davit Beridze
SIO Oscillator: 자기 최적화 세미분산 불균형 오실레이터 지표를 구매하시면 이를 기반으로 한 전문가 어드바이저(EA)를 무료로 받으실 수 있습니다. 대부분의 오실레이터는 모든 가격 움직임을 똑같이 취급합니다. SIO는 상승 압력과 하락 압력을 분리하여 둘 사이의 불균형을 측정하고, 매수자와 매도자 중 어느 쪽이 실제로 시장을 주도하고 있는지 보여줍니다. 불균형이 극단에 도달하면 SIO는 진입가, 손절(Stop Loss), 익절(Take Profit) 수준이 포함된 명확한 신호를 표시합니다. SIO의 차별점은 고정된 설정에 의존하지 않는다는 것입니다. 내장된 자기 최적화 엔진이 현재 종목과 시간 프레임에 맞는 파라미터를 지속적으로 탐색하고, 사용하기 전에 검증합니다. 두 가지 신호 모드 평균 회귀(Mean Reversion): 불균형의 극단에서 거래하며 균형으로의 복귀를 노립니다. 추세 추종(Trend Following): 지속적이고 우세한 불균형의 방향으로 거래합니다. 자
Trend Lines PRO MT5
Roman Podpora
5 (1)
트렌드 라인즈 프로       이 지표는 시장이 실제로 어떤 방향으로 전환되는지 파악하는 데 도움이 됩니다. 실제 추세 반전 지점과 주요 시장 참여자들이 다시 진입하는 지점을 보여줍니다. 보시다시피       BOS 라인       복잡한 설정이나 불필요한 노이즈 없이 더 높은 시간대의 추세 변화와 주요 레벨을 확인할 수 있습니다. 신호는 차트에 다시 그려지지 않고 캔들이 마감된 후에도 계속 표시됩니다. VERSION MT 4   -   RFI LEVELS PRO   표시기   와 결합할 때 최대 잠재력을 발휘합니다. 지표가 보여주는 내용: 실제 변화       추세(BOS 라인) 한 번 신호가 나타나면 그 신호는 계속 유효합니다! 이는 신호를 발생시킨 후 변경될 수 있는 리페인팅 방식의 지표와 중요한 차이점입니다. 리페인팅 방식의 지표는 잠재적으로 자금 손실로 이어질 수 있습니다. 이제 더욱 높은 확률과 정확도로 시장에 진입할 수 있습니다. 또한 화살표가 나타난 후 목표가(익절)
HyperPOWER
Alfred Charano
HyperPOWER — See the Power. Ride the Trend. Stop guessing direction. See which currency is driving the move, ride the trend and get clean BUY/SELL arrows — all in one beautiful indicator. Description Too many indicators. Too many signals. Still no idea where to enter? HyperPOWER replaces the clutter with one clear answer: who is strong, who is weak, and when the trend agrees. See the power behind every move A live strength score for 9 assets: XAU, EUR, GBP, AUD, NZD, USD, CAD, CHF and JPY. You
제작자의 제품 더 보기
Cumulative Volume Delta Divergence Cumulative Volume Delta Divergence is a volume-pressure analysis indicator for MetaTrader 5. It combines estimated cumulative volume delta with regular and hidden divergence detection, higher-timeframe context, absorption analysis, exhaustion zones, configurable signal scoring, alerts, and historical target/stop outcome tracking. The indicator is designed to help traders identify situations where price structure and estimated volume pressure are behaving di
FVG Horizon
Jade-christian Rabie
FVG Horizon is a Fair Value Gap channel indicator for MetaTrader 5. Instead of filling the chart with extending FVG boxes, it combines active bullish and bearish imbalances into a smooth, adaptive channel. The indicator detects three-candle Fair Value Gaps, stores their relevant price levels and automatically removes them after price closes through the level. The remaining active levels are averaged and smoothed to create dynamic upper and lower channel boundaries. Three configurable Fibonacci l
Volatility Reversal Engine is a multi-layer volatility and mean-reversion indicator for MetaTrader 5. It converts changes in market volatility into a normalized 0–100 oscillator, making it easier to identify volatility expansion, contraction, exhaustion, reversal conditions and divergence. The indicator is designed for traders who want more information than a standard volatility line. It combines volatility percentile analysis, smoothing, price divergence, mean-reversion ranking, graded signals,
Stochastic Quad Rotation with Volume Stochastic Quad Rotation with Volume is a multi-speed stochastic momentum indicator for MetaTrader 5 designed to show momentum rotation, extreme conditions, oscillator alignment, divergence and higher-timeframe context in one separate indicator window. Instead of relying on a single stochastic calculation, the indicator tracks four stochastic speeds together with a volume-weighted stochastic. This makes it possible to see how short-, medium- and longer-term m
필터:
리뷰 없음
리뷰 답변