Auto Trading Plan Generator PRO MT5

Product Overview
Auto Trading Plan Generator PRO is a main‑chart reversal‑pattern trading system designed for both the MT4 and MT5 platforms. It uses the classic three‑bar reversal pattern as its core entry logic, overlays a trend cloud formed by the EMA50 and EMA200 as contextual reference, and instantly draws a complete trading‑plan panel the moment each reversal signal triggers — including a dynamic stop‑loss, dual take‑profit targets, and a structure‑based risk‑reward ratio — so that traders receive a ready‑to‑execute entry/exit plan at the very moment a signal appears, without any manual calculation. The system simultaneously draws the EMA50 (royal‑blue solid line) and EMA200 (orange solid line) trend lines on the main chart, and displays a real‑time trend‑state text label (Up Trend / Down Trend / Range) at the latest candle on the far right of the chart, making the reversal signals and the medium‑term trend background clear at a glance. Fusing pattern recognition, trend monitoring, plan generation, and risk management into one tool, it is an ideal main‑chart instrument for traders pursuing "pattern triggers, plan first" disciplined trading.
Core Features
Three‑Bar Reversal Pattern Recognition This is the most core entry logic of the indicator. The system detects the classic reversal structure composed of three consecutive candles on every candle. The bullish reversal (Buy) requires: the second‑to‑last candle is bearish, the last candle is also bearish with both its high and low lower than the second‑to‑last (forming a declining two‑bar bearish sequence), and the current candle is bullish with its high breaking above the high of the second‑to‑last candle — this structure indicates that the bulls have recaptured lost ground in one stroke after consecutive bearish pressure, a typical bottom‑reversal signal. The bearish reversal (Sell) is a fully mirrored structure: a rising two‑bar bullish sequence followed by a current bearish candle breaking the corresponding low structure, indicating that the bears have seized control after bullish exhaustion, a typical top‑reversal signal. The system applies a cooldown filter to each raw pattern signal to avoid repeatedly triggering duplicate signals in dense ranging zones, ensuring every marked signal carries independent practical significance.
EMA Trend Cloud and Real‑Time Trend State The system draws two exponential moving averages on the main chart — the EMA50 (royal‑blue solid line) and the EMA200 (orange solid line) — which together form a visual trend reference band. When the EMA50 lies above the EMA200 the market is judged to be in a bullish trend, and vice versa for a bearish trend. It must be emphasized that, according to the original design logic of this indicator, the EMA trend state is used only as on‑chart contextual reference and does NOT filter signals — that is, regardless of whether the current trend is bullish or bearish, a signal triggers as long as the three‑bar reversal pattern is satisfied, thereby fully preserving the pattern's reversal‑capturing ability. At the latest candle on the far right of the chart, the system draws a real‑time trend‑state text label: a royal‑blue Up Trend under a bullish trend, an orange Down Trend under a bearish trend, and a gray Range when the two are intertwined, allowing traders to grasp the medium‑term trend background at any time and decide on their own whether to subjectively screen signals against the trend direction.
Trading‑Plan Panel and Stop‑Loss Dashed Line This is the most practically valuable feature of the indicator. Whenever a Buy or Sell signal triggers, the system automatically draws a structured trading‑plan panel beside the signal candle, containing four key data points: Stop (dynamic stop‑loss, taking the more conservative of "entry minus two times ATR14" and "the lowest low of the recent 20 candles" for longs, and the more conservative of "entry plus two times ATR14" and "the highest high of the recent 20 candles" for shorts), T1 (first take‑profit target, based on 1.5 times the risk), T2 (second take‑profit target, based on 2.5 times the risk), and RR (risk‑reward ratio, based on the distance between the recent structural extreme and the entry divided by the risk — (HH20 − entry)/risk for longs and (entry − LL20)/risk for shorts). The panel is presented in color‑coded layout — white title, red stop, green targets, yellow risk‑reward — for instant readability. In addition, the system draws a red dashed stop‑loss reference line that remains visible for a specified number of candles after the signal, keeping the stop level continuously visible on the chart and reinforcing disciplined execution.
Buy Signal
  • Buy (Long): triggered when the three‑bar bullish reversal pattern is satisfied — the second‑to‑last candle is bearish, the last candle is a declining bearish candle, and the current candle is bullish with its high breaking above the high of the second‑to‑last candle — and the signal cooldown condition is met. After the signal triggers, a royal‑blue upward arrow and the text "Buy" are displayed below the candle, together with the complete long trading‑plan panel (Stop / T1 / T2 / RR). This signal represents a bottom‑reversal structure in which the bulls forcefully recapture lost ground after consecutive bearish pressure, a high‑confidence long entry in pattern terms.
Sell Signal
  • Sell (Short): triggered when the three‑bar bearish reversal pattern is satisfied — the second‑to‑last candle is bullish, the last candle is a rising bullish candle, and the current candle is bearish with its low breaking below the low of the second‑to‑last candle — and the signal cooldown condition is met. After the signal triggers, an orange downward arrow and the text "Sell" are displayed above the candle, together with the complete short trading‑plan panel (Stop / T1 / T2 / RR). This signal represents a top‑reversal structure in which the bears forcefully seize control after consecutive bullish advance, a high‑confidence short entry in pattern terms.
Practical Application
In day‑to‑day reversal trading, the core value of this indicator lies in "pattern equals signal, signal equals plan." The three‑bar reversal pattern already embeds the dual confirmation of "trend exhaustion plus counter‑breakout," so its signal quality exceeds that of single‑candle patterns. It is recommended to enforce the Stop price in the trading‑plan panel strictly as a hard stop, to use T1 as the first partial‑exit target (locking in part of the profit), and T2 as the second partial‑exit or full‑exit target (locking in a larger profit). The RR value can serve as an auxiliary filter for signal quality: when RR is high, the signal location has ample room to the structural extreme and is worth active participation; when RR is low, consider reducing position size or skipping the signal.
The red dashed stop‑loss reference line stays visible for several candles after the signal; its core purpose is to reinforce the visual reminder and prevent traders from arbitrarily moving the stop due to emotional swings while in a position. It is recommended to set the dashed‑line price as the actual stop order in the trading terminal, achieving "what you see is what you set" disciplined execution. Although the EMA50/EMA200 trend cloud does not filter signals, it can serve as an important reference for subjective screening: under an Up Trend state, Buy reversal signals carry a stronger trend‑following attribute and may be given higher weight; under a Down Trend state, Sell reversal signals are analogous. Conversely, counter‑trend reversal signals can be used as short‑term bounce/pullback captures, but with reduced position size and strictly enforced stops. The trend‑state label on the right side of the chart helps traders quickly judge which direction of signals to focus on.
Parameter Settings
Core algorithm parameters: Signal cooldown controls the number of cooldown candles after a signal triggers, effectively preventing consecutive duplicate signals in dense ranging zones and preserving signal scarcity and practical value, default 10. Plan line bars controls how long the red dashed stop‑loss reference line remains visible after the signal, default 5; a larger value keeps the stop line visible longer, suiting traders with longer holding periods. Max lookback bars controls the maximum number of historical candles for signal marking and plan panels, balancing chart tidiness and backtesting needs, default 2000.
Alert settings: Alert on bar close is enabled by default and strongly recommended to keep enabled, triggering alerts only after a candle closes and the pattern is confirmed, to avoid false‑pattern signals caused by intrabar price fluctuation. Popup and sound are enabled by default, while push and email are disabled by default; traders can adjust flexibly according to their screen‑watching habits and customize the sound file.
Per‑signal alert switches: the system lets you independently enable or disable alerts for Buy and Sell signals, both enabled by default, so you can receive only the signals relevant to your current strategy direction and filter out unnecessary noise.
Usage Recommendations
This indicator suits mainstream instruments such as forex, precious metals, indices, and cryptocurrencies, and is fully compatible with the MT4 and MT5 terminals. It is recommended to use it on H1 and higher timeframes, where the three‑bar reversal pattern is more stable than on lower timeframes, with fewer false patterns and more reasonable stop and target distances in the trading plan. Because the reversal pattern itself requires three candles to confirm, the signal frequency is moderate, and each signal represents a complete "exhaustion‑breakout" structure, suiting traders who pursue pattern‑based disciplined trading.
It is recommended to combine the reversal signals of this indicator with the medium‑term trend background provided by the EMA trend cloud, implementing a "trend sets the weight, pattern finds the entry" cooperative strategy. For example, in a bullish trend where the EMA50 is above the EMA200, focus on Buy reversal signals as trend‑following pullback entries; in a bearish trend, focus on Sell reversal signals. Counter‑trend reversal signals can be used as short‑term reversal plays, but you must set the stop strictly according to the Stop price in the plan panel. The RR value should serve as an important signal filter: prioritize signals with higher RR and skip those with too low RR. No indicator can guarantee a 100% win rate; please always set the stop strictly according to the Stop price in the plan panel, and treat this indicator as a decision‑support and discipline‑execution tool rather than the sole basis.
Summary
Auto Trading Plan Generator PRO perfectly fuses three modules — classic three‑bar reversal pattern recognition, EMA50/EMA200 trend‑cloud background monitoring, and structured trading‑plan generation — into a practical "pattern triggers, plan first" reversal trading system. It is not only a main‑chart tool with clear pattern signals and an at‑a‑glance trend background, but also a disciplined execution system where signal equals plan — every reversal signal comes with a precise dynamic stop, dual take‑profits, and a structure‑based risk‑reward ratio, and continuously reinforces stop discipline through the red dashed stop‑loss reference line, enabling traders to achieve full‑process discipline from pattern recognition to position management. It suits traders pursuing pattern‑based, low‑subjectivity, strict‑discipline approaches, precisely capturing top and bottom reversal turning points while strictly controlling the risk exposure of every trade through a structured plan.


추천 제품
Fabii Half Trend Baseline
Fabien Georges Andre Guillemaud
상위 시간대 추세에 맞서는 거래를 멈추세요. 기준선 두 개, 차트 하나. 리페인트 없음. 모든 통화쌍, 모든 시간대. 2분 안에 차트에 적용. Strategy Tester에서 무료 데모를 사용해 볼 수 있습니다. Get more indicators here Baselines, volatility filters and oscillators. No repaint. 필요한 이유 차트의 선이 초록색으로 바뀌어서 진입합니다. 그런 다음 상위 시간대를 열어 보니 더 큰 추세는 반대 방향입니다. 신호는 진짜였습니다. 하지만 그 뒤의 추세는 당신 편이 아니었습니다. 더 큰 추세에 맞서는 거래는 그때마다 진입의 우위를 깎습니다. 제공하는 것 Fabii Half Trend Baseline은 현재 시간대의 추세와 상위 시간대의 추세를 한 차트에 보여 주므로, 창을 바꿔 가며 큰 그림을 확인할 필요가 없습니다. 상위 시간대의 두 번째 기준선이 메인 선 뒤에 그려져서, 다른 차트를 열지 않고도 더 큰
RBreaker
Zhong Long Wu
RBreaker Gold Indicators는 금 선물을 위한 단기 데이 트레이딩 전략으로, 추세 추종과 데이 내 반전의 두 가지 거래 방식을 결합합니다. 추세 장에서 수익을 포착할 수 있을 뿐만 아니라, 시장이 반전될 때 적시에 이익을 확정하고 추세에 맞춰 반대 포지션을 잡을 수 있습니다. 이 전략은 미국 잡지 Futures Truth에서 15년 연속으로 가장 수익성 높은 트레이딩 전략 상위 10위 안에 선정되었습니다. 긴 라이프사이클을 자랑하며, 현재까지 국내외에서 널리 사용되고 연구되고 있습니다. 본 지표는 2026년 금 선물의 움직임을 반영하여 14일 ATR 지표를 기반으로 돌파 계수 A, 관찰 계수 B, 반전 계수 R을 보다 합리적인 값으로 정의했습니다. 매우 훌륭한 지표이며, 안정적인 연간 수익성을 달성했습니다. 강력히 추천합니다~ 위 지표는 변동성이 높은 상품에 적합하며, 매개변수는 금 선물, 주가 지수 선물 등에 적합합니다. 다른 상품이 필요한 경우 돌파 계수 A
Noize Absorption Index
Ekaterina Saltykova
Noize Absorption Index - is the manual trading system that measures the difference of pressure between bears forces and bulls forces. Green line - is a noize free index that showing curent situation. Zero value of index shows totally choppy/flat market.Values above zero level shows how powerfull bullish wave is and values below zero measures bearish forces.Up arrow appears on bearish market when it's ready to reverse, dn arrow appears on weak bullish market, as a result of reverse expectation.
Passband Filter Pro Passband Filter Pro is a trend and cycle oscillator for MetaTrader 5. It is built on the Ehlers Super Passband Filter, a band pass filter that removes long term trend drift and short term noise so that only the dominant market cycle remains. The result is a clean oscillator with a color cloud that shows overbought and oversold conditions, cycle turns, and momentum on forex, gold, indices, stocks and crypto. Most traders enter too early or too late. Simple moving averages la
CosmiCLab FIBO
Kirils Subins
CosmiCLab SMC FIBO CosmiCLab SMC FIBO is a professional trading indicator designed for traders who use Smart Money Concepts (SMC), market structure analysis and Fibonacci retracement levels. The indicator automatically detects market swings and builds Fibonacci levels based on the latest impulse movement. It also identifies market structure changes such as BOS (Break of Structure) and CHOCH (Change of Character), helping traders understand the current market direction. CosmiCLab SMC FIBO also pr
DAILY OH/OL SDEV QUANT MODEL - STATISTICAL TRADING WITH PRECISION RISK MANAGEMENT TRADE WITH MATHEMATICAL CERTAINTY - KNOW YOUR EXACT STOP-LOSS AND TAKE-PROFIT BEFORE YOU ENTER This indicator analyzes 5,000+ days of price history to give you: Exact entry levels (sigma bands locked at daily open) Exact stop-loss distance (from M
Premium level Pro
Dmitriy Kashevich
Premium level is a unique indicator with more than 80% accuracy of correct predictions! This indicator has been tested for more than two months by the best Trading Specialists! The author's indicator you will not find anywhere else! From the screenshots you can see for yourself the accuracy of this tool! 1 is great for trading binary options with an expiration time of 1 candle. 2 works on all currency pairs, stocks, commodities, cryptocurrencies Instructions: As soon as the red arrow app
Supply demand arrows
Smaylle Rafael Coelho Mariano
The   "Supply Demand Arrows"   indicator for MetaTrader 5 (MT5) is a powerful trading tool designed to help traders identify critical supply and demand zones in the market. By visually marking these zones with arrows, the indicator enhances trading precision and decision-making. Key Features Identification of Supply and Demand Zones : The indicator effectively highlights key supply and demand zones on the price chart, allowing traders to see where significant buying or selling pressure exists. T
FREE
Maximum Trend Arrows OT MT5
Mulweli Valdaz Makulana
STRICTLY FOR BOOM INDEX ONLY!!!!! Here I bring the Maximum Trend Arrows OT1.0 MT5 indicator. This indicator is made up of a combination of different trend indicators for entries and exits, for entries an orange arrow will paint on the chart below the current market and a red flag for closing of trades and it produces buy arrows only. When the orange arrow appears, it will appear along with it's sound to notify you. The 1H timeframe is recommended, don't use it anywhere else than on the 1H timefr
Trend Master V2
Oratile Pitsoane
What Is Trend Master Pro? Trend Master Pro   is a professional-grade trend trading indicator built for MetaTrader 5. It was designed with one goal in mind — to keep you on the right side of the market at all times by combining three powerful technical tools into a single, clean, easy-to-read display directly on your price chart. Instead of cluttering your screen with multiple separate indicators, Trend Master Pro fuses an   EMA Ribbon trend filter , a   ZigZag swing point engine , and a   breako
This indicator is the same as the popular Heiken Ashi Smoothed. The Heikin Ashi indicator for MetaTrader 5 already exists, but it has two disadvantages: It paints the candles not accurate. It's not possible to change the candle width. See also Heikin Ashi in MQL5 Code Base . In this version there are no such disadvantages.
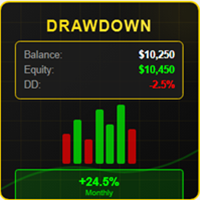
# DRAWDOWN INDICATOR V4.0 - The Essential Tool to Master Your Trading ## Transform Your Trading with a Complete Real-Time Performance Overview In the demanding world of Forex and CFD trading, **knowing your real-time performance** isn't a luxury—it's an **absolute necessity**. The **Drawdown Indicator V4.0** is much more than a simple indicator: it's your **professional dashboard** that gives you a clear, precise, and instant view of your trading account status. --- ## Why This Indicator
Auto-levels trading robot: key levels & risk manager Short Description: Automatically plots dynamic weekly support and resistance zones with real-time risk tracking. Full Description: Elevate your chart analysis with a dynamic tool designed to map the market structure effortlessly. This indicator automatically calculates and plots critical support and resistance levels based on weekly price action, updating every new week to align seamlessly with current market dynamics. By projecting precise pe
Smart Support And Resistance Indicator See the Market Levels That Matter. Make your chart clearer and your technical analysis more organized with Smart Support And Resistance Indicator — a powerful trading tool designed to help traders identify important support and resistance levels directly on their MetaTrader 5 charts. Whether you trade Forex, Gold, Indices, or other available markets, this indicator helps you focus on key price areas, monitor potential market reactions, and analyze price act
##   ONLY GOLD ##   Тiльки Золото ## **Mercaria Professional Trading Zones - Complete Guide** ## **Mercaria Professional Trading Zones - Повний посібник** ### **How Mercaria Zones Work / Як працюють зони Mercaria** **English:** Mercaria Zones is an advanced trading indicator that identifies high-probability support and resistance areas using ZigZag extremes combined with mathematical zone calculations. The indicator works on multiple timeframes simultaneously, providing a comprehensive view
Your Trend Friend
Luigi Nunes Labigalini
5 (1)
The trend is your friend! Look at the color of the indicator and trade on that direction. It does not  repaint. After each candle is closed, that's the color of the trend. You can focus on shorter faster trends or major trends, just test what's most suitable for the symbol and timeframe you trade. Simply change the "Length" parameter and the indicator will automatically adapt. You can also change the color, thickness and style of the lines. Download and give it a try! There are big movements w
## WPRV2 지표의 상세 설명 WPRV2는 전통적인 기술 분석 도구인 윌리엄스 퍼센트레인지(%R)를 개량한 버전입니다. 주식 시장이나 외환시장, 암호화폐 거래소 등 금융 시장에서 사용되며, 시장 동향을 분석하고 최적의 매매 타이밍을 결정하는데 도움이 됩니다. ### 지표의 목적 WPRV2 지표의 주요 목적은 현재 가격이 최근 고점과 저점에 비해 얼마나 가까운지 측정하는 것입니다. 이를 통해 트레이더들은 다음 사항을 파악할 수 있습니다. - 현재 가격이 역사적으로 높은 수준에 가까운가? - 혹은 역사적으로 낮은 수준에 접어드는 중인가? 이 정보를 통해 시장 변동성이나 현재 추세의 연속성을 신속하게 파악하여 올바른 판단을 내릴 수 있습니다. ### WPRV2 지표의 특징 #### 1. 그래픽 표현 방법 WPRV2 지표는 메인 자산 차트와 별도로 나타나며, 다음 두 줄로 구성됩니다. - 메인 라인(`WPR`) : 지정된 기간 동안 %R 값의 변화를 보여줍니다. - 추가적인
Heiken_Ashi_Bars - MT5용 고급 추세 시각화 도구 개요 Heiken_Ashi_Bars 는 시장의 노이즈를 필터링하고 진정한 기본 추세를 강조하도록 설계된 강력하고 시각적으로 직관적인 사용자 지정 지표입니다. 기존의 캔들스틱 차트는 불규칙하여 거짓 신호와 섣불린 청산을 유발할 수 있습니다. 이 지표는 가격 데이터를 평균화하여 가격 움직임을 부드럽게 만들어 추세 지속, 반전 및 수익성 있는 진입 구간을 훨씬 쉽게 파악할 수 있도록 해줍니다. 주요 기능 및 장점 강력한 노이즈 감소: 사소한 가격 급등 및 횡보 노이즈를 필터링합니다. 명확한 시각적 신호: 색상으로 구분된 막대를 통해 강세 및 약세 모멘텀을 한눈에 파악할 수 있습니다. 리페인트 없음 (No Repaint): 막대가 마감되면 신호가 고정됩니다. 과거 막대를 다시 계산하지 않습니다. 고도로 최적화됨: 터미널 지연이 없도록 깔끔하게 코딩되었습니다. 다양한 활용: 모든 금융 상품(외환, 지수, 금속, 암호화폐)에서
TRI Visualizer
Yoshimi Mon 三 Ura
TRI Visualizer MT5 – Thermodynamic Market Analysis Overview The TRI (Thermal Range Indicator) Visualizer Enhanced is a rare market analysis indicator that goes beyond conventional technical analysis, applying principles of thermodynamics from physics. It interprets market price fluctuations as “thermodynamic energy,” enabling the highly accurate detection of subtle market changes that are often overlooked. Innovative Mechanisms 1. Dual Calculation Engines Classic TRI Mode Formula: |Close
Confluence Meter: 26개 지표를 하나의 종합 레이팅으로 Confluence Meter 는 인기 있는 26개 지표의 신호를 계산해 "매도 / 중립 / 매수"라는 간단한 레이팅으로 종합해 줍니다. 수십 개의 창을 열어 수치를 직접 비교할 필요가 없습니다. 패널을 한 번만 보면 선택한 시간대에서 시장이 어느 쪽으로 기울어 있는지 알 수 있습니다. MT4-version:  https://www.mql5.com/en/market/product/199466 Our products: https://www.mql5.com/en/users/trendhunter/seller 차트에 표시되는 내용 Oscillators 게이지. 11개 오실레이터의 레이팅입니다. RSI, Stochastic, CCI, ADX, Awesome Oscillator, Momentum, MACD, Stochastic RSI, Williams %R, Bulls/Bears Power, Ultimate Oscillat
Dynasty SMC/ICT Terminal — v3.0 "Neon-Ops Edition" An all-in-one Smart Money Concepts / ICT dashboard for MetaTrader 5. It's an indicator, not an auto-trading EA — it never places, modifies, or closes real orders. It scans price action for Order Blocks, Fair Value Gaps, market structure, harmonic patterns, and multi-timeframe momentum, blends everything into one calibratable Master Signal, and — if enabled — builds a fully automated on-chart trade plan with entry, stop loss, three take-profit ta
Advanced Trading Chaos
Sergei Gurov
5 (1)
Advanced Trading Chaos  The main purpose of the indicator is to help the trader detect the signals described by Bill Williams in his books to make a quick and correct trading decision. 1)Bullish/Bearish Reversal Bar(BDB) 2) Divergent Bar(DB) 3) Second Sage Signal — the third consecutive Awesome Oscillator bar  4) Working fractals (Fractals that worked above/below the red forehead  5) Three bar coloring modes 5.1) Coloring of bars according to the AO indicator (Including the squatting bar) 5.2
Matrix Gann Pro
Asaad Mahdi Hadi Almayyahi
Matrix Gann Pro is a research and visualization indicator for MetaTrader 5 that combines Gann price analysis, time cycles, planetary calculations, cosmogram tools and historical validation in one workspace. The product is designed for traders who study price geometry, market timing, Gann methods and astronomical market cycles. All main tools are available directly inside MetaTrader 5 and can be applied to the current chart. OVERVIEW Matrix Gann Pro contains several integrated analysis module
LT Rainbow Trend
Thiago Duarte
5 (1)
== LT RAINBOW TREND - 36개의 이동평균선을 탑재한 추세 지표 == 개요 LT Rainbow Trend는 스마트 컬러 시스템(Rainbow)을 적용하여 36개의 이동평균선(Moving Averages)을 동시에 처리하는 고급 기술적 추세 분석 지표입니다. 최고의 시각적 명확성을 바탕으로 주 추세 방향으로 거래하고자 하는 트레이더를 위해 개발되었으며, 멀티 타임프레임 분석의 복잡함을 심플하고 다채로우며 매우 직관적인 시각 효과로 전환해 줍니다. "추세는 당신의 친구(The trend is your friend)"라는 격언을 이해하는 트레이더에게 가장 이상적인 도구이며, 추세의 강도, 방향 및 잠재적 반전 신호를 미리 확인할 수 있도록 도와줍니다. 작동 원리 본 지표는 4개의 추세 구역에 분산된 36개의 이동평균선을 모니터링합니다: 빨간색 (추세 전환 구역) 31~20번째 이동평균선 추세가 반전될 수 있음을 나타내는 강한 신호 주황색 (추세 약화 구역)
Be notified of every color change of Heiken Ashi (HA) candles. The indicator will trigger past and new signals every time that HA candles change their colors. ( Note : this tool is based on the code of Heiken Ashi indicator developed by MetaQuotes Software Corp.) Features The signals are triggered at closing of last bar/opening of a new bar; Any kind of alerts can be enabled: Dialog Box, Email message, SMS notifications for smartphones and tablets, and Sound alerts; By default, up arrows are pl
This indicator is used to compare the relative strength of the trade on the chart against the other several selected symbols. By comparing the price movement of each traded variety based on the same base day, several trend lines of different directions can be seen, reflecting the strong and weak relationship between the several different traded varieties, so that we can have a clearer understanding of the market trend. For example, you can apply this indicator on a EurUSD chart and compare it w
US30NinjaMT5
Satyaseelan Shankarananda Moodley
US30 Ninja is a 5 minute scalping indicator that will let know you when there is a trade set up (buy or sell). Once the indicator gives the trade direction, you can open a trade and use a 30 pip stop loss and a 30 pip to 50 pip take profit. Please trade at own own risk. This indicator has been created solely for the US30 market and may not yield positive results on any other pair. 
Has rsi signal
Evgenii Savinov
HAS RSI Signal — SL/TP 자동 계산 기능이 포함된 전문 트렌드 지표 HAS RSI Signal 은 검증된 클래식 지표와 현대적인 노이즈 필터링 알고리즘을 결합한 강력한 트레이딩 도구입니다. 이 지표는 Heiken Ashi Smoothed (HAS) 캔들과 RSI 오실레이터를 통해 시장을 분석하며, 추세 반전이나 과매수/과매도 구간 이탈 시 트레이더에게 명확한 진입 신호를 제공합니다. 주요 장점: 이중 필터링: Heiken Ashi Smoothed를 사용하여 시장의 '노이즈'를 제거하고, RSI를 통해 모멘텀의 강도를 확인합니다. 자동 레벨 계산: 단순히 신호만 주는 것이 아니라, 변동성( ATR )을 기반으로 최적의 손절매(Stop Loss) 및 이익 실현(Take Profit) 레벨을 자동으로 계산합니다. 시각적 편의성: 신호가 차트 위에 컬러 캔들 형태로 직접 표시되어 복잡하지 않고 직관적으로 추세를 파악할 수 있습니다. 알림 시스템: 터미널 알람, 사운드, 스마
HMA Trend Professional MT5
Pavel Zamoshnikov
4.25 (4)
Improved version of the free HMA Trend indicator (for MetaTrader 4) with statistical analysis. HMA Trend is a trend indicator based on the Hull Moving Average (HMA) with two periods. HMA with a slow period identifies the trend, while HMA with a fast period determines the short-term movements and signals in the trend direction. The main differences from the free version: Ability to predict the probability of a trend reversal using analysis of history data. Plotting statistical charts for analyzi
Blahtech Market Profile MT5
Blahtech Limited
5 (10)
Was: $249  Now: $99   Market Profile defines a number of day types that can help the trader to determine market behaviour. A key feature is the Value Area, representing the range of price action where 70% of trading took place. Understanding the Value Area can give traders valuable insight into market direction and establish the higher odds trade. It is an excellent addition to any system you may be using. Inspired by Jim Dalton’s book “Mind Over Markets”, this indicator is designed to suit the
이 제품의 구매자들이 또한 구매함
Trend Sniper X
Sarvarbek Abduvoxobov
4.86 (43)
Trend Sniper X 는 트레이더가 추세 방향과 잠재적 반전 지점을 명확하고 정확하게 포착할 수 있도록 도와주는 MetaTrader 5용 멀티 타임프레임 추세 추종 지표입니다. MT4용: https://www.mql5.com/en/market/product/193245 가격 정보: 현재 가격은 프로모션 할인가이며, 향후 업데이트 및 새로운 기능이 출시됨에 따라 변동될 수 있습니다. 보너스 혜택: 본 지표 전용 무료 자동매매 Assistant EA를 받으시려면 구매 후 작성자에게 메시지를 보내주시기 바랍니다. Code2Profit 채널 멀티 타임프레임 분석으로 시장을 마스터하세요! Trend Sniper X로 승률을 극대화하는 방법: 핵심 규칙 및 세션 팁 기술 사양 플랫폼 MetaTrader 5 지표 유형 멀티 타임프레임 추세 지표 운용 타임프레임 모든 차트 타임프레임 지원, 독립적으로 선택 가능한 상위 타임프레임(M1–MN1) 주요 상품 외환, 금(XAUUSD) 및 기타 C
Entry Points Pro for MT5
Yury Orlov
4.52 (152)
Entry Points Pro는 주문을 넣기 전에 어디에서 진입하고, 스탑을 어디에 두고, 어떤 랏으로 거래할지 보여 줍니다. 화살표는 캔들이 마감될 때 나타나며 리페인팅되지 않습니다. 설정은 두 가지: 예치금과 거래당 리스크. 결제 전에 확인하세요: 무료 데모는 MT5 전략 테스터에서 작동하며 2분이면 됩니다. 구매 후에는 제가 직접 설정을 도와 드리겠습니다. 2019년, 저는 이 지표가 무엇을 할 수 있는지 전 세계에 보여 주었습니다. 실계좌에서 지표의 시그널에 따라 수동으로, 모두가 볼 수 있게 공개적으로 거래했습니다 — 계좌는 Myfxbook에서 모니터링되었고, 저는 이 실험을 Facebook에 자세히 공유했습니다. 결과: 4개월 만에 10,000달러가 941,411달러가 되었습니다. 리스크는 의도적으로 극단적이었습니다 — 드로다운은 54%까지 이르렀습니다. 우리 직업에서 수익과 리스크는 언제나 함께 가기 때문입니다. Myfxbook 스크린샷은 갤러리의 첫 번째 이미지입니다.
Ultra Indicator
Ihor Otkydach
5 (1)
ULTRA는 “올인원” 방식으로 작동하는 기술적 지표로, 시장을 독자적으로 분석하고, 매매 신호를 생성하며, 손절매 주문 설정 수준을 표시하고, 이익을 실현하거나 손실을 최소화하기 위해 포지션을 청산해야 할 시점을 제안합니다. 다시 말해, 시장을 분석하는 법을 모르거나, 가격 수준(손절매를 어디에 설정할지)을 파악하지 못하거나, 자금 관리에 어려움을 겪더라도 상관없습니다. ULTRA가 그 모든 것을 대신 해줄 테니까요! 구매자 특전 : ULTRA 지표를 구매하신 후, 저에게 비공개 메시지를 보내주시면 “ULTRA BOT”을 무료 선물로 드립니다. 이 도구는 해당 지표의 신호를 바탕으로 개설한 거래를 관리하는 데 도움을 주는 특별한 도구입니다(각 거래에 대해 손절매를 설정하고, 최상의 결과를 얻을 수 있도록 전략의 규칙에 따라 거래를 자동으로 청산해 줍니다).  또한 구매자분들께 다양한 자산에 바로 적용할 수 있는 설정값을 제공해 드리고 있으며, 이를 통해 지표가 최대 효율로 작동할
Gann Made Easy MT5
Oleg Rodin
5 (13)
Gann Made Easy 는 mr.의 이론을 사용하여 최고의 거래 원칙을 기반으로 하는 전문적이고 사용하기 쉬운 Forex 거래 시스템입니다. W.D. 간. 이 표시기는 Stop Loss 및 Take Profit Levels를 포함하여 정확한 BUY 및 SELL 신호를 제공합니다. PUSH 알림을 사용하여 이동 중에도 거래할 수 있습니다. 구매 후 거래 방법 안내 및 유용한 추가 지표를 무료로 받으시려면 저에게 연락주세요! 아마도 Gann 거래 방법에 대해 이미 여러 번 들었을 것입니다. 일반적으로 Gann의 이론은 초보자 거래자뿐만 아니라 이미 거래 경험이 있는 사람들에게도 매우 복잡한 것입니다. Gann의 거래 방식은 이론적으로 적용하기 쉽지 않기 때문입니다. 나는 그 지식을 연마하고 Forex 지표에 최고의 원칙을 적용하기 위해 몇 년을 보냈습니다. 표시기는 적용하기가 매우 쉽습니다. 차트에 첨부하고 간단한 거래 권장 사항을 따르기만 하면 됩니다. 지표는 지속적으로 시장 분석
M1 Sniper MT5
Oleg Rodin
5 (7)
M1 SNIPER 는 사용하기 쉬운 거래 지표 시스템입니다. M1 시간대에 맞춰 설계된 화살표 지표입니다. 이 지표는 M1 시간대 스캘핑을 위한 단독 시스템으로 사용할 수 있으며, 기존 거래 시스템의 일부로도 사용할 수 있습니다. 이 거래 시스템은 M1 시간대 거래용으로 특별히 설계되었지만, 다른 시간대에도 사용할 수 있습니다. 원래는 XAUUSD와 BTCUSD 거래를 위해 이 방법을 설계했지만, 다른 시장 거래에도 유용하다는 것을 알게 되었습니다. 이 지표의 신호는 추세 방향과 반대로 거래될 수 있습니다. 저는 지표의 신호를 활용하여 양방향으로 거래할 수 있도록 돕는 특별한 거래 기법을 알려드립니다. 이 방법은 특별한 동적 지지선과 저항선 가격 영역을 활용하는 것을 기반으로 합니다. 구매하시면 M1 SNIPER 화살표 지표를 바로 다운로드하실 수 있습니다. 또한, 아래 스크린샷에 표시된 Apollo Dynamic SR 지표는 M1 SNIPER 도구를 사용하는 모든 사용자에게 무료로
Adaptive Price Action Engine 지표를 구매하면 EA(자동매매 프로그램)가 무료 멀티 타임프레임 기반 자기 최적화 추세 & 캔들 패턴 분석 시스템 시장은 끊임없이 변화하며, 모든 Price Action 패턴이 모든 시장 환경에서 동일한 가치를 가지는 것은 아닙니다. Adaptive Price Action Engine 은 변화하는 시장 환경에 적응할 수 있도록 설계되었으며, 추세 구조, 멀티 타임프레임 분석, 캔들 패턴 및 통계적 최적화 를 하나의 분석 프레임워크로 결합합니다. 두 가지 적응형 모드 Dual Alpha Trend Mode 낮은 타임프레임과 높은 타임프레임에서 적합한 Alpha Trend 파라미터를 자동으로 탐색하여, 최근 시장 움직임에 맞춰 추세 분석을 조정합니다. Candlestick + Alpha Mode Alpha Trend를 통한 시장 국면 분석과 22개의 상승 및 하락 캔들 패턴 을 결합합니다. 모든 패턴을 동일하게 취급하는 대신, 다양
Auto Optimized SpeedAngle 은 지속적인 워크포워드 최적화(Walk-Forward Optimization, WFO)를 통해 곡선 적합(curve-fitting)을 제거한 기관 수준의 모멘텀 벡터화 시스템입니다. 시장 체제가 바뀔 때 성능이 떨어지는 정적 입력에 의존하는 대신, 이 지표는 표본 외(Out-of-Sample, OOS) 검증을 사용하여 매개변수를 동적으로 재보정하며, 표시되는 신호가 과거의 우연이 아닌 진정한 통계적 우위를 나타내도록 보장합니다. 핵심 기관용 프레임워크 워크포워드 최적화 엔진: 핵심 알고리즘은 수천 가지의 룩백(lookback) 및 임계값 조합을 지속적으로 스캔하며, 데이터를 인샘플(in-sample)과 표본 외(out-of-sample) 세트로 엄격하게 분리합니다. 미지의 데이터 환경에서 수학적 우수성이 증명된 경우에만 새로운 매개변수 구성을 채택합니다. 정량적 목적 함수: 순수한 총이익을 쫓는 대신, 최적화 엔진은 기관 수준의 안정성
Boba Analysis Suite
Trade Ready Solutions LLC
5 (2)
Boba Analysis Suite Boba Analysis Suite는 MetaTrader 5용 분석 지표입니다. 시장 구조, 주요 가격 영역, 전반적인 시장 상황을 하나의 차트 화면에 통합하여 표시합니다. 트레이더이자 트레이딩 코치로서의 실무 경험을 바탕으로 개발되었으며, 시장 방향 평가, 주요 가격 수준 식별, 여러 시간대의 종합적인 분석 등 체계적인 분석 과정을 지원합니다. 시장 맥락을 고려한 분석 개별 신호의 의미는 시장 상황에 따라 달라집니다. Boba Analysis Suite는 현재 차트 상황을 더 넓은 시장 구조와 연결하고, 사전에 정한 규칙에 따라 매매 아이디어를 검토할 수 있도록 돕습니다. 주요 분석 기능은 다음과 같습니다. 추세 및 시장 구조: 시장 방향과 관련 구조적 맥락을 평가합니다. 주요 가격 영역 및 수준: 추가 분석이 필요한 중요한 영역을 차트에 시각적으로 표시합니다. 여러 시간대: 서로 다른 시간대의 정보를 통합하여 전반적인 시장 상황을 평가합니다.
ScalpPoint
Temirlan Kdyrkhan
ScalpPoint is a powerful trading companion designed to generate high-probability entry signals with dynamic TP/SL/DP levels based on volatility. Built-in performance tracking shows win/loss stats, PP1/PP2 hits, and success rates — all updated live. Key Features: Buy/Sell signals with adaptive volatility bands Real-time TP/SL/DP levels based on ATR Built-in MA Filter with optional ATR/StdDev volatility Performance stats panel (Success, Profit/Loss, PP1/PP2) Alerts via popup, sound, push, or emai
ARICoins
Temirlan Kdyrkhan
ARICoin is a powerful trading companion designed to generate high-probability entry signals with dynamic TP/SL/DP levels based on volatility. Built-in performance tracking shows win/loss stats, PP1/PP2 hits, and success rates all updated live. Key Features: Buy/Sell signals with adaptive volatility bands Real-time TP/SL/DP levels based on ATR Built-in MA Filter with optional ATR/StdDev volatility Performance stats panel (Success, Profit/Loss, PP1/PP2) Alerts via popup, sound, push, or email Cust
Scalper Vault MT5
Oleg Rodin
5 (1)
Scalper Vault는 당일 매매(intraday trading)에서 일관된 성과를 내고자 하는 트레이더를 위해 설계된, 강력하고 모든 기능을 갖춘 트레이딩 시스템입니다. 이 고정밀 지표는 외환(Forex) 및 바이너리 옵션 트레이더 모두에게 기관급 분석을 제공하는 독립적인 종합 트레이딩 시스템 역할을 합니다. 구매 후 저에게 연락해 주시면, 트레이딩 팁과 함께 특별한 보너스를 제공해 드립니다! Scalper Vault는 추측에 의존하거나 복잡한 수동 분석을 할 필요를 없애주며, 사용하기 쉬운 트레이딩 기법을 통해 오직 매매 실행에만 집중할 수 있도록 돕습니다. 정확한 추세 추종 신호: 핵심 알고리즘이 시장 구조를 분석하여, 지배적인 시장 추세 방향과 일치하는 고확률 신호만을 제공함으로써 잘못된 진입을 획기적으로 줄여줍니다. 정밀한 고점 및 저점 탐지: 시장의 움직임이 소진되는 지점을 스캔하여 잠재적인 반전 구간을 식별합니다. 간(Gann) 이론 기반의 매수/매도 구간: 수학적
Azimuth Pro
Ottaviano De Cicco
5 (7)
Azimuth Pro V2: Synthetic Fractal Structure and Confirmed Entries for MT5 Overview Azimuth Pro is a multi-level swing structure indicator by Merkava Labs . Four nested swing layers, swing-anchored VWAP, ABC pattern detection, three-timeframe structural filtering, and closed-bar confirmed entries — one chart, one workflow from micro-swings to macro-cycles. This is not a blind signal product. It is a structure-first workflow for traders who care about location, context, and timing. Halloween P
Volatility Master for MetaTrader is a real-time dashboard tool that scans up to  50 symbols  to identify high-volatility , trending markets instantly. With bullish/bearish signals, customizable alerts, and a user-friendly interface, it helps you avoid range-bound conditions and focus on high-probability trades. Clarity leads to confidence. Trade confidently and protect your capital effectively with this powerful dashboard. We don't offer free or bonus indicators in exchange of reviews from you.
Apex Patterns PRO 인디케이터 구매 시 - 기반 Expert Advisor 무료 제공. 자체 최적화 차트 패턴 및 브레이크아웃 분석 시스템 기존의 패턴 스캐너는 고정된 파라미터에 의존하므로 시장 변동성과 구조가 변화할 때 성능이 저하되는 경우가 많습니다. Apex Patterns PRO는 구조적 차트 패턴 인식, 모멘텀 필터링, 통계적 자체 최적화를 하나의 분석 프레임워크로 결합하여 변화하는 시장 환경에 적응하도록 설계되었습니다. 적응형 스캐닝 엔진 자체 최적화 패턴 모드 최근 과거 데이터를 바탕으로 적절한 패턴 파라미터를 자동으로 탐색하여, 정적인 설정 대신 현재 시장 행보에 맞춰 인디케이터의 구조 감지 방식을 적응시킵니다. 스마트 브레이크아웃 필터링 클래식 패턴 인식과 모멘텀, 거래량, 프라이스 액션 지표를 결합합니다. 모든 브레이크아웃을 동일하게 다루는 대신, 시장의 기저 구조를 평가하여 현재 통계적 환경에 부합하는 셋업을 식별합니다. 주요 기능 리페인트 없는 고
Neuro Poseidon MT5
Daria Rezueva
4.68 (53)
Neuro Poseidon is a new indicator by Daria Rezueva. It combines precise trading signals with adaptive TP/SL levels - creating best possible trades as a result! Message me and get  Neuro Poseidon Assistant  as a gift to automize your trading process! What makes it stand out? 1. Proven profitability on all assets and timeframes 2. Only confirmed BUY and SELL signals present on the chart 3. Adaptive TP & SL levels generated by the software for each trade 4. Easy to understand - suitable for al
SIO Oscillator
Davit Beridze
SIO Oscillator: 자기 최적화 세미분산 불균형 오실레이터 지표를 구매하시면 이를 기반으로 한 전문가 어드바이저(EA)를 무료로 받으실 수 있습니다. 대부분의 오실레이터는 모든 가격 움직임을 똑같이 취급합니다. SIO는 상승 압력과 하락 압력을 분리하여 둘 사이의 불균형을 측정하고, 매수자와 매도자 중 어느 쪽이 실제로 시장을 주도하고 있는지 보여줍니다. 불균형이 극단에 도달하면 SIO는 진입가, 손절(Stop Loss), 익절(Take Profit) 수준이 포함된 명확한 신호를 표시합니다. SIO의 차별점은 고정된 설정에 의존하지 않는다는 것입니다. 내장된 자기 최적화 엔진이 현재 종목과 시간 프레임에 맞는 파라미터를 지속적으로 탐색하고, 사용하기 전에 검증합니다. 두 가지 신호 모드 평균 회귀(Mean Reversion): 불균형의 극단에서 거래하며 균형으로의 복귀를 노립니다. 추세 추종(Trend Following): 지속적이고 우세한 불균형의 방향으로 거래합니다. 자
통화 강도 마법사는 성공적인 거래를 위한 올인원 솔루션을 제공하는 매우 강력한 지표입니다. 표시기는 여러 시간 프레임의 모든 통화 데이터를 사용하여 이 또는 해당 외환 쌍의 힘을 계산합니다. 이 데이터는 특정 통화의 힘을 확인하는 데 사용할 수 있는 사용하기 쉬운 통화 지수 및 통화 전력선의 형태로 표시됩니다. 필요한 것은 거래하려는 차트에 표시기를 부착하는 것뿐입니다. 표시기는 거래하는 통화의 실제 강세를 보여줍니다. 지표는 또한 추세와 거래할 때 유리하게 사용할 수 있는 구매 및 판매 거래량 압력의 극한값을 보여줍니다. 지표는 또한 피보나치에 기반한 가능한 대상을 보여줍니다. 표시기는 PUSH 알림을 포함한 모든 유형의 알림을 제공합니다. 구매 후 연락주세요. 나는 당신과 거래 팁을 공유하고 당신에게 무료로 훌륭한 보너스 지표를 줄 것입니다! 나는 당신에게 행복하고 유익한 거래를 기원합니다!
AriFocus
Temirlan Kdyrkhan
AriFocus - Non-Repainting Buy/Sell Signals AriFocus - one clear signal. AriFocus marks buy and sell signals directly on the chart and suggests a stop-loss level for each one. Every signal is confirmed on bar close and never repaints. - Buy/sell arrows, confirmed on bar close - Suggested stop-loss level for every signal - Trend band and candle coloring to show direction at a glance - 10 ready-made presets, or your own settings (14 calculation methods) - Pop-up, push and email alerts with entr
Advance AI Scanner
Mohamed Samsudeen
5 (1)
Advance AI Scanner is a multi-symbol analysis indicator for MetaTrader 5. It scans Forex pairs, metals, energy, stock indices and cryptocurrencies at the same time and rates each instrument with its own self-training model. It explains in plain English what moved each market and why, and it estimates how far upcoming economic news usually moves each symbol, measured on your broker's own price history. $199 instead of $499. 10 copies left at this price. One time purchase  Installation and User
SkyHammer Signal Pro
Shengzu Zhong
5 (4)
SkyHammer Signal Pro Entry, SL, TP 레벨이 고정되는 전문 No-Repaint 추세 신호 인디케이터 SkyHammer Signal Pro는 명확하고 고정되며 검증 가능한 신호를 원하는 트레이더를 위해 설계된 구조적인 추세 및 모멘텀 신호 인디케이터입니다. 특히 M1 및 M5 같은 낮은 시간대에서 가장 효과적으로 작동합니다. 이 인디케이터는 시장의 고점이나 저점을 예측하려고 하지 않습니다. 대신 신호를 생성하기 전에 확인된 시장 구조, 추세 방향, 모멘텀 강도, 건강한 변동성, 그리고 목표까지의 충분한 공간을 기다립니다. 주요 기능 고정 신호 메커니즘 신호가 확인되면 화살표, Entry, Stop Loss, TP1, TP2 레벨이 차트에 영구적으로 고정됩니다. 이후 캔들 움직임 때문에 신호가 사라지거나, 이동하거나, 변경되지 않습니다. 이를 통해 트레이더는 각 신호를 명확하게 검토할 수 있으며, 실시간 시장에서 신호가 사라지는 일반적인 문제를 피할 수 있습니다
PZ Divergence Trading MT5
PZ TRADING SLU
3.71 (7)
Unlock hidden profits: accurate divergence trading for all markets Tricky to find and scarce in frequency, divergences are one of the most reliable trading scenarios. This indicator finds and scans for regular and hidden divergences automatically using your favourite oscillator. [ Installation Guide | Update Guide | Troubleshooting | FAQ | All Products  ] Easy to trade Finds regular and hidden divergences Supports many well known oscillators Implements trading signals based on breakouts Displays
Apollo SR Master는 지지/저항 구간에서의 거래를 더욱 쉽고 안정적으로 만들어 주는 특수 기능을 갖춘 지지/저항 지표입니다. 이 지표는 지역 가격의 고점과 저점을 감지하여 시간 지연 없이 실시간으로 지지/저항 구간을 계산합니다. 새롭게 형성된 저항 구간을 확인하기 위해 지표는 해당 저항 구간을 실제 매도 또는 매수 신호로 활용할 수 있음을 나타내는 특수 신호를 표시합니다. 이 경우, 저항 구간의 강도가 높아지고, 따라서 저항 구간에서의 성공적인 거래 가능성도 높아집니다. 이것이 바로 이 지표의 핵심 아이디어입니다. SR 존은 손절매와 이익실현을 더욱 쉽게 할 수 있도록 해줍니다. 신호 방향에 따라 SR 존 위 또는 아래 공간을 손절매로 활용할 수 있습니다. 또한, 반대쪽 SR 존은 잠재적 이익실현 영역으로 활용할 수 있습니다. 또한 Apollo SR Master 지표를 사용하는 모든 사용자에게 "Apollo Price Action System" 지표를 무료로 제공합니다.
Divergence Bomber
Ihor Otkydach
4.89 (94)
이 지표를 구매하신 분께는 다음과 같은 혜택이 무료로 제공됩니다: 각 거래를 자동으로 관리하고, 손절/익절 수준을 설정하며, 전략 규칙에 따라 거래를 종료하는 전용 도우미 툴 "Bomber Utility" 다양한 자산에 맞게 지표를 설정할 수 있는 셋업 파일(Set Files) "최소 위험", "균형 잡힌 위험", "관망 전략" 모드로 설정 가능한 Bomber Utility의 셋업 파일 이 전략을 빠르게 설치, 설정, 시작할 수 있도록 돕는 단계별 영상 매뉴얼 주의: 위의 모든 보너스를 받기 위해서는 MQL5 개인 메시지 시스템을 통해 판매자에게 연락해 주세요. 독창적인 커스텀 지표인 “Divergence Bomber(다이버전스 봄버)”를 소개합니다. 이 지표는 MACD 다이버전스(괴리) 전략을 기반으로 한 올인원(All-in-One) 거래 시스템입니다. 이 기술 지표의 주요 목적은 가격과 MACD 지표 간의 다이버전스를 감지하고, **향후 가격이 어느 방향으로 움직일지를 알려주
Dynamic Forex28 Navigator MT5
Bernhard Schweigert
5 (1)
다중 통화 강도 및 모멘텀 지표 MT5 Dynamic Forex28 Navigator는 오랫동안 사랑받아 온 저희 지표의 진화 버전으로, 세 가지 기능을 하나로 결합했습니다: Advanced Currency Strength28 Indicator (리뷰 700개) Advanced Currency IMPULSE with ALERT (리뷰 530개) CS28 Combo Signals (최근 보너스) 두 이전 지표는 MQL5 Market에서 합계 1,200개가 넘는 리뷰를 받았으며 2016년부터 MT4 커뮤니티의 필수품이었습니다. Dynamic Forex28 Navigator MT5는 검증된 동일한 로직을 그대로 이어갑니다. MetaTrader 5를 위해 완전히 다시 제작 – MT5의 네이티브 다중 심볼 아키텍처를 최대한 활용하도록 설계되었습니다. 사용 설명서: https://www.mql5.com/en/blogs/post/758844 MT4 버전을 찾고 계신가요? 여기를 클릭하세요: ht
Superhero
Ihor Otkydach
5 (3)
SUPERHERO 지표는 “올인원” 방식으로 설계된 다중 통화 거래 시스템입니다. 이 지표는 시장을 독자적으로 분석하여 포지션을 개설하고 청산할 시점에 대한 신호를 제공합니다. 손절매(Stop Loss) 및 익절(Take Profit) 주문을 활용하며, 위험 대비 수익 비율(R:R)은 1:1입니다. 이 시스템은 스마트폰으로 푸시 알림을 전송할 수 있으므로, PC에 묶여 있을 필요 없이 “이동 중에도” 매매를 할 수 있습니다. 이는 자체 거래 전문 회사에 안성맞춤입니다. 모든 고객님께 드리는 특별 혜택: 이 지표를 구매하시는 모든 분께는 제가 특별히 준비한 유틸리티를 선물로 드릴 예정이며, 이 유틸리티는 다음과 같은 기능을 제공합니다: 손절매 및 익절 주문을 자동으로 설정합니다 가격이 목표 수준에 도달하면 자동으로 포지션을 청산합니다 미결제 주문 거래를 지원합니다 평균화 거래 모드를 지원합니다 이 훌륭하고 매우 편리한 유틸리티를 선물로 받고 싶으시다면, SUPERHERO 지표를 구매하
Trend Lines PRO MT5
Roman Podpora
5 (1)
트렌드 라인즈 프로       이 지표는 시장이 실제로 어떤 방향으로 전환되는지 파악하는 데 도움이 됩니다. 실제 추세 반전 지점과 주요 시장 참여자들이 다시 진입하는 지점을 보여줍니다. 보시다시피       BOS 라인       복잡한 설정이나 불필요한 노이즈 없이 더 높은 시간대의 추세 변화와 주요 레벨을 확인할 수 있습니다. 신호는 차트에 다시 그려지지 않고 캔들이 마감된 후에도 계속 표시됩니다. VERSION MT 4   -   RFI LEVELS PRO   표시기   와 결합할 때 최대 잠재력을 발휘합니다. 지표가 보여주는 내용: 실제 변화       추세(BOS 라인) 한 번 신호가 나타나면 그 신호는 계속 유효합니다! 이는 신호를 발생시킨 후 변경될 수 있는 리페인팅 방식의 지표와 중요한 차이점입니다. 리페인팅 방식의 지표는 잠재적으로 자금 손실로 이어질 수 있습니다. 이제 더욱 높은 확률과 정확도로 시장에 진입할 수 있습니다. 또한 화살표가 나타난 후 목표가(익절)
FootPrint Chart MT5
Gayathiri Gopalakrishnan
5 (1)
Turn every candle into a bid x ask footprint built from real tick data. See who is actually trading at each price, with delta, volume profile, imbalance zones and a scored setup engine that prints entry, stop and target Order Flow Footprint Chart Pro Most indicators tell you what price did. This one tells you who did it. Order Flow Footprint Chart Pro rebuilds every candle on your chart from raw tick data and shows you the volume that traded at each individual price inside it, split into the am
The Oracle Pro
Ottaviano De Cicco
5 (1)
The Oracle Pro: Synthetic Multi-Timeframe Bias Engine for MT5 Halloween Promo — 35% OFF The market gets spooky. Your edge stays sharp. Save 35% before this offer fades into the mist. The Oracle Pro is now USD 194 (regular USD 299). The Oracle Pro is a premium multi-timeframe bias engine for MetaTrader 5, built for demanding and professional traders. It answers one question with discipline: what is the directional bias on each timeframe right now, how strong is it, and how much do the timefra
Quantum TrendPulse
Bogdan Ion Puscasu
5 (26)
SuperTrend   ,   RSI   ,   Stochastic   의 힘을 하나의 포괄적인 지표로 결합하여 트레이딩 잠재력을 극대화하는 궁극의 트레이딩 도구   인 Quantum TrendPulse를   소개합니다. 정밀성과 효율성을 추구하는 트레이더를 위해 설계된 이 지표는 시장 추세, 모멘텀 변화, 최적의 진입 및 종료 지점을 자신 있게 식별하는 데 도움이 됩니다. 주요 특징: SuperTrend 통합:   주요 시장 추세를 쉽게 따라가고 수익성의 물결을 타세요. RSI 정밀도:   매수 과다 및 매도 과다 수준을 감지하여 시장 반전 시점을 파악하는 데 적합하며 SuperTrend 필터로 사용 가능 확률적 정확도:   변동성이 큰 시장에서 숨겨진 기회를 찾기 위해 확률적 진동   을 활용하고 SuperTrend의 필터로 사용 다중 시간대 분석:   M5부터 H1 또는 H4까지 다양한 시간대에 걸쳐 시장을 최신 상태로 유지하세요. 맞춤형 알림:   맞춤형 거래 조건이 충족되면
Advanced Supply Demand MT5
Bernhard Schweigert
4.53 (15)
현재 33% 할인! 초보자나 전문 트레이더를 위한 최고의 솔루션! 이 보조지표는 우리가 다수의 독창적 기능과 새로운 공식을 통합한 독특하고 고품질이며 저렴한 거래 도구입니다. 이 업데이트를 통해 이중 시간대를 표시할 수 있습니다. 더 높은 TF를 표시할 수 있을 뿐만 아니라 차트 TF와 더 높은 TF 모두를 표시할 수 있습니다: 중첩 영역 표시. 모든 Supply Demand 트레이더들이 좋아할 것입니다. :) 중요한 정보 공개 Advanced Supply Demand의 잠재력을 극대화하려면 다음을 방문하십시오. https://www.mql5.com/ko/blogs/post/720245   진입 또는 목표의 명확한 트리거 포인트를 정확히 찾아냄으로 해서 거래가 어떻게 개선될지 상상해 보십시오. 새로운 알고리즘을 기반으로 매수자와 매도자 간의 잠재적인 불균형을 훨씬 더 쉽게 분간할 수 있습니다. 왜냐하면 가장 강한 공급영역과 가장 강한 수요 영역과 과거에 어떻게 진행 되었는지를(이전
제작자의 제품 더 보기
Product Overview Pattern Recognition Master System is a main‑chart classic candlestick pattern auto‑recognition indicator designed for both the   MT4 and MT5   platforms. It automatically detects and labels eleven classic reversal and continuation patterns on the main chart, covering double tops and bottoms, head‑and‑shoulders tops and bottoms, hammer and hanging man, engulfing, doji, and morning and evening stars, with an independent cooldown period assigned to each pattern category to suppres
FREE
Product Overview Dual Swing Breakout System is a dual swing breakout state machine main chart indicator designed specifically for both   MT4 and MT5   platforms. By constructing two completely independent fast and slow swing high/low tracking systems, it transforms market structure into a clear state machine model. When price breaks key swing extremes, the system changes the state line color and triggers trading signals. This indicator helps traders filter market noise, precisely identify short
FREE
Product Overview Pyramiding Entry Master is a main‑chart moving‑average trend‑following and pyramiding‑entry indicator designed for both the   MT4 and MT5   platforms. It draws a four‑period moving‑average system (MA5, MA10, MA20, MA60) on the main chart and, based on a 55‑period trend‑momentum model, volume‑expansion confirmation, and multiple oversold conditions, automatically generates three types of buy signals: Chase (halfway momentum entry), Add (next‑day pyramiding), and Dip Buy (deep‑ov
FREE
Product Overview TD Sequential Pro is a TD Sequential main chart indicator designed specifically for both   MT4 and MT5   platforms, deeply developed based on the classic Tom DeMark Sequential theory. By statistically analyzing the comparison relationship between 9 consecutive bars' closing prices and their 4 preceding bars, this indicator precisely identifies market momentum exhaustion points. It helps traders capture high-probability reversal opportunities at trend ends, while providing compr
FREE
Product Overview TD Sequential Pro is a TD Sequential main chart indicator designed specifically for both   MT4 and MT5   platforms, deeply developed based on the classic Tom DeMark Sequential theory. By statistically analyzing the comparison relationship between 9 consecutive bars' closing prices and their 4 preceding bars, this indicator precisely identifies market momentum exhaustion points. It helps traders capture high-probability reversal opportunities at trend ends, while providing compr
FREE
Product Overview Dynamic Fibonacci Deviation is an adaptive Fibonacci levels main chart indicator designed specifically for both   MT4 and MT5   platforms. It innovatively combines EMA dynamic midline, standard deviation volatility, and Fibonacci ratios to construct an intelligent support/resistance system that automatically expands and contracts with market volatility. Through overbought/oversold recognition and fall back/bounce signals, this indicator helps traders accurately capture high-pro
FREE
Product Overview Dual Swing Breakout System is a dual swing breakout state machine main chart indicator designed specifically for both   MT4 and MT5   platforms. By constructing two completely independent fast and slow swing high/low tracking systems, it transforms market structure into a clear state machine model. When price breaks key swing extremes, the system changes the state line color and triggers trading signals. This indicator helps traders filter market noise, precisely identify short
FREE
Product Overview Pyramiding Entry Master is a main‑chart moving‑average trend‑following and pyramiding‑entry indicator designed for both the   MT4 and MT5   platforms. It draws a four‑period moving‑average system (MA5, MA10, MA20, MA60) on the main chart and, based on a 55‑period trend‑momentum model, volume‑expansion confirmation, and multiple oversold conditions, automatically generates three types of buy signals: Chase (halfway momentum entry), Add (next‑day pyramiding), and Dip Buy (deep‑ov
FREE
Product Overview Bottom Picker Pro is a bull/bear wave sub-window indicator designed specifically for both   MT4 and MT5   platforms. By integrating multi-period extreme value algorithms with multiple smoothing techniques, it constructs a highly responsive bull/bear trend line and wave tracking system. This indicator precisely identifies momentum reversals in extremely overbought and oversold zones, providing clear bottom-picking, top-escaping, and trend-pullback signals, helping traders accura
Product Overview Dynamic Fibonacci Deviation is an adaptive Fibonacci levels main chart indicator designed specifically for both   MT4 and MT5   platforms. It innovatively combines EMA dynamic midline, standard deviation volatility, and Fibonacci ratios to construct an intelligent support/resistance system that automatically expands and contracts with market volatility. Through overbought/oversold recognition and fall back/bounce signals, this indicator helps traders accurately capture high-pro
FREE
Product Overview Pattern Recognition Master System is a main‑chart classic candlestick pattern auto‑recognition indicator designed for both the   MT4 and MT5   platforms. It automatically detects and labels eleven classic reversal and continuation patterns on the main chart, covering double tops and bottoms, head‑and‑shoulders tops and bottoms, hammer and hanging man, engulfing, doji, and morning and evening stars, with an independent cooldown period assigned to each pattern category to suppres
FREE
Product Overview Liquidity Pool Hunter is a liquidity pool main chart indicator designed specifically for both   MT4 and MT5   platforms. Based on institutional order flow theory, it constructs liquidity accumulation zones by statistically analyzing recent highs and lows, precisely identifying sweep, fake break, and true break behaviors in the market. This indicator helps traders view the market from an institutional perspective, recognizing smart money liquidity hunting behavior, thereby captu
Dynamic Trend Follower Main Chart Indicator Deep Analysis: Dual MA Color Change + Cross Markers + Buy/Sell Signals + Trend Reversal + Strong Cross Indicator Overview Dynamic Trend Follower is a premium main chart moving average crossover composite signal indicator designed exclusively for the   MT4 、5platform . It breaks through the limitations of traditional single moving averages or simple crossovers by integrating a   Dual MA Trend Color Change System ,   Cross "+" Markers with Spread Percen
FREE
Smart Divergence Finder Indicator In-depth Analysis: A Practical Guide to Trend, Divergence, and Resonance Indicator Introduction Smart Divergence Finder is an intelligent main-chart comprehensive indicator designed for MT4/MT5 platforms. It overcomes the fragmented limitations of traditional sub-chart divergence analysis by integrating: Trend determination Multi-indicator divergence detection Intelligent signal filtering All key trading signals are displayed directly on the price chart. Its co
Gap Up Hunter
You Long Guo
Reasonable Indicators, Reasonable Prices 1. Core Functions   Multi-Period Resonance : Uses   13, 34, 55   period KDJ for signal filtering.   Gap Up Capture : Identifies   Gap Up   patterns for strong start entries.   Reversal Warning : Predicts tops/bottoms using   J-value   sensitivity. 2. Signal Description   Buy Signal 1: UP (Gap Up) Displays white   “UP”   text. Indicates a   Gap Up   bullish candle above   MA5 . Shows strong   bullish power , suitable for   trend following .
FREE
Dynamic Trend Follower Main Chart Indicator Deep Analysis: Dual MA Color Change + Cross Markers + Buy/Sell Signals + Trend Reversal + Strong Cross Indicator Overview Dynamic Trend Follower is a premium main chart moving average crossover composite signal indicator designed exclusively for the   MT4 platform . It breaks through the limitations of traditional single moving averages or simple crossovers by integrating a   Dual MA Trend Color Change System ,   Cross "+" Markers with Spread Percenta
FREE
Smart Divergence Finder Indicator In-depth Analysis: A Practical Guide to Trend, Divergence, and Resonance Indicator Introduction Smart Divergence Finder is an intelligent main-chart comprehensive indicator designed for MT4/MT5 platforms. It overcomes the fragmented limitations of traditional sub-chart divergence analysis by integrating: Trend determination Multi-indicator divergence detection Intelligent signal filtering All key trading signals are displayed directly on the price chart. Its co
Black Horse Finder Indicator In-depth Analysis: A Practical Guide to Trend, Support/Resistance, and Multi-Signal Trading Indicator Introduction Black Horse Finder is a comprehensive main-chart indicator designed specifically for the MT4 platform. Originating from the classic TongDaXin composite main chart logic, it breaks through the limitations of single moving averages or isolated indicators. It highly integrates trend determination, dynamic support/resistance levels, multiple buy signals (su
Channel Breakout Master: A Comprehensive Guide to Dual-Channel Trend Analysis with Weighted High-Low EMA and Trend State Identification Introduction Channel Breakout Master is an advanced chart indicator originally derived from the Tongdaxin SLTD series, specifically designed for both MT4 and MT5 platforms. This indicator transcends the limitations of traditional single Bollinger Bands or moving average channels by implementing a sophisticated dual-channel architecture combining   Weighted High-
Ultimate Signal Hub Main Chart Indicator Deep Analysis: MA60 Trend Baseline, Momentum Ignition & Multi-Layer Resonance Trading Guide Indicator Overview Ultimate Signal Hub is a premium main chart composite signal indicator designed exclusively for the   MT4/MT5 platform . It breaks through the limitations of traditional single moving averages or oscillators by integrating a multi-dimensional nested architecture comprising the   MA60 Trend Baseline ,   MACD Variant Ignition Algorithm ,   KDJ-Typ
Product Overview Bull Bear Decision Maker is an all-in-one main chart trend and reversal decision indicator designed specifically for both   MT4 and MT5   platforms. Originating from the classic NXMMA trading system, it deeply integrates Williams %R variants, KDJ, RSI, and a multiple moving average system. Through multi-dimensional algorithmic resonance, this indicator helps traders accurately identify high-probability trend-following, bottom-reversal, and top-escaping opportunities in complex
Product Overview Channel State Analyzer is a trend channel main chart indicator designed specifically for both   MT4 and MT5   platforms. It integrates linear regression slope trend lines, weighted channels, 55-period high/low monitoring, and channel state recognition. Through the combination of dynamic channels and trend lines, this indicator helps traders accurately identify trend reversals, channel breakouts, and short-term bottom opportunities in complex markets, while providing comprehensi
Product Overview Auto Trend Bands is an adaptive trend channel main chart indicator designed specifically for both   MT4 and MT5   platforms. It dynamically constructs trend channels based on linear regression algorithms and standard deviation, automatically identifying market trend direction and changing colors in real-time based on slope changes. Through channel breakout signals and strong trend markers, this indicator helps traders accurately capture trend initiation and acceleration opportu
Product Overview Color Trend Master is a multi-layer WMA smoothed trend line main chart indicator designed specifically for both   MT4 and MT5   platforms. Based on the classic MavilimW algorithm, it constructs an extremely smooth yet responsive trend-following system through 6 layers of nested Fibonacci-period Weighted Moving Average calculations. This indicator precisely identifies trend turning points and helps traders clearly grasp trend direction and momentum strength in complex markets th
Product Overview 6in1 Confluence System is a multi-indicator resonance sub-window indicator designed specifically for both   MT4 and MT5   platforms. It innovatively integrates 6 classic technical indicators—MACD, KDJ, RSI, LWR, BBI, and MTM—into a single sub-window, displaying bull/bear power comparison in real-time through a visual dot matrix. When all 6 indicators point in the same direction simultaneously, the system issues high-probability resonance signals, helping traders quickly identif
Product Overview Triple Divergence Hunter is a multi-indicator divergence detection sub-window indicator designed specifically for both   MT4 and MT5   platforms. It deeply integrates three classic momentum indicators—MACD, KDJ, and RSI—using rigorous crossover and extreme value comparison algorithms to precisely capture top and bottom divergences between price and indicators. Additionally, the indicator features a built-in custom K88/D88 momentum trend system, helping traders identify reversal
Product Overview Five Dimension Resonance System is a five-dimensional resonance trading main chart indicator designed specifically for both   MT4 and MT5   platforms. It innovatively integrates 5 independent trading systems—trend following, volatility breakout, range breakout, divergence reversal, and momentum scoring—into one unified framework. Through a strict resonance filtering mechanism, high-probability resonance entry alerts are triggered only when at least 2 out of the 5 systems simult
Product Overview Peak Valley Hunter (HZ88) is a comprehensive main chart trend-following and swing reversal indicator designed specifically for both   MT4 and MT5   platforms. By constructing a triple composite moving average system (Trade Line and Trend Line), combined with dynamic support/resistance tracking algorithms and candlestick pattern recognition technology, it provides traders with comprehensive trading signals ranging from trend confirmation and momentum explosion to local reversals
Product Overview Multi Dimensional Bottom Finder is an advanced sub-window oscillator and multi-dimensional resonance indicator designed specifically for both   MT4 and MT5   platforms. Breaking through the limitations of traditional single KDJ or RSI indicators, it constructs a highly in-depth bottom-hunting system by integrating multi-period stochastic oscillator algorithms, CCI extreme value analysis, volume anomaly detection, and bias rate recovery models. This indicator keenly captures mom
Product Overview Low Buy High Sell Radar is an all‑in‑one main‑chart trend‑following and swing‑trading indicator designed for both the   MT4 and MT5   platforms. By building a dynamic trend‑line color‑switching system and combining multi‑period oscillator algorithms (TSI and RSI), a volume‑price momentum model, and a signal‑cooldown filter, it delivers a full range of trading signals covering trend confirmation, overbought/oversold detection, and precise entry and exit. With rigorous logic, cle
필터:
리뷰 없음
리뷰 답변