Gold Liquidity Fib Zones

Gold Zones Liquidity

Wick Zones Liquidity is a visual support and resistance zone indicator designed to help traders identify important reaction areas created from swing highs, swing lows, wick zones, and liquidity candle clusters.


Instead of drawing random horizontal levels, the indicator studies the most important visible swing high and swing low on your chart using ZigZag structure. From those swing points, it automatically builds clean 38.2 and 61.8 liquidity zones that can act as reaction areas, pullback zones, continuation zones, or possible reversal areas.

This tool is designed for traders who want a cleaner way to read where price may return, reject, pause, or continue after a strong move.

Main Features

 Automatic Visible Swing Detection
The indicator scans the visible chart and finds the highest visible swing high and the lowest visible swing low. This makes the zones adapt to the section of the market you are currently analyzing.

 Buy Wick Zones
For swing lows, the indicator measures the lower wick area and draws the 38.2 and 61.8 wick zone. These levels can help identify where buyers may defend price again.

 Sell Wick Zones
For swing highs, the indicator measures the upper wick area and draws the 38.2 and 61.8 wick zone. These levels can help identify where sellers may defend price again.

 Main Buy Liquidity Zone
The buy liquidity zone is calculated from the swing low area and the first bullish candle cluster after that swing low. It measures from the bottom wick to the top of the candle body, helping traders identify the key bullish liquidity zone.

 Main Sell Liquidity Zone
The sell liquidity zone is calculated from the swing high area and the first bearish candle cluster after that swing high. It measures from the top wick to the bottom of the candle body, helping traders identify the key bearish liquidity zone.

 Upper Sell Liquidity Zone
The indicator can also draw an upper sell liquidity zone between the swing high and the main sell liquidity area, giving traders an additional upper reaction band.

 Lower Buy Liquidity Zone
The indicator can draw a lower buy liquidity zone between the swing low and the main buy liquidity area, giving traders an additional lower reaction band.

 Middle Liquidity Zone
A middle liquidity zone is calculated between the lower sell liquidity area and the upper buy liquidity area. This helps traders identify the central reaction area between buyer and seller zones.

 Connector Zones
Upper and lower connector zones help bridge the space between the main liquidity zones and the middle liquidity zone. These connector levels can be useful when price is moving from one zone area to another.

 Zone Alerts
The indicator includes alerts when price touches or enters selected zones. Alerts can be enabled or disabled separately for each zone type.

 Flexible Alert Options
Supports popup alerts, push notifications, email alerts, sound alerts, once-per-bar control, buffer distance, and cooldown timing.

 Clean Forward-Only Lines
Zone lines start from the original swing area and extend only to the right side of the chart. They are not endless rays, keeping the chart cleaner and easier to read.

 Performance Friendly
The indicator includes refresh controls such as timer refresh, new-bar refresh, and chart-change refresh. Zone lines are updated without constantly deleting and recreating objects, helping reduce flicker and CPU usage.

How Traders Can Use It

Wick Zones Liquidity can help traders:

  • Identify important reaction zones from visible swing highs and lows

  • Watch where price may reject from upper wick or lower wick areas

  • Find possible buy zones after a swing low

  • Find possible sell zones after a swing high

  • Track the space between buyer and seller liquidity areas

  • Use 38.2 and 61.8 zones for pullback, continuation, or reversal planning

  • Receive alerts when price returns to important liquidity zones

  • Keep the chart clean while still seeing the most important levels

This makes the indicator useful for scalping, intraday trading, swing trading, support and resistance analysis, liquidity-zone trading, and market-structure analysis.

Best Used For

Wick Zones Liquidity can be used on:

  • Gold

  • Forex pairs

  • Indices

  • Crypto

  • Oil and commodities

  • Any MetaTrader symbol with clear swing movement

It works on multiple timeframes and is especially useful for traders who analyze price reactions around previous swing highs, swing lows, wick zones, and liquidity areas.

Important Note

This indicator is a technical analysis tool. It does not predict future price movement and does not guarantee profitable trades. The zones should be used together with your own trading plan, risk management, and market confirmation rules.

The indicator uses chart structure and available price data from your MetaTrader platform. Results may vary depending on broker data, symbol, timeframe, and chart history.


추천 제품
VR Cub
Vladimir Pastushak
VR Cub 은 고품질 진입점을 얻는 지표입니다. 이 지표는 수학적 계산을 용이하게 하고 포지션 진입점 검색을 단순화하기 위해 개발되었습니다. 지표가 작성된 거래 전략은 수년 동안 그 효율성을 입증해 왔습니다. 거래 전략의 단순성은 초보 거래자라도 성공적으로 거래할 수 있다는 큰 장점입니다. VR Cub은 포지션 개시 지점과 이익 실현 및 손절매 목표 수준을 계산하여 효율성과 사용 편의성을 크게 높입니다. 간단한 거래 규칙을 이해하려면 아래 전략을 사용한 거래 스크린샷을 살펴보세요. 설정, 세트 파일, 데모 버전, 지침, 문제 해결 등은 다음에서 얻을 수 있습니다. [블로그] 다음에서 리뷰를 읽거나 작성할 수 있습니다. [링크] 버전 [MetaTrader 5] 진입점 계산 규칙 포지션 개설 진입점을 계산하려면 VR Cub 도구를 마지막 최고점에서 마지막 최저점까지 늘려야 합니다. 첫 번째 지점이 두 번째 지점보다 빠른 경우, 거래자는 막대가 중간선 위에서 마감될 때까지 기다립니다
Auto Fibo Pro m
DMITRII GRIDASOV
"Auto FIBO Pro" Crypto_Forex 지표 - 거래에 유용한 보조 도구입니다! - 지표는 자동으로 Fibo 수준과 로컬 추세선(빨간색)을 계산하여 차트에 배치합니다. - Fibonacci 수준은 가격이 반전될 수 있는 주요 영역을 나타냅니다. - 가장 중요한 수준은 23.6%, 38.2%, 50%, 61.8%입니다. - 역전 스캘핑이나 존 그리드 거래에 사용할 수 있습니다. - Auto FIBO Pro 지표를 사용하여 현재 시스템을 개선할 수 있는 기회도 많습니다. - Info Spread Swap Display가 있습니다. 현재 Spread와 Swap이 부착된 외환 쌍을 표시합니다. - 디스플레이에는 계정 잔액, 자본 및 마진도 표시됩니다. - 차트의 어느 모서리에서나 Info Spread Swap Display를 찾을 수 있습니다. 여기를 클릭하여 고품질 트레이딩 로봇과 지표를 확인하세요! 이것은 이 MQL5 웹사이트에서만 제공되는 오리지널 제품입니다.
Indicador Taurus All4
Fabio Oliveira Magalhaes
Taurus All4 Taurus All4 is a high-performance indicator, it will tell you the strength of the trend, and you will be able to observe the strength of the candle. Our indicator has more than 4 trend confirmations. It is very simple and easy to use. Confirmation Modes Candle Trend Confirmations: When the candle switches to light green the trend is high. When the candle switches to light red the trend is reverting down. When the candle changes to dark red the trend is low. Trendline Trend Confirm
GeoWprPro
Georgij Komarov
WPR by Profile, or WPR for Professionals Geo_WprPro is one of the well-known currency profile indicators. It simultaneously displays two WPR indicators with different parameters in the matrix form on all timeframes of multiple currency pairs forming the currency profile . As follows from the description, " WPR is a leading indicator that often goes ahead of the price chart. The oscillator frequently reaches extreme values before the price reversal as if anticipating that event: it almost always
MRA Index
Davit Beridze
5 (5)
MRA Index 지표 개요 보너스 혜택: 지표를 구매하면 "MRA Index EA"를 무료로 받을 수 있습니다. 최적화 전략: 스캘핑을 위해 지난 12개월 동안의 데이터를 기반으로 설정을 최적화하고 다음 1개월 동안 사용합니다. 이 방법은 매우 효과적인 것으로 입증되었습니다. 중요한 참고사항: 기본 설정은 시각화용일 뿐이며 수익성을 위해 최적화되지 않았습니다. 올바른 최적화 지침은 구매자에게만 제공됩니다. "MRA Index" 지표 소개: "MRA Index"는 트레이더가 잠재적인 시장 트렌드와 진입점을 식별하는 데 도움을 주는 다기능 외환 지표입니다. 이 지표는 특수 채널과 해당 채널 내에서 이동하는 동적 하이브리드 라인을 특징으로 하며, 이를 통해 매수 및 매도 신호를 생성합니다. 주요 특징: 동적 하이브리드 라인: 채널 내에서 이동하며 거래 신호 생성을 위한 기반이 됩니다. 매수 및 매도 화살표: 하이브리드 라인과 채널 간 특정 상호작용을 기반으로 생성되며, 잠재적인 시장 반
Supply and Demand Monster MT4
Tsog Erdene Borjigon Enkhkhudulmur
Supply and demand zones are at the heart of   supply and demand trading . These zones are areas that show  liquidity at a specific price.  The supply zone is also called the distribution zone, while the demand zone is called the accumulation zone.   Our indicator automatically draw supply and demand zones in Metatrader 5. It give opportunity to understand trading zone and avoiding risk.
Liquidity Sweeps Detector PRO MT4 매수 측과 매도 측 유동성을 매핑하고, 가격이 유동성 레벨을 스윕하는 순간을 감지하며, 뒤따르는 시장 구조 전환 (MSS)을 확인하는 Smart Money Concepts (SMC / ICT) 지표입니다. 유효한 sweep + MSS마다 화살표로 표시하고 멀티 타임프레임 컨플루언스로 등급을 매기며, 자동 손익비 투영과 차트 위 실시간 패널을 제공합니다. 기능 확인된 스윙 고점과 저점에서 매수 측 (BSL) 과 매도 측 (SSL) 유동성을 매핑합니다. 유동성 sweep (스톱 헌팅)을 감지합니다: 가격이 레벨을 뚫은 뒤 다시 안쪽으로 마감합니다. setup을 검증하기 전에 sweep 이후의 시장 구조 전환 (MSS) 을 확인합니다. BSL + MSS에는 숏 화살표를, SSL + MSS에는 롱 화살표를 표시합니다. 멀티 타임프레임 컨플루언스 세 개의 상위 타임프레임(기본값 M15 / H1 / H4)을 캐시된 바이어스 엔진
Rira Renko
Vitor Palmeira Abbehusen
RENKO on Time Chart This indicator is an enhanced Renko, so you can watch the Renko bricks on the chart to understand price movement more clearly the other improvement is automated box size according to ATR (Average True Range) period you can set the ATR number as you want and the box size of Renko changes automatically based on price movement Inputs Mode: Box size is the input to specify the size of the Renko box you want to print on the chart. This input lets you choose the fixed box siz
트렌드의 파도를 타다 — 추세 추종을 위한 명확한 신호 금융 시장에서 가장 안정적으로 수익을 낼 수 있는 시점은 명확한 추세가 형성된 상황이라고 합니다. 하지만 그 흐름을 확실히 잡는 것은 경험이 많은 트레이더에게도 쉽지 않습니다. Ride the Trend Signal 은 추세장의 "되돌림 매수" 또는 "되돌림 매도"에 초점을 맞춘 신호형 인디케이터입니다. 초기 추세에는 진입하지 않고, 방향성이 확인된 이후의 2차, 3차 파동을 포착함으로써 더 신뢰성 높은 진입 타이밍을 제공합니다. 이동 평균선, 스토캐스틱, 평균 캔들(Heiken Ashi) 등 세 가지 기술적 요소를 활용하여 간단하면서도 실용적인 로직으로 구성되어 있습니다. 추세 추종 전략을 안정적으로 운용하고자 하는 트레이더의 재량 판단을 보조하는 데 적합합니다. 사용 인디케이터와 역할 이동 평균선: 추세의 유무 및 방향을 파악하는 지표입니다. 이 인디케이터는 가격이 평균선에서 이탈 후 다시 회귀하는 움직임을 기반으로 추세 지
FREE
Legacy of Gann
Pavel Zamoshnikov
4.83 (12)
The indicator very accurately determines the levels of the possible end of the trend and profit fixing. The method of determining levels is based on the ideas of W.D.Gann, using an algorithm developed by his follower Kirill Borovsky. Extremely high reliability of reaching levels (according to K. Borovsky  - 80-90%) Indispensable for any trading strategy – every trader needs to determine the exit point from the market! Precisely determines targets on any timeframes and any instruments (forex, met
ADX Pointer
Dominik Mandok
ADX Pointer is an indicator which is based on "Average Directional Index" and draws three numbers in chart window depending on the value of ADX. In ADX Pointer you can set "ADX_Period" which is of course period of Average Directional Index and you can also set 3 levels. When ADX value exceed first level ("ADX_Level1") in chart window appears number "1", when ADX exceed second level ("ADX_Level2") appears "2" and when ADX exceed third level ("ADX_Level3") appears "3". Simple. ADX Pointer works on
Trends Finder
Oleksii Ferbei
"Trend Finder" is a trend trading strategy that combines market noise filtration and all necessary functions in one tool! The system automatically displays entry and exit points using arrows. Only one parameter is sufficient for configuration. It offers simple, intuitively understandable, and effective trend detection. The intelligent algorithm of the "Trend Finder" indicator identifies potential market reversal points. Often, a good trend can be visually observed on the price chart. However, a
RaysFX Supertrend Bar RaysFX Supertrend Bar è un indicatore personalizzato per MetaTrader 4. Utilizza l'indice di canale delle materie prime (CCI) per generare segnali di trading. L'indicatore mostra dei puntini in una finestra separata sotto il grafico principale per indicare i segnali di trading. Caratteristiche principali: Calcola il CCI per diversi periodi temporali. Visualizza puntini per indicare i segnali di trading. Permette all'utente di modificare i periodi temporali e la distanza tra
PipFinite Trend PRO
Karlo Wilson Vendiola
4.88 (2251)
Breakthrough Solution For Trend Trading And Filtering With All Important Features Built Inside One Tool! Trend PRO's smart algorithm detects the trend, filters out market noise and gives entry signals with exit levels. The new features with enhanced rules for statistical calculation improved the overall performance of this indicator. Important Information Revealed Maximize the potential of Trend Pro, please visit www.mql5.com/en/blogs/post/713938 The Powerful Expert Advisor Version Automatin
PZ Mean Reversion MT4
PZ TRADING SLU
3 (4)
평균 회귀 거래에 대한 전문적이고 정량적인 접근 방식을 구현하는 고유한 지표입니다. 이는 가격이 예측 가능하고 측정 가능한 방식으로 평균으로 전환되고 반환된다는 사실을 이용하여 비정량적 거래 전략을 훨씬 능가하는 명확한 진입 및 퇴장 규칙을 허용합니다. [ Installation Guide | Update Guide | Troubleshooting | FAQ | All Products ] 명확한 거래 신호 놀랍도록 쉬운 거래 사용자 정의 가능한 색상 및 크기 성능 통계 구현 대부분의 거래 전략을 능가합니다. 적절한 SL 및 TP 레벨을 표시합니다. 이메일/음향/시각 알림을 구현합니다. 작동 원리 이 지표는 더 높은 기간에서 완전히 사용자 정의 가능한 이동 평균 주변의 표준 편차를 측정하고 추세 추종 접근 방식을 사용하여 정확하게 거래를 찾습니다. 거래는 현재 차트의 가격 동작을 살펴보고 선택한 더 높은 기간에서 계산된 평균 가격대로 가격이 돌아오면 닫힙니다. 코딩 방식 때문에 지
Laser Trend
Nicolas Zouein
The trend is your friend! This is what this indicator is all about. Follow this famous saying and be safe. Characteristics: Buy/Sell signals fixed on the close of a bar. Works on all symbols and all timeframes. Clear visual market trend laser line, Buy/Sell signal arrows, market strength meter, TP1 & TP2 boxes. Visual signals when to enter, when to exit the market. No repainting. Compatible with Flexible EA for trading automation. (Ask for a free set file optimized to perform 2010-2018) Parame
ZhiBiCCI MT4
Qiuyang Zheng
[ZhiBiCCI] indicators are suitable for all cycle use, and are also suitable for all market varieties. [ZhiBiCCI] Green solid line is a reversal of bullish divergence. The green dotted line is a classic bullish divergence. [ZhiBiCCI] The solid line to the red is a reverse bearish divergence. The red dotted line is a classical bearish divergence. [ZhiBiCCI] can be set in the parameters (Alert, Send mail, Send notification), set to (true) to send instant signals to the alarm window, email, insta
MT4용 Crypto_Forex 지표 "FORCE 지수 및 2개 이동 평균". 리페인트 불필요. - 이 지표는 추세 방향의 모멘텀 트레이딩에 매우 유용합니다. - "FORCE 지수 및 2개 이동 평균" 지표를 사용하면 Force 지수의 빠르고 느린 이동 평균을 확인할 수 있습니다. - Force 지수는 가격과 거래량 데이터를 단일 값으로 결합하는 최고의 지표 중 하나입니다. - Force 지수 자체는 가격 변동에 사용된 파워의 양을 측정하는 강력한 오실레이터입니다. - 지표는 추세 변화를 매우 조기에 확인할 수 있는 기회를 제공합니다. - 이 지표는 매개변수를 통해 매우 쉽게 설정할 수 있으며, 모든 시간대에서 사용할 수 있습니다. - 그림에서 매수 및 매도 진입 조건을 확인할 수 있습니다. 여기를 클릭하여 고품질 트레이딩 로봇과 지표를 확인하세요! MQL5 웹사이트에서만 제공되는 오리지널 제품입니다.
MACD Divergence
Sergey Deev
2.5 (2)
The indicator detects divergence signals - the divergences between the price peaks and the MACD oscillator values. The signals are displayed as arrows in the additional window and are maintained by the messages in a pop-up window, e-mails and push-notifications. The conditions which formed the signal are displayed by lines on the chart and in the indicator window. Indicator Parameters MacdFast - fast MACD line period MacdSlow - slow MACD line period MacdSignal - MACD signal line period MacdPric
Trendiness Index
Libertas LLC
5 (3)
"The trend is your friend" is one of the best known sayings in investing, because capturing large trendy price movements can be extremely profitable. However, trading with the trend is often easier said than done, because many indicators are based on price reversals not trends. These aren't very effective at identifying trendy periods, or predicting whether trends will continue. We developed the Trendiness Index to help address this problem by indicating the strength and direction of price trend
MT4용 Crypto_Forex 지표 "RSI 및 2개 이동평균선", 리페인트 없음 - 이 지표는 모멘텀 트레이딩 시스템에 매우 적합합니다. - "RSI 및 2개 이동평균선" 지표를 사용하면 RSI 자체의 빠른 이동평균선과 느린 이동평균선을 확인할 수 있습니다. - 지표는 추세 변화를 매우 조기에 파악할 수 있는 기회를 제공합니다. - "RSI 및 2개 이동평균선"은 과매수/과매도 구간에서 추세 방향으로 모멘텀을 포착하는 데 사용할 수 있습니다. - 매개변수를 통해 이 지표를 매우 쉽게 설정할 수 있습니다. - 모든 시간대에서 사용할 수 있습니다.   PC/Mobile alerts! Click here to see high quality Trading Robots and Indicators! MQL5 웹사이트에서만 제공되는 오리지널 제품입니다.
Trend MACD mg
DMITRII GRIDASOV
MT4용 TREND MACD 지표 - 훌륭하고 효율적인 거래 도구입니다! - 이 지표는 큰 가격 변동을 포착하는 데 집중하는 추세 트레이더에게 유용합니다. - TREND MACD는 3개의 선으로 구성됩니다. 녹색선은 주요 추세 방향을 나타내며, 파란색과 자홍색 선은 진입 및 청산을 나타냅니다. - 지표를 사용하면 수익을 극대화할 수 있습니다. 수익성 있는 거래에서 너무 일찍 청산하지 않도록 합니다. - 지표에는 모바일 및 PC 알림 기능이 내장되어 있습니다. 매수 거래에 지표를 사용하는 방법(그림 참조): 1) 파란색과 자홍색 선이 모두 녹색선 위에 있는지 확인합니다. 2) 파란색 선이 자홍색 선 위에 있으면 매수합니다. 3) 파란색 선이 자홍색 선 아래에 있으면 청산합니다. 4) 매도 거래의 경우 반대로 합니다. Click here to see high quality Trading Robots and Indicators! MQL5 웹사이트에서만 제공되는 정품 제품입니다.
This is a true trend lines indicator for MT4/MT5. This indicator draw real trend lines. Usually the trend line is drawn as a solid line. The next trend line that is likely to be valid is drawn as a dotted line. The most recent invalidated trend line is drawn as a dashed line. Three-touch lines is drawn as a bright colors. If the starting point of the trend line is new, the blue line is displayed(call shortline), if it is old, the gold line is displayed(call longline). The number of bars border
Trend Oscillator mw
DMITRII GRIDASOV
Trend Oscillator - 고급 맞춤형 Crypto_Forex 지표, 효율적인 거래 도구입니다! .......................................................................................... - 고급 새로운 계산 방법 사용 - 매개변수 "계산 가격"에 대한 20가지 옵션. - 지금까지 개발된 가장 매끄러운 오실레이터. - 상승 추세는 녹색, 하락 추세는 빨간색. - 과매도 값: 5 미만, 과매도 값: 95 이상. - 이 지표로 표준 전략도 업그레이드할 수 있는 기회가 많습니다. - PC 및 모바일 알림. .................................................................... 여기를 클릭하여 고품질 트레이딩 로봇과 지표를 확인하세요! 이 MQL5 웹사이트에서만 제공되는 오리지널 제품입니다.
Breakout Channel ml
DMITRII GRIDASOV
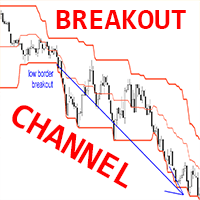
Crypto_Forex MT4용 브레이크아웃 채널 지표, 리페인트 없음. - 이 지표는 고가/저가 브레이크아웃을 기반으로 하는 완벽한 거래 시스템으로 사용할 수 있습니다. - 이 지표는 단 하나의 매개변수, 즉 HYSTORY DEPTH만 가지고 있으며, 이는 지표가 고려하는 캔들 수를 나타냅니다. - HYSTORY DEPTH 매개변수 권장 값: D1 - 20(1개월), H4 - 30(1주일), H1 - 24(1일). - 브레이크아웃 채널은 세 개의 선으로 구성됩니다. 고가 경계선 - 최근 N개(HYSTORY DEPTH 매개변수) 캔들의 최고가, 저가 경계선 - 최근 N개(HYSTORY DEPTH 매개변수) 캔들의 최저가, 그리고 중간선. - 이 지표는 다른 지표/가격 움직임 패턴과 함께 사용할 수 있습니다. - 브레이크아웃 채널 지표 사용 예시는 그림에서 확인할 수 있습니다. 여기를 클릭하여 고품질 트레이딩 로봇과 지표를 확인하세요! 본 제품은 MQL5 웹사이트에서만 제공되는 정품
Gold Buster
Agus Santoso
MT4 버전 : https://www.mql5.com/en/market/product/102622 MT5 버전 : https://www.mql5.com/en/market/product/102624 "골드 버스터" EA 소개: 차세대 동적 지원 저항 및 위험 관리 시스템 "골드 버스터" EA는 개방형 포지션 관리 및 위험 분석 기술의 최신 발전을 활용하여 금융 시장에서 지지 및 저항 수준을 식별하고 활용하는 방법을 재정의하는 최첨단 자동 거래 시스템을 나타냅니다. 이 혁신적인 EA(Expert Advisor)는 다양한 거래 플랫폼과 도구에서 원활하게 작동하도록 설계되었으며, 일관된 이익과 위험 완화를 추구하는 초보자와 숙련된 거래자 모두에게 적합합니다. 주요 특징들: 동적 지지 및 저항 식별: "골드 버스터" EA의 핵심은 동적 지지와 저항 식별 알고리즘에 있습니다. 종종 사전 정의되어 빠르게 구식이 될 수 있는 전통적인 정적 지지 및 저항 수준과 달리 이 EA는 기계
MT4용 Crypto_Forex 지표 "동적 과매수/과매수 구간을 포함하는 CCI" (재도색 불필요) - 상품 채널 지수(CCI)는 추세 방향으로의 모멘텀 트레이딩에 매우 유용합니다. - 동적인 과매수 구간에서 매도 진입을, 동적인 과매도 구간에서 매수 진입을 주요 추세 방향으로 유도하는 데 매우 유용합니다. - 이 지표는 가격 움직임 진입과도 결합하면 매우 유용합니다. - 동적인 과매수 구간 - 노란색 선 위. - 동적인 과매도 구간 - 파란색 선 아래. - CCI 오실레이터는 현재 가격과 과거 평균 가격의 차이를 측정합니다. - PC 및 모바일 알림 기능 제공. Click here to see high quality Trading Robots and Indicators! MQL5 웹사이트에서만 제공되는 오리지널 상품입니다.
상품명 MTF MA Controller MT4 짧은 설명 차트 패널에서 최대 4개의 멀티 타임프레임 이동평균선을 직접 조작할 수 있습니다. 전체 설명 MTF MA Controller MT4는 차트 위의 패널을 통해 최대 4개의 멀티 타임프레임 이동평균선을 조작할 수 있는 인디케이터입니다. 인디케이터 설정 창을 열지 않고도 각 이동평균선의 표시 여부, 기간, 시간대를 변경할 수 있습니다. 이 도구는 이동평균선을 활용한 차트 분석, 멀티 타임프레임 분석, 재량 트레이딩 보조에 적합합니다. 주요 기능: 최대 4개의 이동평균선 표시 멀티 타임프레임 이동평균선 지원 차트 패널에서 MA 기간 변경 +/- 버튼으로 기간 조정 길게 누르기를 통한 연속 기간 변경 지원 탭 메뉴에서 MA 시간대 선택 패널에서 각 MA ON/OFF 전환 차트 위에서 패널 자유 이동 패널 접기 기능 패널 설정 저장 및 복원 각 MA의 색상, 선 종류, 선 두께 설정 가능 사용 가능한 시간대: Current M1 M5 M
Your good friend
Sergei Semenov
Your Good Friends — this is not just an indicator, but your reliable trading assistant, designed for traders who value simplicity, clarity, and stability. It combines the best classic methods of technical analysis — support and resistance levels, reversal signals, visual cues — and presents them in the clearest, most user-friendly format possible. Suitable for both beginners and experienced traders — especially those who want to eliminate chaos, reduce stress, and trade based on clear signals.
FXArk Kcci
Nithaam Davis
The KCCi uses a Grid method with a breakeven feature, its based around the CCI and Kijun-Sen of the Ichimoku indicator. Its recommended to be used with a cent account as it requires a high volume of capital along with a broker that allows numerous open positions, along with this low spreads are desired. All major pairs can be traded with this EA, including commodities and on all TFs though before any usage please optimize . IMPORTANT: These parameters will need to be increased to the max open
이 제품의 구매자들이 또한 구매함
Neuro Poseidon MT4
Daria Rezueva
4.8 (45)
Neuro Poseidon is a new indicator by Daria Rezueva. It combines precise trading signals with adaptive TP/SL levels - creating best possible trades as a result! Message me and get  Neuro Poseidon Assistant  as a gift to automize your trading process! What makes it stand out? 1. Proven profitability on all assets and timeframes 2. Only confirmed BUY and SELL signals present on the chart 3. Adaptive TP & SL levels generated by the software for each trade 4. Easy to understand - suitable for all
Gann Made Easy
Oleg Rodin
4.84 (171)
Gann Made Easy 는 mr.의 이론을 사용하여 최고의 거래 원칙을 기반으로 하는 전문적이고 사용하기 쉬운 Forex 거래 시스템입니다. W.D. 간. 이 표시기는 Stop Loss 및 Take Profit Levels를 포함하여 정확한 BUY 및 SELL 신호를 제공합니다. PUSH 알림을 사용하여 이동 중에도 거래할 수 있습니다. 구매 후 거래 방법 안내 및 유용한 추가 지표를 무료로 받으시려면 저에게 연락주세요! 아마도 Gann 거래 방법에 대해 이미 여러 번 들었을 것입니다. 일반적으로 Gann의 이론은 초보자 거래자뿐만 아니라 이미 거래 경험이 있는 사람들에게도 매우 복잡한 것입니다. Gann의 거래 방식은 이론적으로 적용하기 쉽지 않기 때문입니다. 나는 그 지식을 연마하고 Forex 지표에 최고의 원칙을 적용하기 위해 몇 년을 보냈습니다. 표시기는 적용하기가 매우 쉽습니다. 차트에 첨부하고 간단한 거래 권장 사항을 따르기만 하면 됩니다. 지표는 지속적으로 시장 분석
M1 Sniper
Oleg Rodin
5 (27)
M1 SNIPER 는 사용하기 쉬운 거래 지표 시스템입니다. M1 시간대에 맞춰 설계된 화살표 지표입니다. 이 지표는 M1 시간대 스캘핑을 위한 단독 시스템으로 사용할 수 있으며, 기존 거래 시스템의 일부로도 사용할 수 있습니다. 이 거래 시스템은 M1 시간대 거래용으로 특별히 설계되었지만, 다른 시간대에도 사용할 수 있습니다. 원래는 XAUUSD와 BTCUSD 거래를 위해 이 방법을 설계했지만, 다른 시장 거래에도 유용하다는 것을 알게 되었습니다. 이 지표의 신호는 추세 방향과 반대로 거래될 수 있습니다. 저는 지표의 신호를 활용하여 양방향으로 거래할 수 있도록 돕는 특별한 거래 기법을 알려드립니다. 이 방법은 특별한 동적 지지선과 저항선 가격 영역을 활용하는 것을 기반으로 합니다. 구매하시면 M1 SNIPER 화살표 지표를 바로 다운로드하실 수 있습니다. 또한, 아래 스크린샷에 표시된 Apollo Dynamic SR 지표는 M1 SNIPER 도구를 사용하는 모든 사용자에게 무료로
BTMM State Engine Pro MT4
Garry James Goodchild
BTMM State Engine Pro by G-Labs — Beat The Market Maker indicator for MetaTrader 4. Asian session range, London and New York kill zones, level progression (L1/L2/L3), peak formation detection (PFH/PFL), entry signals, and a multi-pair scanner from one chart. Stop scanning charts one pair at a time. The State Engine tracks the BTMM daily cycle automatically — Asian box, room boundaries, level blocks, peak formations, and filtered entries — while the scanner dashboard shows level, peak status,
SR Liquidity
Oleg Rodin
5 (1)
SR Liquidity 는 시장 유동성이 집중되고 가격이 가장 강력하게 반응하는 숨겨진 구간을 포착하도록 설계된 트레이딩 지표입니다. 이러한 특수 유동성 구간은 강력한 지지 및 저항선 역할을 하며, 시장 반전 가능성이 가장 높은 지점을 명확하게 보여주는 지도가 되어 줍니다. SR Liquidity는 일반적인 지지 및 저항선을 단순히 그리는 대신, 실제 가격 움직임을 분석하여 매수 및 매도 압력이 집중되는 구간을 포착합니다. 이러한 구간은 실질적인 시장의 흐름을 주도하는 유동성 풀(liquidity pools)에 해당합니다. 이 지표는 해당 구간을 차트에 직접 시각화하여, 가격 반응이 실제로 나타나기 전에 이를 미리 예측할 수 있도록 돕습니다. 즉, 가격 추세가 전환될 가능성을 사전에 파악하게 해주는 것입니다. 결과적으로 이 지표는 가공되지 않은 가격 움직임(price action)을 시장의 핵심 가격대, 다시 말해 추세 전환점이 될 수 있는 지점들을 보여주는 명확하고 실용적인 로드맵
Prop Firm Sniper
Mohamed Hassan
4.33 (6)
Prop Firm Sniper MT4  is a professional market structure indicator that automatically identifies high-probability BUY and SELL opportunities using BOS and CHoCH analysis. Recommended Timeframes: For backtesting, use the indicator on   M5 or M15   for Gold (XAUUSD), and   M15 or H1   for more volatile Forex pairs such as   GBPUSD, USDJPY, EURGBP , and similar markets. CONTACT ME AFTER PURCHASE TO CLAIM YOUR FREE BONUSES! Prop Firm Sniper  is a professional market structure indicator designed t
KURAMA GOLD SIGNAL PRO (MT4) — 7중 필터 · 자동 TP/SL · 품질 점수 · 시그널 기록 저장 | XAUUSD 완전 트레이딩 시스템 실시간 리페인트 없음. 시그널이 나타나는 순간 화살표, 진입, TP, SL이 그 자리에 고정되어 이후 절대 움직이지 않습니다. 여러분이 거래하는 것은 바로 이 실시간 시그널입니다. 그리고 v7.20에서는 실제로 발신된 모든 시그널이 자동 저장되어 재시작 후에도 정확히 복원됩니다. 구매자 전용 보너스 평생 라이선스를 구매하시면 AI Zone Radar($59 상당) + 완전 PDF 매뉴얼을 무료로 드립니다. 제품 가격에 더해 $59 상당의 보너스가 따라옵니다. 구매 후 MQL5로 메시지를 보내주세요. AI Zone Radar: https://www.mql5.com/en/market/product/175834 골드 트레이더 커뮤니티에서 실제로 사용되며 정확성과
Dynamic Forex28 Navigator
Bernhard Schweigert
4.43 (7)
Dynamic Forex28 Navigator - 차세대 외환 거래 도구. 현재 49% 할인. Dynamic Forex28 Navigator는 오랫동안 인기 있는 지표의 진화형으로, 세 가지의 힘을 하나로 결합했습니다. 고급 통화 Strength28 지표(695개 리뷰) + 고급 통화 IMPULSE with ALERT(520개 리뷰) + CS28 콤보 신호(보너스). 지표에 대한 자세한 정보 https://www.mql5.com/en/blogs/post/758844 차세대 Strength 지표는 무엇을 제공합니까?  원래 지표에서 좋아했던 모든 것이 새로운 기능과 더 높은 정확도로 강화되었습니다. 주요 기능: 독점적인 통화 Strength 공식.  모든 시간대에 걸쳐 부드럽고 정확한 강도선. 추세와 정확한 진입을 식별하는 데 이상적입니다. 역동적인 시장 피보나치 수준(시장 피보나치).  이 지표에만 있는 고유한 기능. 가격 차트가 아닌 통화 강도에 피보나치가 적용됩니다.
Supply and Demand Dashboard PRO
Bernhard Schweigert
4.81 (21)
현재 30% 할인! 이 대시보드는 여러 기호와 최대 9개의 타임프레임에서 작동하는 매우 강력한 소프트웨어입니다. 주요 지표(최상의 리뷰: 고급 공급 수요)를 기반으로 합니다.   Advanced Supply Demand 대시보드는 훌륭한 개요를 제공합니다. 다음과 같이 표시됩니다.  영역 강도 등급을 포함하여 필터링된 공급 및 수요 값, 영역에 대한/및 영역 내 Pips 거리, 중첩된 영역을 강조 표시하고 모든 (9) 시간 프레임에서 선택한 기호에 대해 4가지 종류의 경고를 제공합니다. 그것은 당신의 개인적인 필요에 맞게 고도로 구성 가능합니다! 당신의 혜택! 모든 트레이더에게 가장 중요한 질문: 시장에 진입하기에 가장 좋은 수준은 무엇입니까? 최고의 성공 기회와 위험/보상을 얻으려면 강력한 공급/수요 영역 내 또는 그 근처에서 거래를 시작하십시오. 손절매를 위한 최적의 장소는 어디입니까? 가장 안전하려면 강력한 수요/공급 구역 아래/위에 정류장을 두십시오.
Atomic Analyst
Issam Kassas
5 (11)
이 제품은 2026년 시장에 맞게 업데이트되었으며 최신 MT5 빌드에 최적화되었습니다. 가격 업데이트 안내: Atomic Analyst는 현재 $99 에 제공됩니다. 다음 30회 구매 후 가격은 $199 로 인상됩니다. 특별 혜택: Atomic Analyst 구매 후 저에게 개인 메시지를 보내시면 Smart Universal EA를 무료 로 받을 수 있으며, Atomic Analyst 신호를 자동 거래로 전환할 수 있습니다. Atomic Analyst는 리페인트 없음, 재그리기 없음, 지연 없음의 Price Action 거래 인디케이터로, 수동 거래, 신호 명확성, EA 자동화를 위해 설계되었습니다. User manual: settings, inputs and strategy.     &   User Manual PDF . 가격 움직임, 강도, 모멘텀, 다중 시간대 방향 및 고급 필터를 분석하여 트레이더가 노이즈를 줄이고 약한 세팅을 피하며 더 체계적인 거래 결정을 내릴 수 있도
Super Signal – Skyblade Edition 전문가용 노리페인트 / 노래그 트렌드 신호 시스템, 뛰어난 승률 제공 | MT4 / MT5용 1분, 5분, 15분과 같은 낮은 타임프레임에서 가장 좋은 성능을 보입니다. 핵심 기능: Super Signal – Skyblade Edition은 추세 매매를 위해 설계된 스마트 신호 시스템입니다. 이 시스템은 다중 필터 로직을 활용하여, 명확한 방향성과 실질적인 모멘텀이 수반된 고품질 추세만을 감지합니다. 이 시스템은 고점 또는 저점을 예측하지 않으며 , 다음 세 가지 조건이 모두 충족될 때만 신호를 발생시킵니다: 명확한 추세 방향 강화되는 모멘텀 건전한 변동성 구조 또한, 시장 세션 기반의 유동성 분석을 통해 신호의 신뢰성과 타이밍을 더욱 향상시킵니다. 신호 특성: 모든 화살표 신호는 100% 리페인트 없음 / 지연 없음 신호가 한 번 발생하면 고정되며, 깜빡이거나 사라지지 않음 차트 상의 시각적 화살표, 정보 패널, 팝업 알
DayTrader PRO MT4
Davit Beridze
5 (1)
DayTrader PRO DayTrader PRO는 존 에러스(John Ehlers)의 Laguerre 필터와 강력한 자동 최적화 엔진을 결합한 고급 트레이딩 지표입니다. 고정된 파라미터를 사용하는 대신, 최근 시장 상황을 바탕으로 최적의 설정을 자동으로 검색하므로 지속적인 수동 조정 없이도 변화하는 시장 변동성에 대응할 수 있습니다. 이 지표는 명확한 매수(BUY) 및 매도(SELL) 신호를 생성하며, 현재 시장 변동성을 기준으로 계산된 적응형 손절매(Stop Loss) 및 익절(Take Profit) 레벨을 제공합니다. 내장된 추세, 효율성 지수(Efficiency Ratio), 변동성 및 캔들 필터 기능은 저품질의 진입 신호를 제거하여 신호의 정확도를 높여줍니다. 실시간 성능 대시보드에서는 현재 최적화된 설정값, 수익 요인(Profit Factor), 승률(Win Rate), 최대 낙폭(Drawdown) 및 기타 트레이딩 통계를 확인할 수 있습니다. 또한 DayTrader PR
Trend Catcher ind
Ramil Minniakhmetov
5 (11)
트렌드 캐처 인디케이터 트렌드 캐처 인디케이터는 개발자가 자체 개발한 맞춤형 적응형 트렌드 분석 지표들을 조합하여 시장 가격 움직임을 분석합니다. 단기적인 노이즈를 제거하고 근본적인 모멘텀 강도, 변동성 확대, 가격 구조 움직임에 집중하여 진정한 시장 방향을 파악합니다. 또한 이동 평균, RSI, 변동성 필터와 같은 맞춤형 지표들을 활용하여 가격을 평활화하고 트렌드를 필터링합니다. 실제 운영 모니터링 및 기타 제품은 다음 링크에서 확인하실 수 있습니다: https://www.mql5.com/en/users/mechanic/seller 텔레그램에서는 EA나 설정 파일을 판매하지 않습니다. 사기이니 주의하세요. 모든 설정 파일은 블로그에서 무료로 제공됩니다. 중요! 구매 후 즉시 연락 주시면 사용 방법 및 보너스를 드립니다!
Advanced Supply Demand
Bernhard Schweigert
4.91 (302)
현재 30% 할인! 초보자나 전문 트레이더를 위한 최고의 솔루션! 이 보조지표는 우리가 다수의 독창적 기능과 새로운 공식을 통합한 독특하고 고품질이며 저렴한 거래 도구입니다. 이 업데이트를 통해 이중 시간대를 표시할 수 있습니다. 더 높은 TF를 표시할 수 있을 뿐만 아니라 차트 TF와 더 높은 TF 모두를 표시할 수 있습니다: 중첩 영역 표시. 모든 Supply Demand 트레이더들이 좋아할 것입니다. :) 중요한 정보 공개 Advanced Supply Demand의 잠재력을 극대화하려면 다음을 방문하십시오. https://www.mql5.com/ko/blogs/post/720245   진입 또는 목표의 명확한 트리거 포인트를 정확히 찾아냄으로 해서 거래가 어떻게 개선될지 상상해 보십시오. 새로운 알고리즘을 기반으로 매수자와 매도자 간의 잠재적인 불균형을 훨씬 더 쉽게 분간할 수 있습니다. 왜냐하면 가장 강한 공급영역과 가장 강한 수요 영역과 과거에 어떻게 진행 되었는지를(이전
Currency Strength Exotics
Bernhard Schweigert
4.88 (33)
현재 20% 할인! 초보자 또는 전문가 트레이더를 위한 최고의 솔루션! 이 표시기는 Exotic Pairs Commodities, Indexes 또는 Futures와 같은 기호에 대한 통화 강도를 표시하는 데 특화되어 있습니다. 금, 은, 석유, DAX, US30, MXN, TRY, CNH 등의 진정한 통화 강도를 보여주기 위해 9번째 줄에 모든 기호를 추가할 수 있습니다. 이것은 독특하고 고품질이며 저렴한 거래 도구입니다. 우리는 많은 독점 기능과 새로운 공식을 통합했습니다. 새로운 추세 또는 스캘핑 기회의 정확한 트리거 포인트를 정확히 찾아낼 수 있기 때문에 거래가 어떻게 개선될지 상상해 보십시오. 사용 설명서: 여기를 클릭 https://www.mql5.com/en/blogs/post/708876 모든 시간대에 작동합니다. TREND를 빠르게 확인할 수 있습니다! 새로운 기본 알고리즘을 기반으로 설계되어 잠재적인 거래를 더욱 쉽게 식별하고 확인할 수 있습니다. 8개의
Neo Wave PRO
Nikolay Raykov
5 (1)
Price & Time Market Structure Indicator A professional market structure tool that analyzes waves through both price and time — not price alone. Main Description NeoWave PRO is a professional market structure indicator for MetaTrader 4 designed for traders who want to move beyond traditional one-dimensional wave tools such as ZigZag, swing indicators, and basic high/low systems. Most wave indicators analyze only one thing: Price. But a real market wave is not only a price movement. A true wave de
AW Candle Patterns MT4
AW Trading Software Limited
AW 양초 패턴 표시기는 강력한 양초 패턴 스캐너와 결합된 고급 추세 표시기의 조합입니다. 가장 신뢰할 수 있는 30개의 촛대 패턴을 인식하고 강조 표시하는 데 유용한 도구입니다. 또한 색상 막대를 기반으로 하는 현재 추세 분석기입니다.       크기를 조정하고 위치를 지정할 수 있는 플러그인 다중 시간 프레임 추세 패널. 트렌드 필터링에 따라 패턴 표시를 조정하는 고유한 기능. 장점: 캔들 패턴을 쉽게 식별 결과를 다시 그리지 않습니다 내장된 다중 시간 추세 패널 비활성화된 패턴 유형(1, 2, 3 촛불) 패턴 표시 시 트렌드 필터링 조정 MT5 version - >   HERE   / Instructions and description  -> HERE 표시된 패턴 목록: 망치 패턴 핀 업 / 핀 다운 약세 하라미 / 강세 하라미 Bearish Harami Cross / Bullish Harami Cross 피벗 포인트 반전 업 / 피벗 포인트 반전 다운 더 높은 종가와 함께 낮
Scalper Inside PRO
Alexey Minkov
4.74 (68)
Scalper Inside PRO helps you read the intraday trend and plan a trade before you enter the market. It is built around three exclusive strategies for a sharper read of the market. The moment a signal appears, the indicator evaluates market direction and calculates the key levels, so you see the potential entry, the expected stop-loss and several profit-taking levels in advance. Detailed performance statistics show how different instruments and strategies performed in history and help you pick ass
All in One Trade
Alexey Minkov
4.5 (28)
All-in-One Trade Indicator (AOTI) – Since 2015. The All-in-One Trade Indicator (AOTI) determines daily targets for EURUSD, EURJPY, GBPUSD, USDCHF, EURGBP, EURCAD, EURAUD, AUDJPY, GBPAUD, GBPCAD, GBPCHF, GBPJPY, AUDUSD, and USDJPY. All other modules work with any trading instruments. The indicator includes various features, such as Double Channel trend direction, Price channel, MA Bands, Fibo levels, Climax Bar detection, and others. The AOTI indicator is based on several trading strategies, and
Color Trend FX
Alexey Minkov
4.5 (4)
Color Trend FX shows the current trend direction and marks entry points, trailing levels and possible exit points right on the chart. The indicator is built for traders who want to see where to open, get hints on when to close, and check how it performed on history. It can work as a standalone tool, as part of your own system, or as a base for your Expert Advisors. The indicator plots signals as colored dots that follow the trend and also act as trailing levels for open positions. When the move

GOLD Impulse with Alert
Bernhard Schweigert
4.67 (12)
이 지표는 Advanced Currency IMPULSE with ALERT  +   Currency Strength Exotics  의 2가지 제품의 슈퍼 조합입니다. 그것은 모든 시간 프레임에 대해 작동하며 8개의 주요 통화와 하나의 기호에 대한 강약의 충동을 그래픽으로 보여줍니다! 이 표시기는 금, 이국적인 쌍, 상품, 지수 또는 선물과 같은 기호에 대한 통화 강도 가속을 표시하는 데 특화되어 있습니다. 금, 은, 오일, DAX, US30, MXN, TRY, CNH 등의 진정한 통화 강도 가속(충동 또는 속도)을 표시하기 위해 9번째 줄에 모든 기호를 추가할 수 있습니다. 새로운 기본 알고리즘을 기반으로 구축되어 잠재적인 거래를 훨씬 더 쉽게 식별하고 확인할 수 있습니다. 이는 통화의 강세 또는 약세가 가속되는지 여부를 그래픽으로 표시하고 가속 속도를 측정하기 때문입니다. 자동차의 속도계처럼 생각하면 됩니다. 가속화할 때 Forex 시장에서 동일한 일이 분명히 더 빠르
ECM Elite Channel is a volatility-based indicator, developed with a specific time algorithm, which consists of finding possible corrections in the market. This indicator shows two outer lines, an inner line (retracement line) and an arrow sign, where the channel theory is to help identify overbought and oversold conditions in the market. The market price will generally fall between the boundaries of the channel. If prices touch or move outside the channel, it's a trading opportunity. The ind

Smart Trend Trading System
Issam Kassas
4.71 (7)
이 제품은 2026년 시장에 맞게 업데이트되었으며 최신 MT5 빌드에 최적화되었습니다. 가격 업데이트 안내: Smart Trend Trading System은 현재 $99 에 제공됩니다. 다음 30회 구매 후 가격은 $199 로 인상됩니다. 특별 혜택: Smart Trend Trading System 구매 후 저에게 개인 메시지를 보내시면 Smart Universal EA를 무료 로 받을 수 있으며, Smart Trend 신호를 자동 거래로 전환할 수 있습니다. Smart Trend Trading System은 리페인트 없음, 재그리기 없음, 지연 없음의 완전한 트레이딩 시스템으로, 더 깨끗한 신호, 더 나은 추세 방향, 그리고 더 체계적인 시장 거래 방식을 원하는 트레이더를 위해 제작되었습니다. Online course , manual and [download presets] . 이 시스템은 추세 감지, 반전 구간, Smart Cloud, 트레일링 스톱 로직, 지지와 저항, 캔들
FX Power MT4 NG
Daniel Stein
4.95 (21)
FX Power: 통화 강세 분석으로 더 스마트한 거래 결정을 개요 FX Power 는 어떤 시장 상황에서도 주요 통화와 금의 실제 강세를 이해하기 위한 필수 도구입니다. 강한 통화를 매수하고 약한 통화를 매도함으로써 FX Power 는 거래 결정을 단순화하고 높은 확률의 기회를 발견합니다. 트렌드를 따르거나 극단적인 델타 값을 사용해 반전을 예측하고자 한다면, 이 도구는 귀하의 거래 스타일에 완벽히 적응합니다. 단순히 거래하지 말고, FX Power 로 더 스마트하게 거래하세요. 1. FX Power가 거래자에게 매우 유용한 이유 통화와 금의 실시간 강세 분석 • FX Power 는 주요 통화와 금의 상대적 강세를 계산하고 표시하여 시장 역학에 대한 명확한 통찰력을 제공합니다. • 어떤 자산이 앞서고 있고 어떤 자산이 뒤처지는지 모니터링하여 보다 현명한 거래 결정을 내릴 수 있습니다. 포괄적인 멀티 타임프레임 뷰 • 단기, 중기 및 장기 타임프레임에서 통화와 금의 강세를
Scalper Vault
Oleg Rodin
5 (37)
Scalper Vault 는 성공적인 스캘핑에 필요한 모든 것을 제공하는 전문 스캘핑 시스템입니다. 이 표시기는 외환 및 바이너리 옵션 거래자가 사용할 수 있는 완전한 거래 시스템입니다. 권장 시간 프레임은 M5입니다. 시스템은 추세 방향으로 정확한 화살표 신호를 제공합니다. 또한 상단 및 하단 신호와 Gann 시장 수준을 제공합니다.  이 시스템은 사용하기가 매우 쉽습니다. 원하는 시장 지역의 화살표만 따라가면 됩니다. 엑시트는 가격이 적정 수준에 도달하거나 시장의 고점 또는 저점 신호가 나타날 때 수행됩니다.  표시기는 PUSH 알림을 포함한 모든 유형의 경고를 제공합니다. 인디케이터 구매 후 연락주세요. 내 개인 거래 권장 사항과 훌륭한 보너스 지표를 무료로 공유합니다! 나는 당신에게 행복하고 유익한 거래를 기원합니다!
Volatility Trend System - a trading system that gives signals for entries. The volatility system gives linear and point signals in the direction of the trend, as well as signals to exit it, without redrawing and delays. The trend indicator monitors the direction of the medium-term trend, shows the direction and its change. The signal indicator is based on changes in volatility and shows market entries. The indicator is equipped with several types of alerts. Can be applied to various trading ins
Trend Lines PRO
Roman Podpora
5 (1)
트렌드 라인즈 프로       이 지표는 시장이 실제로 어떤 방향으로 전환되는지 파악하는 데 도움이 됩니다. 실제 추세 반전 지점과 주요 시장 참여자들이 다시 진입하는 지점을 보여줍니다. 보시다시피       BOS 라인       복잡한 설정이나 불필요한 노이즈 없이 더 높은 시간대의 추세 변화와 주요 레벨을 확인할 수 있습니다. 신호는 차트에 다시 그려지지 않고 캔들이 마감된 후에도 계속 표시됩니다. VERSION MT 5   -   RFI LEVELS PRO   표시기   와 결합할 때 최대 잠재력을 발휘합니다. 지표가 보여주는 내용: 실제 변화       추세(BOS 라인) 한 번 신호가 나타나면 그 신호는 계속 유효합니다! 이는 신호를 발생시킨 후 변경될 수 있는 리페인팅 방식의 지표와 중요한 차이점입니다. 리페인팅 방식의 지표는 잠재적으로 자금 손실로 이어질 수 있습니다. 이제 더욱 높은 확률과 정확도로 시장에 진입할 수 있습니다. 또한 화살표가 나타난 후 목표가(익절)
Volume Break Oscillator는 가격 움직임을 오실레이터 형태로 볼륨 추세와 일치시키는 지표입니다. 저는 볼륨 분석을 제 전략에 통합하고 싶었지만 OBV, Money Flow Index, A/D, Volume Weighted Macd 및 기타 여러 지표와 같은 대부분의 볼륨 지표에 항상 실망했습니다. 그래서 저는 이 지표를 직접 작성했고, 얼마나 유용한지 만족스러워서 시장에 공개하기로 결정했습니다. 주요 기능: 가격이 볼륨 증가(브레이크)로 지원되는 방향으로 움직이는 단계를 강조합니다. 볼륨 증가가 멈추고 시장이 수축되는 단계를 강조합니다. 특히 시간 프레임(<=15분)이 있는 일중 거래에서 가격이나 볼륨이 움직이지 않아 시장이 향후 상승에 대비하는 단계를 강조합니다. 볼륨 증가로 지원되지 않는 다른 전문가 자문가의 거짓 신호를 걸러냅니다. 추세와 범위 단계를 시각화하는 것이 매우 쉽습니다. 입력 매개변수: 계산 설정: 계산 유형: FAST, NORMAL, S
Currency Strength Wizard
Oleg Rodin
4.85 (60)
통화 강도 마법사는 성공적인 거래를 위한 올인원 솔루션을 제공하는 매우 강력한 지표입니다. 표시기는 여러 시간 프레임의 모든 통화 데이터를 사용하여 이 또는 해당 외환 쌍의 힘을 계산합니다. 이 데이터는 특정 통화의 힘을 확인하는 데 사용할 수 있는 사용하기 쉬운 통화 지수 및 통화 전력선의 형태로 표시됩니다. 필요한 것은 거래하려는 차트에 표시기를 부착하는 것뿐입니다. 표시기는 거래하는 통화의 실제 강세를 보여줍니다. 지표는 또한 추세와 거래할 때 유리하게 사용할 수 있는 구매 및 판매 거래량 압력의 극한값을 보여줍니다. 지표는 또한 피보나치에 기반한 가능한 대상을 보여줍니다. 표시기는 PUSH 알림을 포함한 모든 유형의 알림을 제공합니다. 구매 후 연락주세요. 나는 당신과 거래 팁을 공유하고 당신에게 무료로 훌륭한 보너스 지표를 줄 것입니다! 나는 당신에게 행복하고 유익한 거래를 기원합니다!
Linear Trend Predictor - 진입 지점과 방향성 지원선을 결합한 추세 지표입니다. 고가/저가 채널을 돌파하는 원칙에 따라 작동합니다. 지표 알고리즘은 시장 노이즈를 걸러내고 변동성과 시장 역학을 고려합니다. 표시기 기능  평활화 방법을 사용하여 시장 추세와 BUY 또는 SELL 주문을 시작하기 위한 진입 시점을 보여줍니다.  모든 기간의 차트를 분석하여 단기 및 장기 시장 움직임을 파악하는 데 적합합니다.  어떠한 시장과 시간대에도 적용할 수 있으며, 입력 매개변수를 통해 거래자는 자신에게 맞게 지표를 독립적으로 사용자 지정할 수 있습니다.  설정된 지표 신호는 사라지거나 다시 그려지지 않습니다. 이는 캔들 마감 시 결정됩니다.  여러 유형의 알림이 화살표와 결합되어 있습니다.  이 지표는 독립적인 거래 시스템으로 사용할 수도 있고, 다른 거래 시스템에 추가하는 용도로도 사용할 수 있습니다.  모든 수준의 경험을 가진 거래자가 사용할 수 있습니다. 주요 매
제작자의 제품 더 보기
Gold Session Liquidity Map
Martin Dennis Coman
5 (1)
GOLD SESSION LIQUIDITY MAP Gold Session Liquidity Map is a multi-market MT4 indicator for session structure, liquidity, breakout probability, Fibonacci mapping and multi-timeframe momentum. Originally developed around Gold/XAUUSD, it can also be used on Forex, Oil, indices and cryptocurrencies. Calculations use the current chart symbol and timeframe. The indicator is built around three questions: LOCATION - Where is price relative to session structure? DIRECTION - Which side currently has st
Gold Phase Detector
Martin Dennis Coman
Gold Phase Detector Gold Phase Detector is a MetaTrader 4 indicator designed to display RSI momentum, moving average alignment, and market phase conditions in a visual format. The indicator uses RSI, an RSI moving average, and a 5/13 moving average structure to help traders observe whether market conditions are trending, correcting, weakening, or transitioning. Gold Phase Detector is intended for chart analysis. It does not open, close, or manage trades. Main Features RSI phase coloring RSI 50 l
Gold Hidden Wick Levels
Martin Dennis Coman
Gold Wick Support Resistance Map is a professional MT4 wick-reaction mapping indicator designed to help traders read hidden price reaction areas created by candle wicks, liquidity sweeps, rejection points, breakout zones, and market structure. Most support and resistance tools focus on simple highs, lows, or candle-body levels. This indicator takes a different approach. It focuses on wick structures, because wicks often show where price tested liquidity, reacted strongly, rejected, or completed
Liquidity zones
Martin Dennis Coman
Wick & Liquidity Zones Tracker – Advanced Gold & Forex Cluster Indicator “See Where Big Players Move — Trade Gold & Forex Like an Insider!” Liquidity Zones instantly reveals hidden liquidity clusters, swing reversals, and breakout points, giving you the edge most traders only dream of. Key Features  Liquidity Zone Detection: Automatically identifies unbalanced bullish & bearish candles , marking zones where price is likely to reverse or accelerate. Cluster Analysis: Groups consecutive candles
Gold Weekly Trap Zones
Martin Dennis Coman
Gold Weekly High Trap Zones Weekly High Trap Zones   is a clean MT4 weekly range-mapping indicator designed to help traders identify the key trap zone created around the current week’s high. The indicator finds the current weekly high, identifies the session range connected to that high, and then projects a structured trap-zone ladder from that range. It displays the important weekly high origin level, trap zone top and bottom, 100 level, 161.8 target, 261.8 target, and optional higher extensio
SmartADR v2.80 SmartADR v2.80   is an advanced Average Daily Range mapping indicator for MetaTrader 4. It is designed to help traders build a clear intraday range map using the Daily Open, ADR high/low projections, Fibonacci reaction levels, ADR zones, and previous unbroken ADR targets. Instead of showing only a simple ADR high and ADR low, SmartADR creates a full visual structure around the market open. This allows traders to see where price may expand, pause, reject, pull back, or complete it
Gold Regime Divergence
Martin Dennis Coman
GC Regime Divergence Panel GC Regime Divergence Panel   is a compact multi-timeframe market condition dashboard for MT4. It is designed to help traders quickly read trend regime, pullback conditions, and RSI divergence across multiple timeframes without switching charts. The indicator displays a clean on-chart panel showing each timeframe, the current market regime, and any detected RSI divergence. It combines moving average structure, MA gap behavior, RSI pressure, RSI 34SMA comparison, and s
RSI 34 Last Range Tracker RSI 34 Last Range Tracker   is a visual range-tracking indicator for MT4 that helps traders identify the most recent RSI momentum shift and project the important reaction zone from that candle. The indicator tracks crosses between RSI and its 34-period RSI moving average. When a bullish or bearish RSI cross occurs, the indicator marks the cross candle with a dot and draws the related price range, including the candle high, candle low, and the important 38.2 / 61.8 mi
GC Volume Profile GC Volume Profile   is a professional MT4 volume profile indicator designed to help traders see where market activity is concentrated, where buyers and sellers are positioned, and where important volume-based reaction zones may exist. The indicator builds a horizontal tick-volume profile directly on the chart using either a fixed lookback range or the visible chart area. It separates bullish and bearish volume, highlights important volume nodes, shows the Point of Control, di
Daily Weekly Monthly Open Map Daily Weekly Monthly Open Map   is a clean price-level mapping indicator for MT4 that helps traders track important open-price levels across the daily, weekly, and monthly market structure. If you purchase this indicator i will give you a free 40 minute zoom session one to one on how to use this. Many markets repeatedly react around previous daily, weekly, and monthly open prices. These levels can act as support, resistance, liquidity targets, unfinished-business a
MTF Phase Engine Mini Dashboard MTF Phase Engine Mini Dashboard   is a compact multi-timeframe market condition panel designed for traders who want to read trend phase, RSI pressure, moving average structure, and momentum strength quickly across multiple timeframes. Instead of loading several indicators or switching between charts, this dashboard displays the key condition data for M1, M5, M15, M30, H1, H4, D1, W1, and MN in one clean on-chart panel. The indicator combines 5/13 moving average
Daily Open Mirror Engine — Wick & Body Mirror Levels for MT4 Daily Open Mirror Engine   is a professional MetaTrader 4 indicator designed to project mirrored price levels from the current daily open. Many intraday moves react strongly around the daily open. This indicator uses the daily open as the central reference point and automatically projects mirrored levels from important wick and body extremes, helping traders identify possible reaction zones, liquidity targets, support, resistance, an
Gold Swing Volume Phase
Martin Dennis Coman
Swing Volume Phase Swing Volume Phase   is a visual market-structure and volume-pressure indicator designed to help traders quickly understand who is controlling the current move:   buyers or sellers . Instead of looking at candles alone, this tool focuses on the volume behind important swing highs, swing lows, and completed price legs. It helps identify whether the current market phase is being supported by stronger buying pressure, stronger selling pressure, or a possible shift in control. T
MA Gap Tracker Engine — Multi-Timeframe 5/13 SMMA Distance & Trend Panel for MT4 MA Gap Tracker Engine   is a professional MetaTrader 4 indicator designed to track the live relationship between price, the 5 SMMA, and the 13 SMMA across multiple timeframes. This tool helps traders quickly see whether price is above or below the moving averages, whether the 5/13 MA structure is bullish or bearish, and most importantly, whether the moving average gap is   expanding, shrinking, or flat . Instead of
Session Liquidity Map Engine — Sydney, Asia, German, UK & US Range Structure for MT4 Session Liquidity Map Engine   is a professional MetaTrader 4 indicator designed to map the most important intraday trading sessions directly on your chart. The indicator automatically draws key session boxes, tracks session highs and lows, identifies active and taken liquidity levels, and displays a compact real-time information panel so traders can quickly understand where price is in relation to the major ma
Monday Asia Weekly Fib Engine — Weekly Session Projection Levels for MT4 Monday Asia Weekly Fib Engine   is a MetaTrader 4 indicator designed to project key weekly Fibonacci levels from the   Monday Asia trading session range . If you purchase this indicator i will give you a free 40 minute zoom session one to one on how to use this. Many weekly moves begin with a clear liquidity range during the early Asia session. This indicator automatically identifies that Monday Asia range and projects F
This dashboard shows you what is happening on all timeframes at the sametime. State - tells you what state that timeframe is currently in. R34 - tells you how many candles have closed above or below the 34sma G5 - tells you how far the price is from the 5sma moving average G13 - tells you how far the price is from the 13sma moving average RD - this tells you how far RSI is from the 34sma 34v50 - this tells you how far the 34sma is from 50 Gap - this tells you the current gap between the 5sma a
Dynamic Gap Engine
Martin Dennis Coman
GapZone Pro – Dynamic Gap Trading Engine for MT4 The Gap That Evolves with the Market Most gap indicators detect a gap once, draw a box, and never change it again. GapZone Pro is different. Its proprietary Dynamic Gap Engine continuously recalculates the active market gap as price evolves. As the size of the gap expands or contracts, every Fibonacci level, retracement zone, and distance calculation updates automatically in real time. Instead of trading yesterday's gap, you're trading the marke
Gold Session Trap Distance Map Gold Session Trap Distance Map is a clean intraday liquidity-mapping indicator designed for XAUUSD traders who want to track where price still has unfinished business from major trading sessions. Instead of filling the chart with random support and resistance, this indicator focuses on one simple idea: unbroken session trap zones can act like future liquidity magnets. The indicator tracks key session trap areas from the major trading periods and displays live dista
Gold Fuel
Martin Dennis Coman
Gold Fuel  is a professional MT4 chart-mapping indicator designed for traders who study price-leg movement, candle structure, reaction zones, and 161.8 completion targets. The indicator uses a selected market leg as the active structure, then automatically projects the working direction and displays the relevant zone and target map. It shows only the active directional zone, helping keep the chart clean and focused. When the selected leg projects downward, the indicator displays the active sell
Gold Swing Break Target Map is a MetaTrader 4 indicator designed to display projected target levels after a confirmed swing high or swing low is broken. The indicator is intended to help traders answer a common chart question: If price breaks this swing high, where could it continue upward? If price breaks this swing low, where could it continue downward? The tool does not open, close, or manage trades. It is designed for chart analysis and discretionary trading decisions. Main Purpose Gold Swin
CrossMap MTF MA Zones
Martin Dennis Coman
Stop switching between charts just to understand the moving-average structure. CrossMap MTF MA Zones brings every important crossover, gap, age, and origin zone onto one chart. CrossMap MTF MA Zones is a clean, fully adjustable multi-timeframe moving-average indicator designed to show where each crossover began, how mature it is, and whether the distance between the averages is expanding or shrinking. The indicator can monitor every standard timeframe from M1 to MN1 while displaying only the ti
필터:
리뷰 없음
리뷰 답변