AZ Speedometer
- 지표
- 버전: 2.2

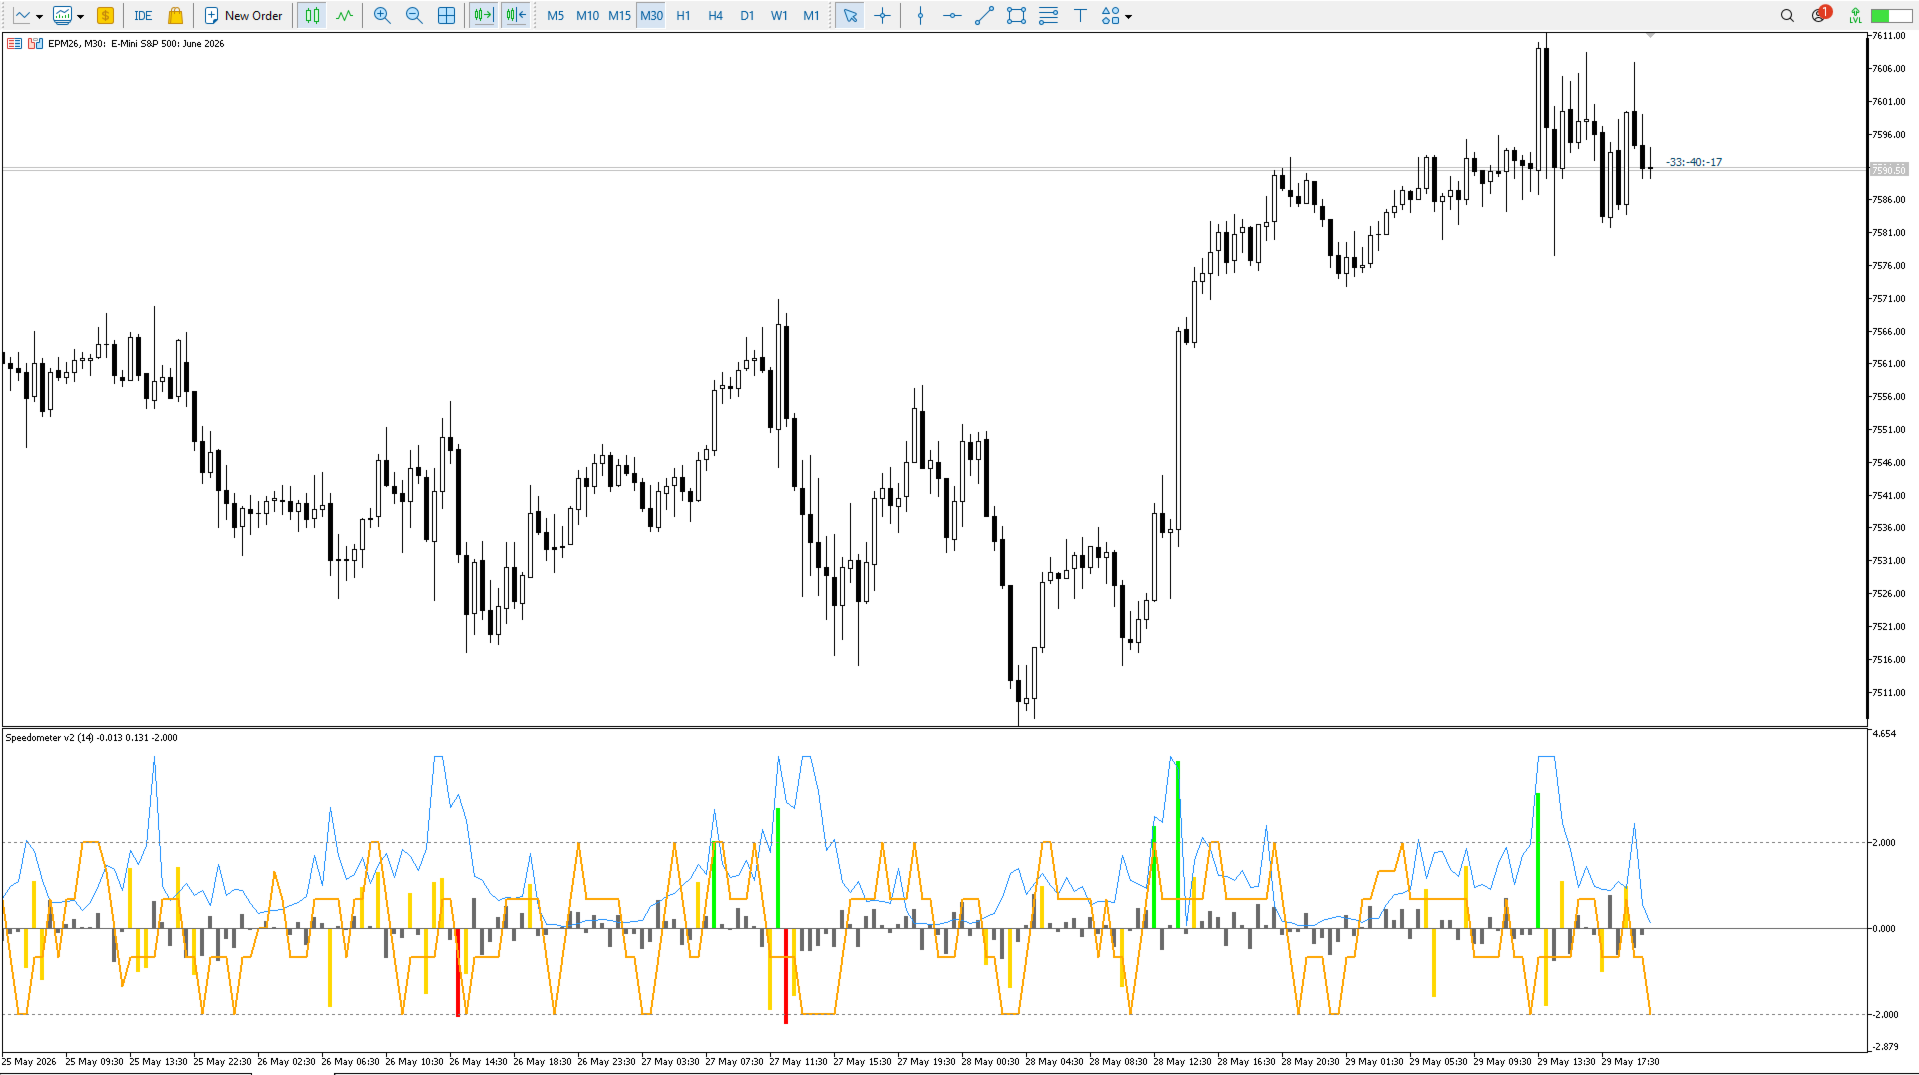
Az Speedometer measures price impulse quality — not just candle size, but whether that move is backed by real momentum, volume, and direction. A single glance tells you if the current bar is a meaningful push or just noise.
"A green bar alone means nothing. Az Speedometer shows you green bars with high volume, a clean candle body, and three consecutive bullish closes — that's a signal worth taking."
How it works:
Speed ratio: Candle range vs ATR — how fast is price moving relative to its average
Candle quality: Body-to-range ratio — a marubozu scores 1.0, a doji near 0
Volume confirmation: Tick volume vs rolling average — high-volume impulses score higher
DOM bias: Real-time order book imbalance boosts or reduces the live bar score
Reading the indicator
| Visual | Meaning |
|---|---|
| Green bar ↑ | Strong bullish impulse above Fast threshold |
| Red bar ↓ | Strong bearish impulse below Fast threshold |
| Yellow bar | Average momentum — watch, don't rush |
| Blue line | Volume ratio — above 1.5× confirms the move |
| Orange line | Streak — consecutive candles in one direction |
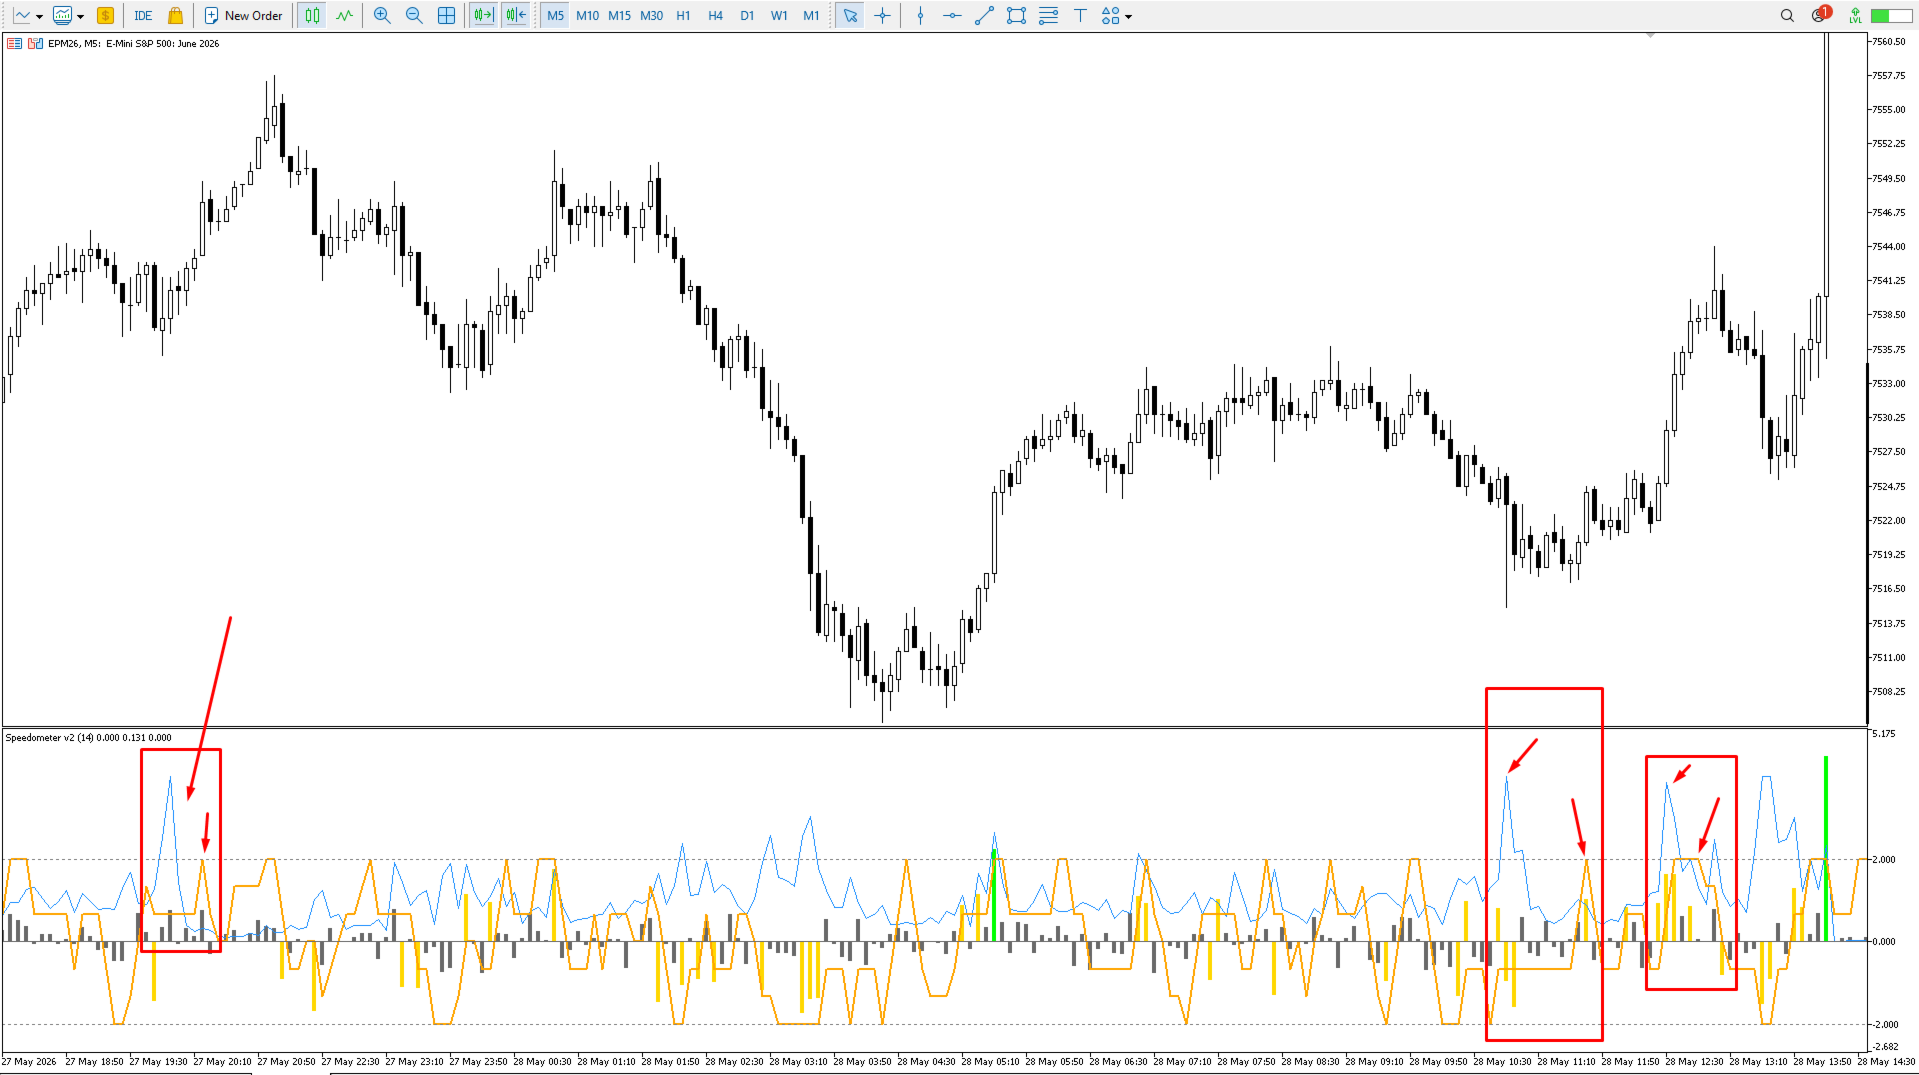
Best signal setup
Green or red bar · Blue line above 1.5 · Orange line at ±1 extreme · DOM bias confirmed on live bar. All four together = high-conviction impulse.
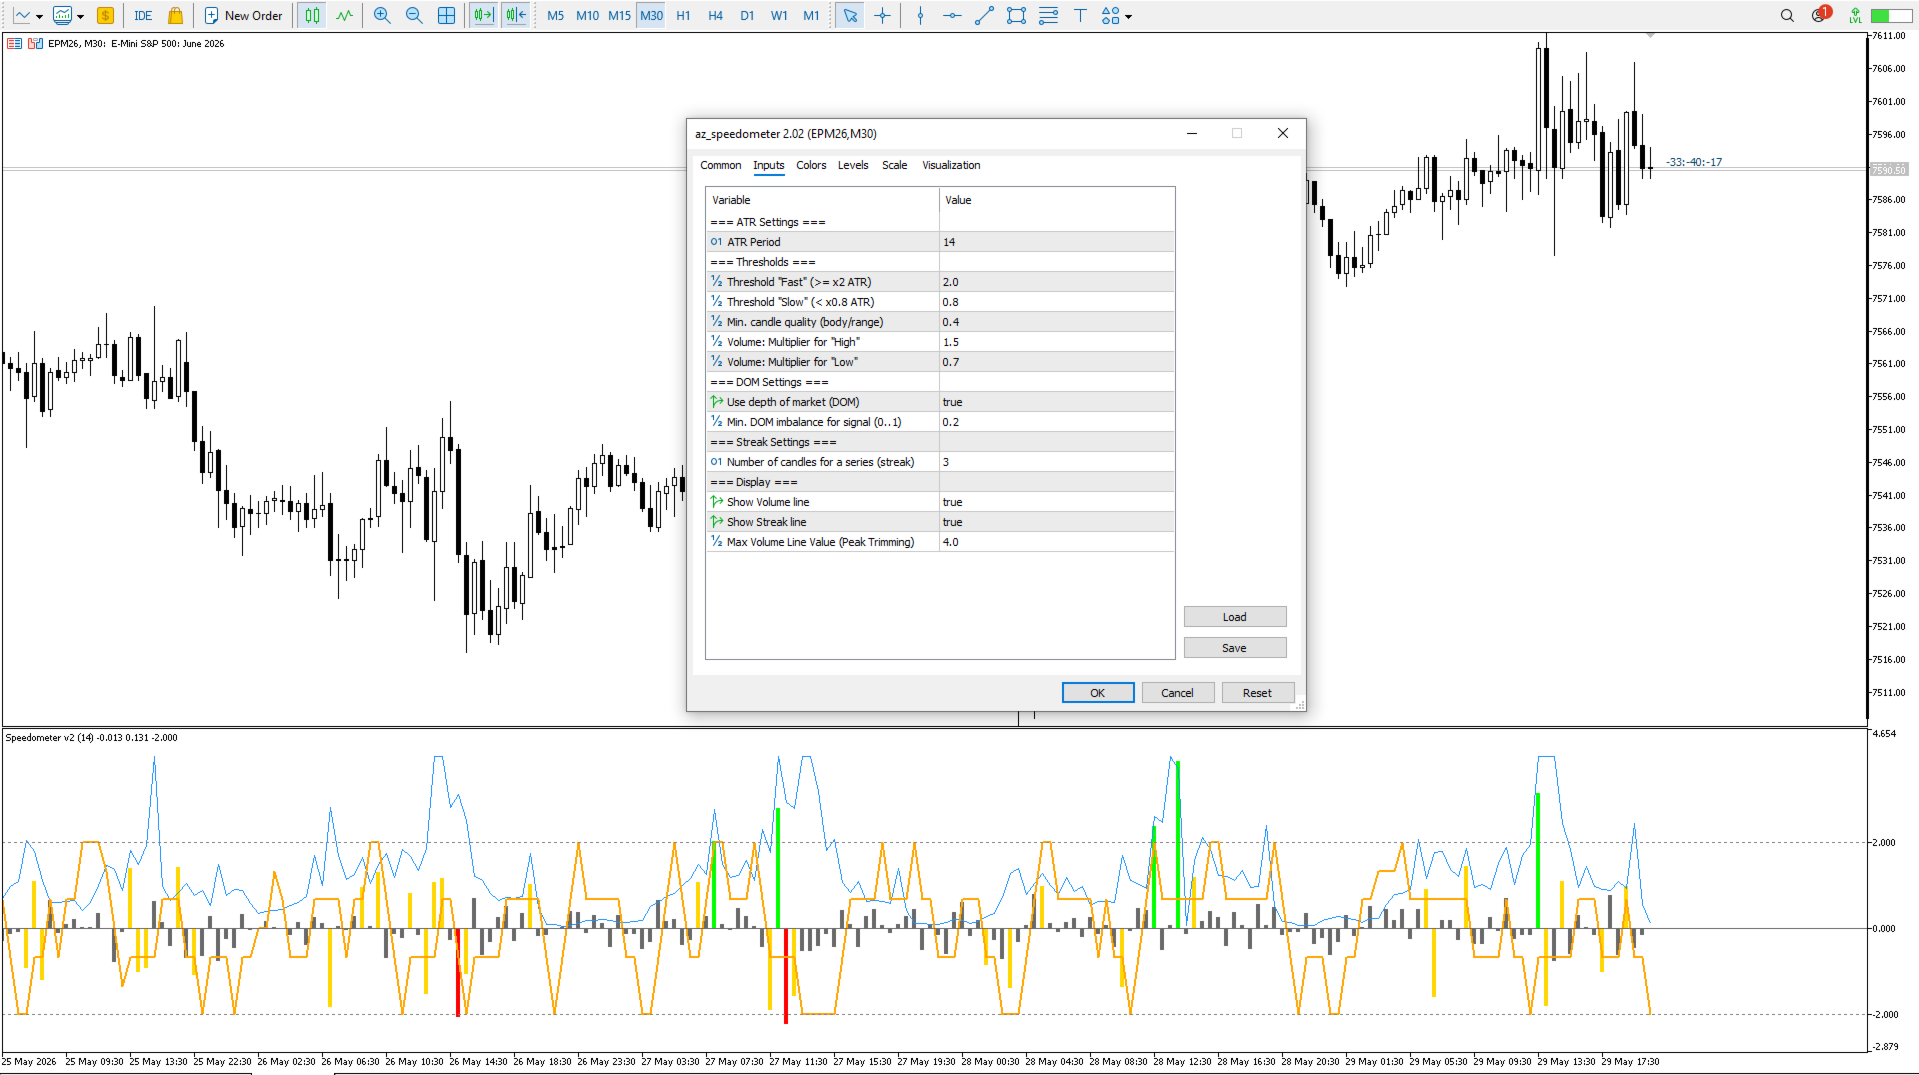
Fully configurable — ATR period, fast/slow thresholds, candle quality floor, volume multipliers, DOM sensitivity, and streak lookback. Works on any symbol and timeframe.
P.S. All my indicators were originally developed for use with a futures broker, but can also work on the spot (CFD) market.