QuantHubCommander
- 유틸리티
- 버전: 1.0

当然,下面这版是适合直接放到市场页面里的 英文版本:
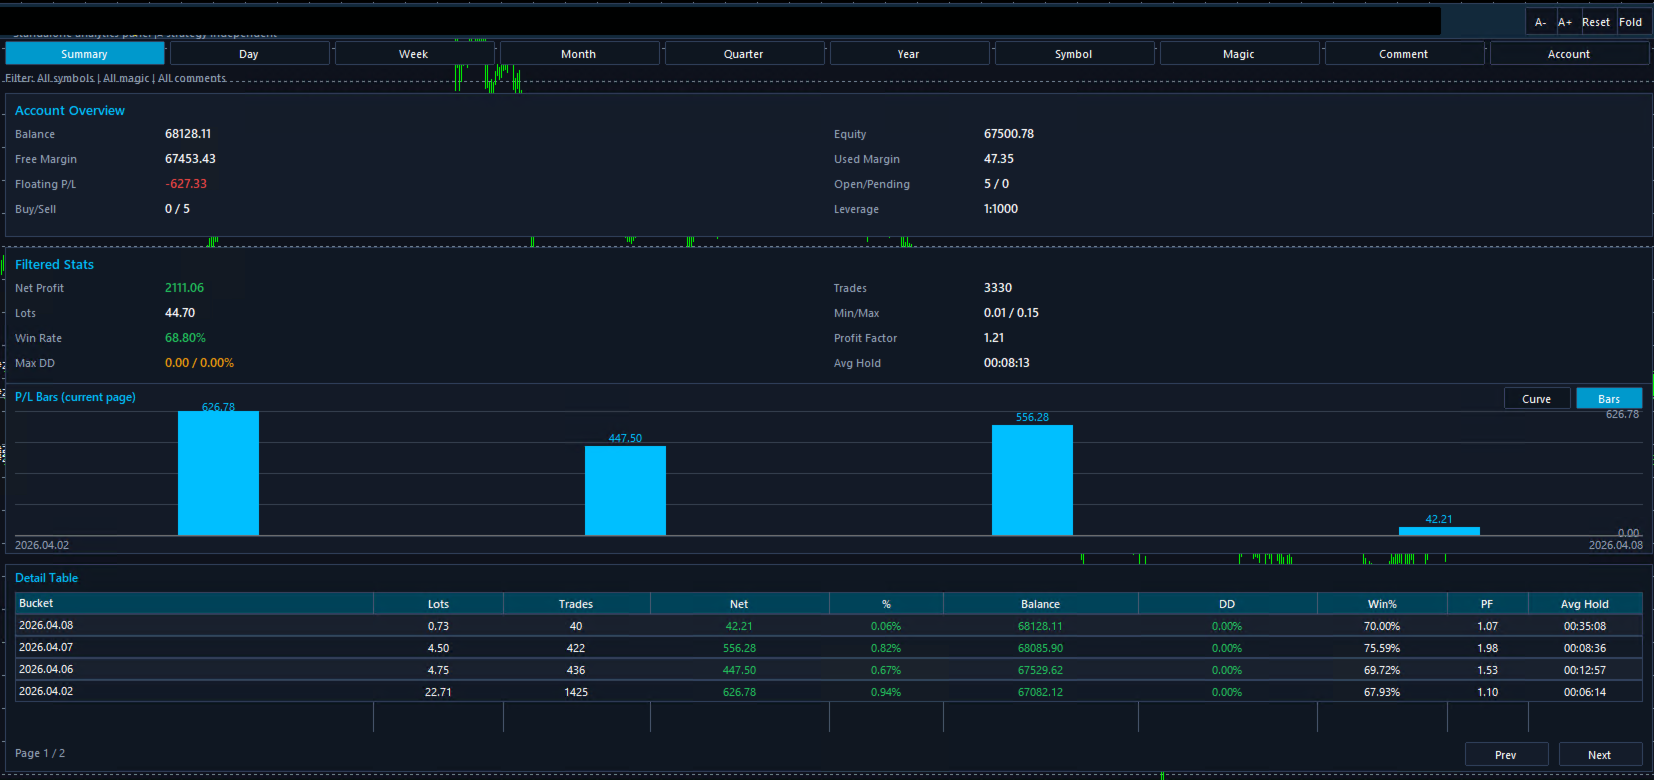
Product OverviewQuantHubCommaner Dashboard for MT4 is a trading statistics and analysis tool designed specifically for MetaTrader 4.
It does not open, modify, or close trades, and it does not interfere with any trading strategy. Its purpose is to display account status and historical trading performance in a clear, visual, and easy-to-read dashboard.
With this panel, users can quickly review trading results across different time periods and filter data by Symbol, Magic Number, Comment, and Account. It is suitable for both manual traders and EA users who want a more efficient way to review and evaluate performance.
This tool is especially useful for:
-
Monitoring overall account performance
-
Analyzing the real results of a specific EA or trading system
-
Comparing performance across different time periods
-
Reviewing key metrics such as win rate, drawdown, profit factor, and average holding time
-
Making trade history easier to understand through charts and detail tables
1. Clear Account Overview
The dashboard displays important account information in one place, including:
-
Balance
-
Equity
-
Free Margin
-
Floating P/L
-
Used Margin
-
Open / Pending Orders
-
Leverage
-
Buy / Sell Position Count
This allows users to understand the current account status without switching between multiple windows.
2. Multi-Period Performance Analysis
Supports multiple reporting periods:
-
Summary
-
Day
-
Week
-
Month
-
Quarter
-
Year
Users can review short-term performance or analyze longer-term results depending on their needs.
3. Automatic Trading Statistics
The dashboard automatically calculates and displays core performance metrics, including:
-
Net Profit
-
Lots
-
Trades
-
Win Rate
-
Max Drawdown
-
Profit Factor
-
Min / Max Lot
-
Average Holding Time
These metrics help users evaluate strategy stability, profitability, and risk more efficiently.
4. Visual Chart Display
Built-in chart visualization makes the results easier to understand at a glance.
Compared with raw numbers alone, charts make it easier to spot profit distribution, performance changes, and general trading trends.
5. Detailed Table for Review
A detailed statistics table is included for deeper analysis. It can display information such as:
-
Time bucket
-
Lots
-
Number of trades
-
Net profit
-
Profit percentage
-
Balance
-
Drawdown
-
Win %
-
Profit Factor
-
Average holding time
This is especially useful for trade review and comparing results across different periods.
6. Flexible Data Filtering
The dashboard supports filtering by:
-
Symbol
-
Magic
-
Comment
-
Account
This is very helpful for traders running multiple strategies, symbols, or systems on the same account, because each group of trades can be analyzed separately.
7. Analysis Only, No Trade Execution
This product is designed purely for statistics and visualization.
It does not place trades and does not affect existing trading operations.
Below is a general English parameter description template. You can replace the names with your actual input parameter names if needed.
Basic Display Parameters
Statistics Period
Selects the reporting period, such as Summary, Day, Week, Month, Quarter, or Year.
Show Dashboard
Enables or disables the main statistics panel.
Auto Refresh
Automatically refreshes the statistics data.
Refresh Interval
Sets the refresh interval for updating data.
Filter Parameters
Filter Symbol
Filters statistics by trading symbol.
Filter Magic
Filters statistics by Magic Number.
Filter Comment
Filters statistics by order comment.
Filter Account
Filters results by account.
Chart Parameters
Chart Mode
Selects the chart display mode, such as curve or bar chart.
Bars Per Page
Defines how many grouped results are shown in the current chart page.
Show Profit Labels
Shows or hides profit value labels on the chart.
Sync Chart With Table
Keeps the chart synchronized with the table pagination.
Table Parameters
Rows Per Page
Sets how many rows are displayed in the detail table per page.
Default Page
Defines the default page shown when opening the table.
Show Detail Table
Enables or disables the detail table.
Interface Parameters
Panel Position X
Horizontal position of the panel.
Panel Position Y
Vertical position of the panel.
Panel Width
Width of the dashboard panel.
Panel Height
Height of the dashboard panel.
Font Size
Controls the display font size.
Color Theme
Changes the dashboard color style.
1. Use It on a Separate Chart
For the best viewing experience, it is recommended to load the dashboard on a dedicated chart window.
2. Use Filters for Multi-Strategy Accounts
If multiple EAs or systems are running on the same account, use Magic or Comment filters to analyze each strategy separately.
3. Review Performance by Period
Start with Summary for an overall view, then switch to Day, Week, or Month to identify changes and patterns over time.
4. Use Charts and Tables Together
Charts help visualize trends, while tables provide precise details. Using both together gives a more complete performance review.
5. Suitable for Both Manual and EA Trading
Whether trades are placed manually or by an Expert Advisor, this tool helps present the results in a much more organized and readable way.
Notes1. This Is Not a Trading EA
This product is for statistics and visualization only. It does not manage or execute trades.
2. Results Depend on Account History
All displayed data is based on the account history and current account information available in MT4. Incomplete history may affect the results.
3. Filters Affect the Displayed Results
When Symbol, Magic, Comment, or other filters are enabled, only matching data will be shown. This is expected behavior.
4. This Tool Is for Analysis Purposes
The dashboard is intended to help users review trading performance. It does not provide financial advice or guarantee results.
5. Load Full History for Best Accuracy
For the most accurate statistics, make sure MT4 has fully loaded the required account history before reviewing the dashboard.
Turn raw trade history into a clear, visual, and easy-to-review performance dashboard.