Velox Trigger VTRSI
- 지표
-
Masayuki Yano
 Trading should be simple.
I develop tools to strip away market noise and provide clear, visual conviction.
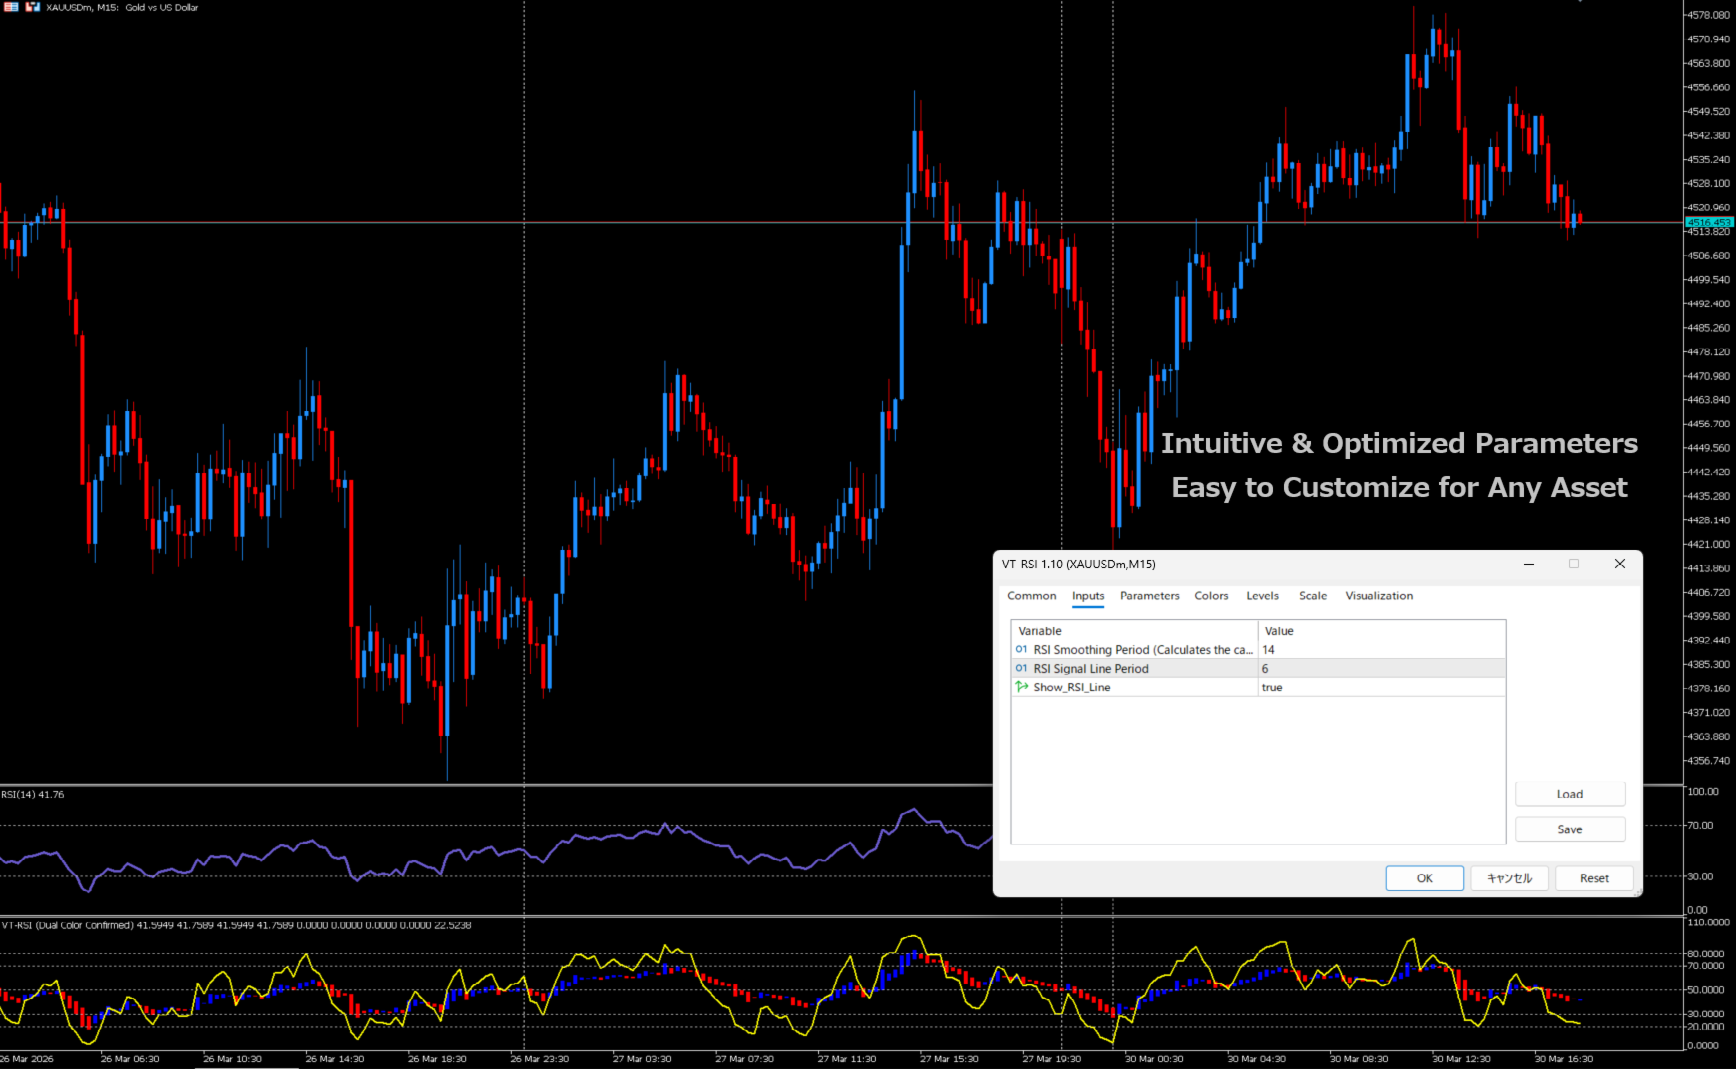
No over-complicated theories—just intuitive indicators designed for decisive execution.
If you're tired of hesitation, my tools are built for you." - 버전: 1.10
- 활성화: 5
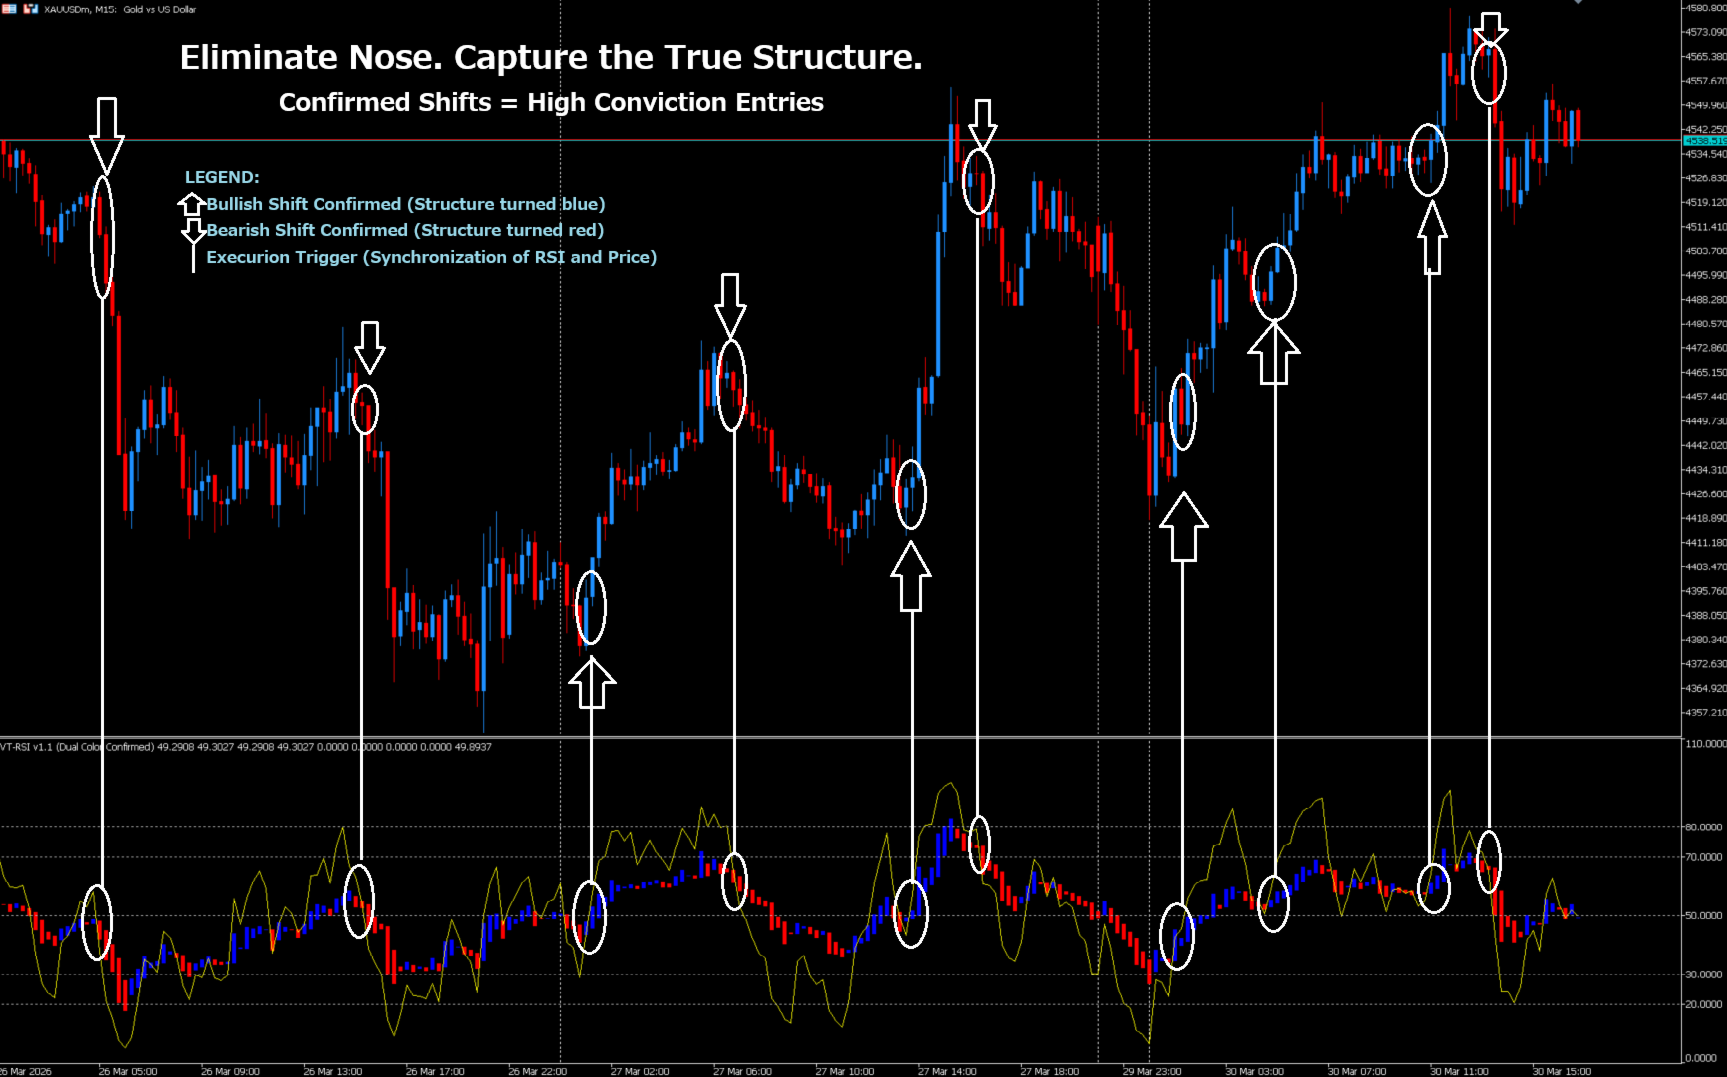
Stop chasing noise. Start capturing the true structure.
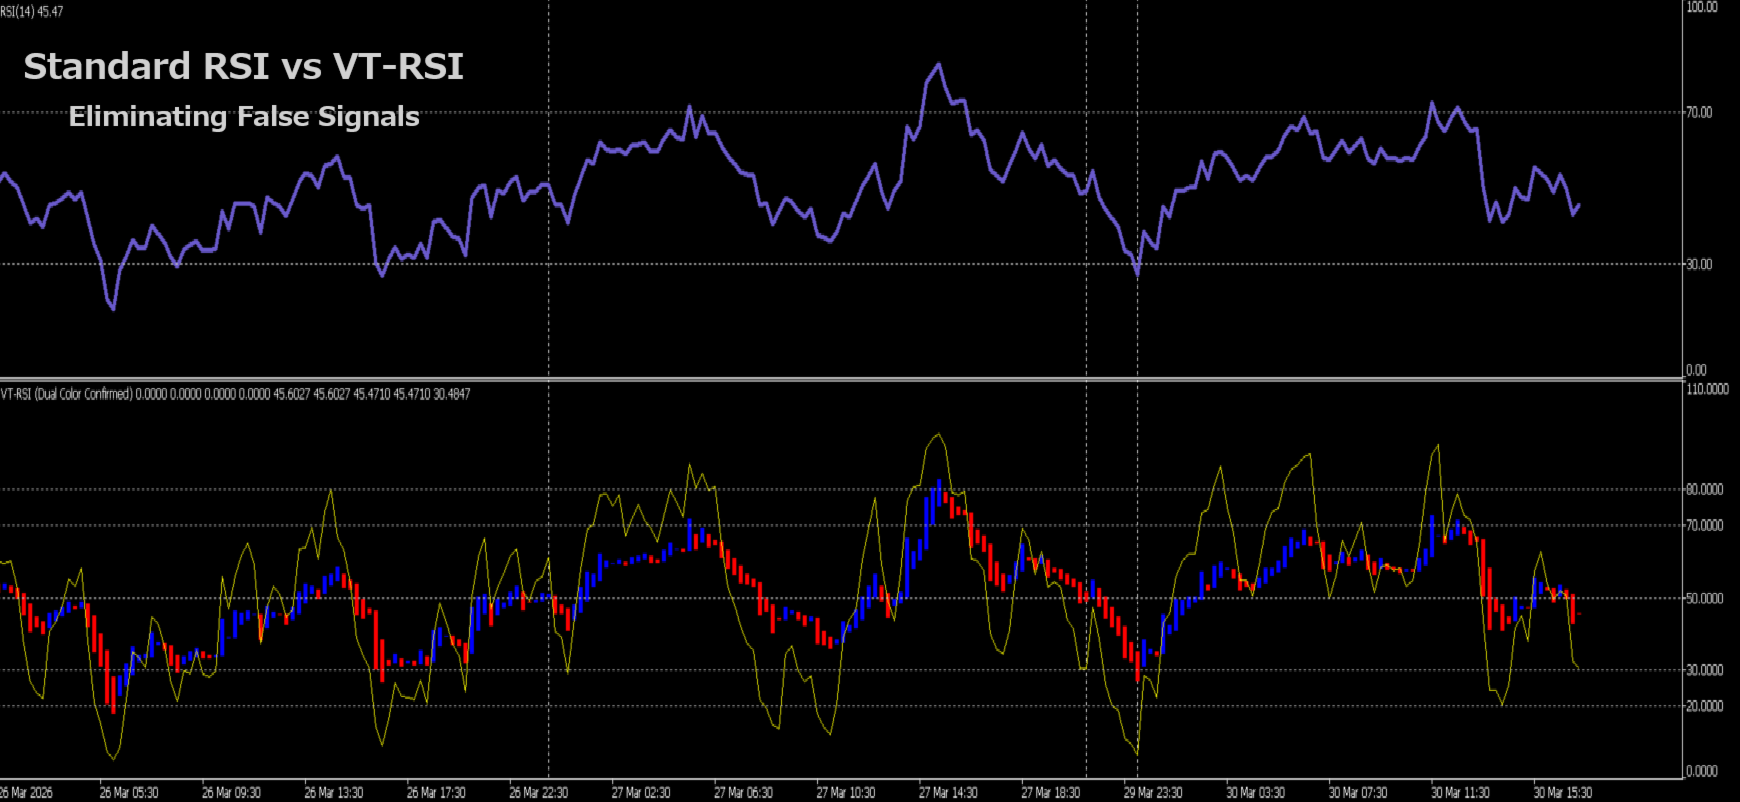
Many traders fail not because their strategy is wrong, but because they react too late to price movements. Standard RSI often provides lagging signals or fluctuates wildly in choppy markets, leading to false entries.
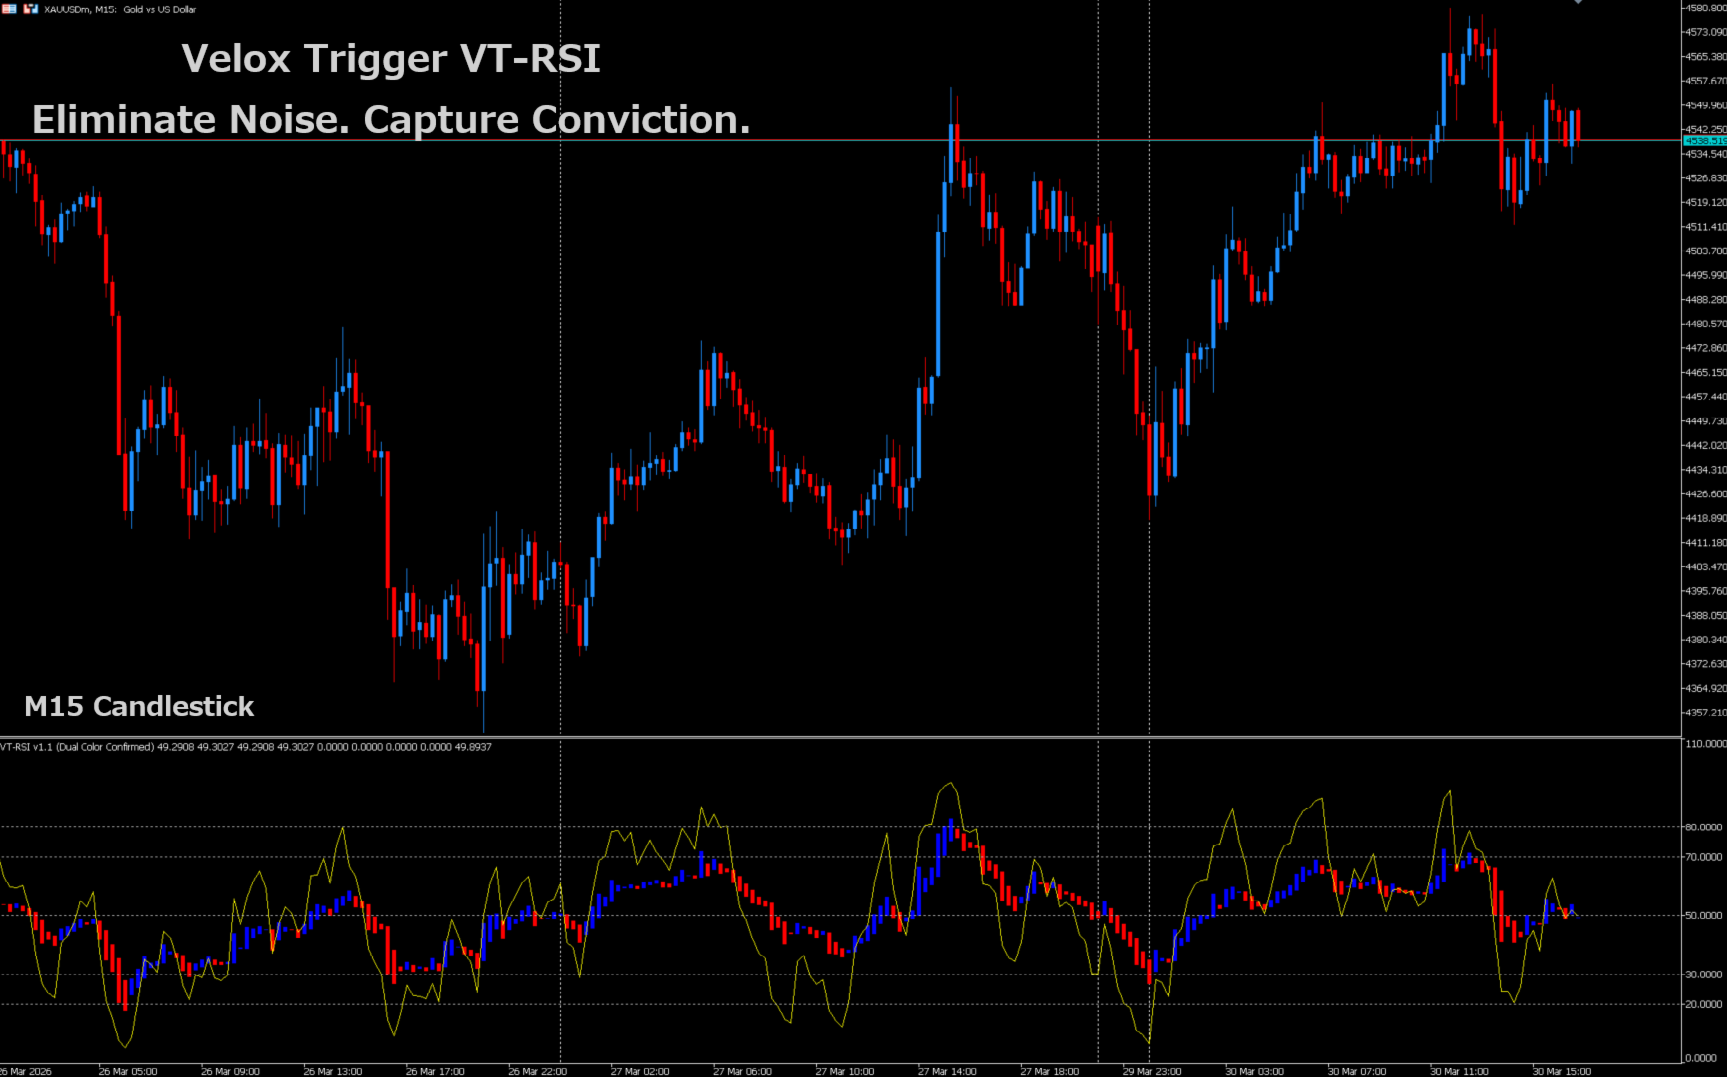
Velox Trigger VT-RSI was developed to eliminate this "Lag" and "Noise." By redefining RSI as a structural momentum indicator, it allows you to detect trend shifts before they become obvious to the crowd.
Key Features:
-
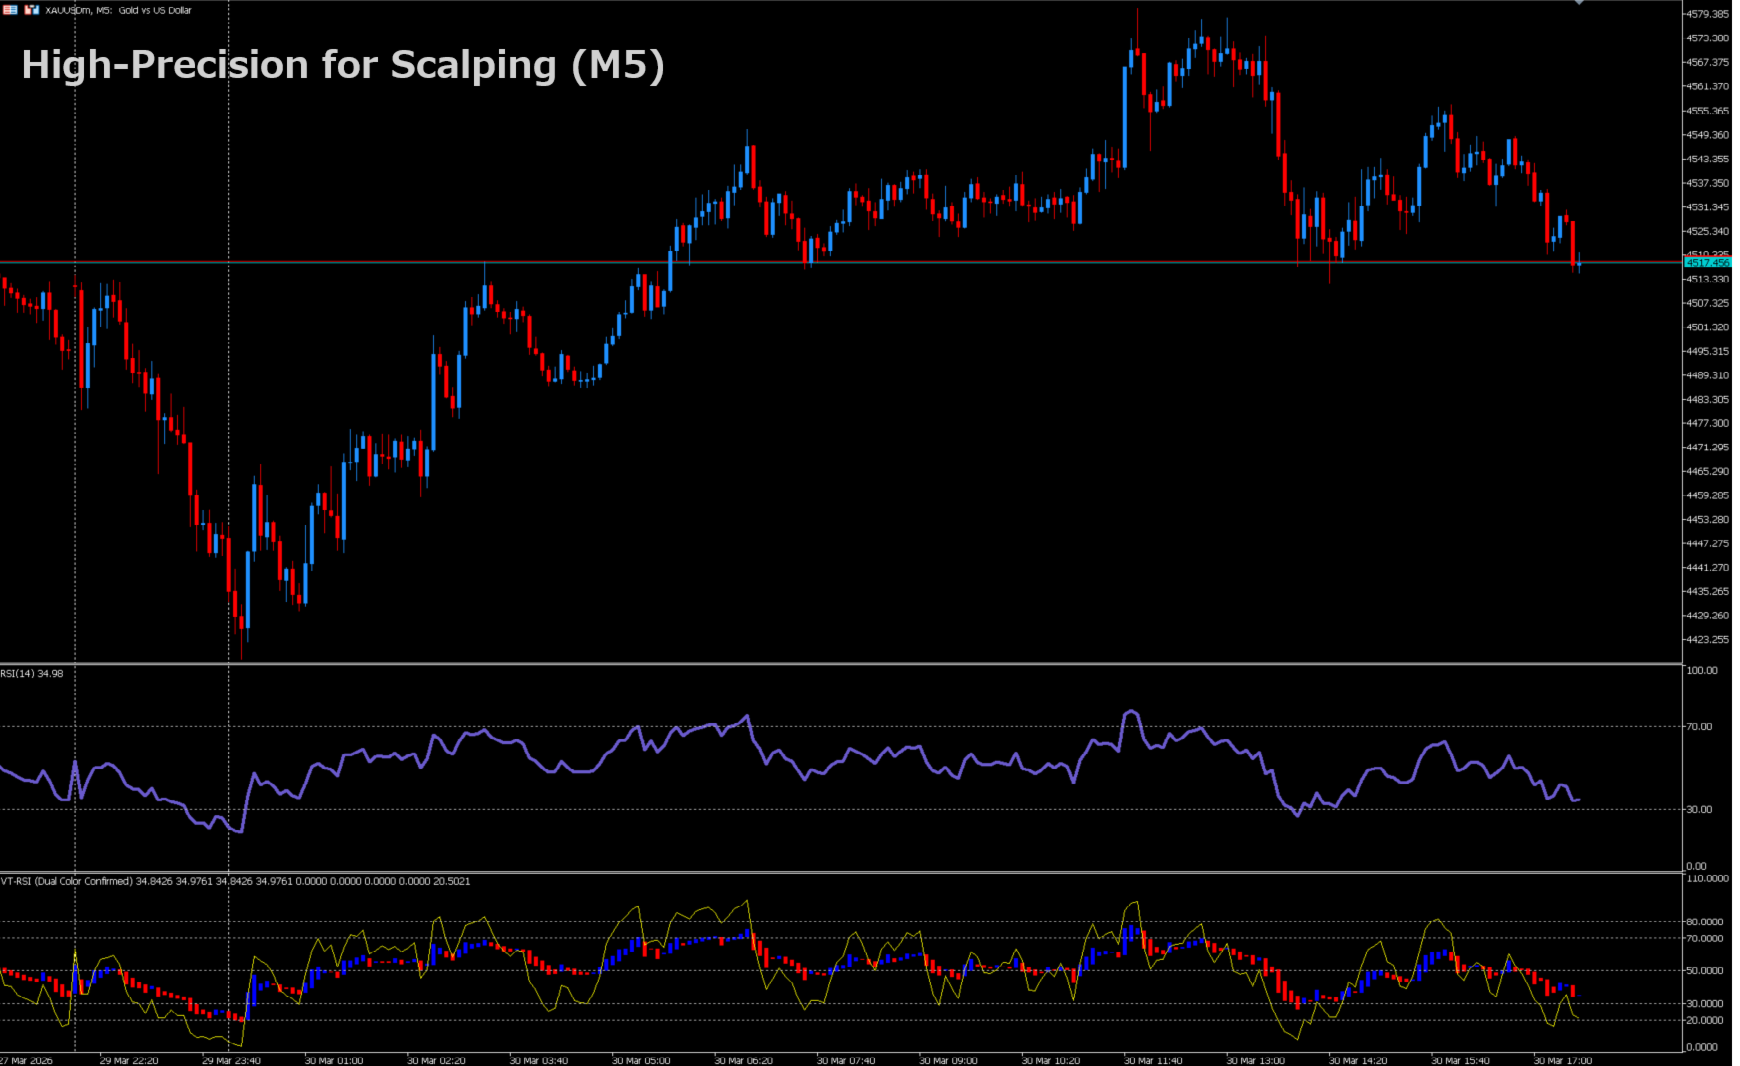
Zero Noise Visualization: Smooths out jagged RSI waves into clear, color-coded structure.
-
Early Detection (Velox): Identifies the very beginning of a trend shift, giving you a head start.
-
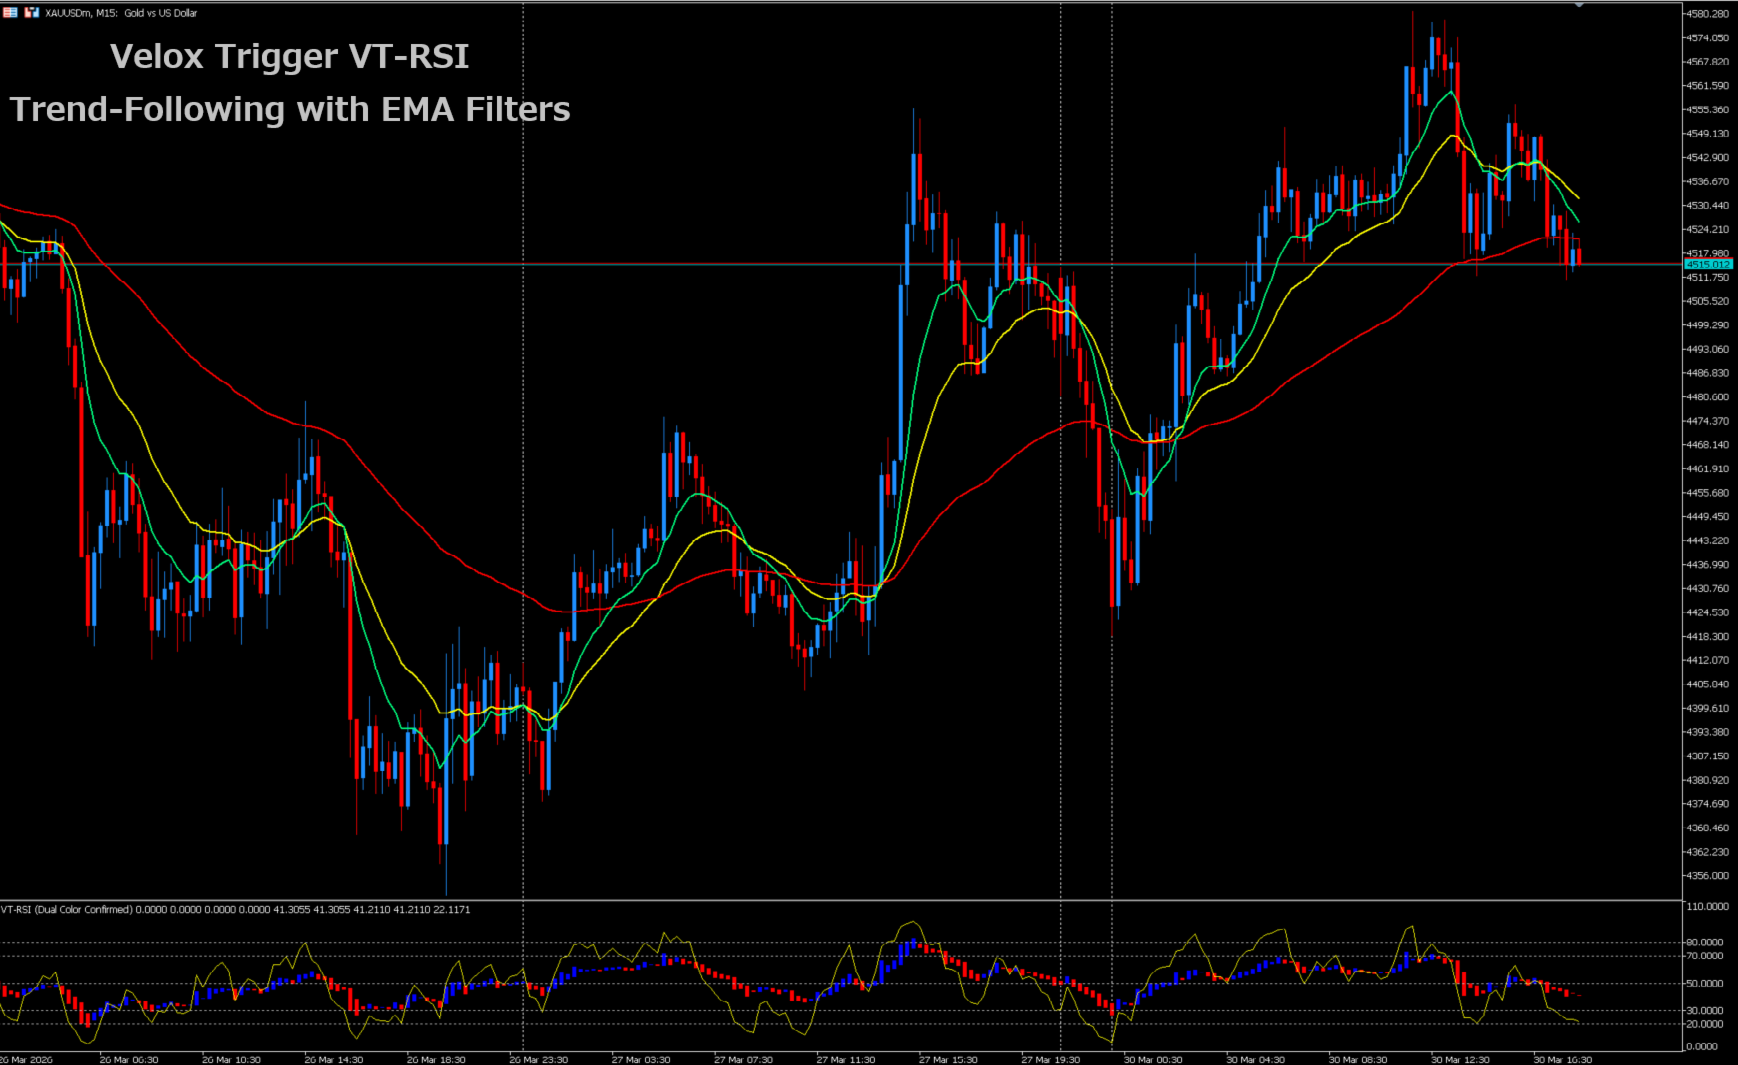
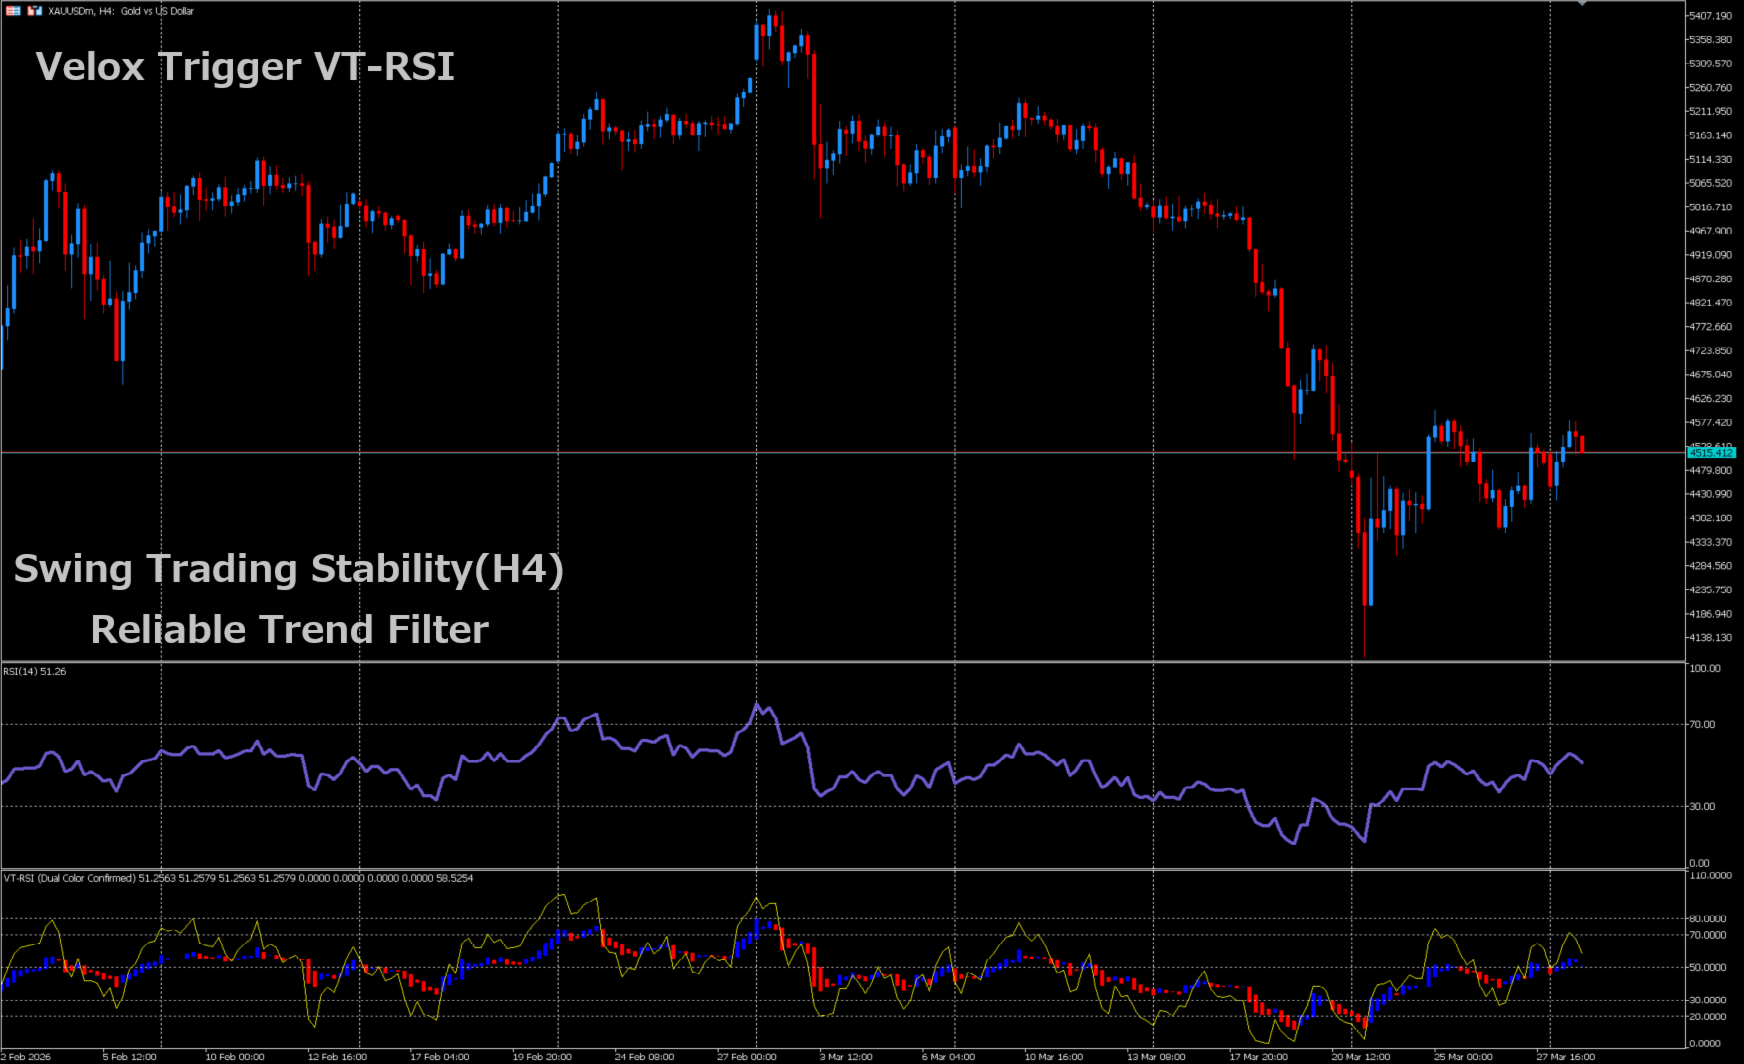
Multi-Timeframe Synergy: Optimized for H4 (Structure) and M15 (Trigger) synchronization.
-
Confidence-Driven Execution: No more second-guessing. When the color confirms, the structure has shifted.
How to Trade:
-
Identify the Trend: Use H4 VT-RSI to determine the overall market "wind."
-
Wait for the Pullback: In a bullish trend, wait for M15 VT-RSI to temporarily turn Red.
-
Execute the Trigger: When M15 VT-RSI turns Blue again (as shown in the screenshots), that is your high-conviction entry point.
“Trading is not a gamble; it’s a verification of structure.”
Download the demo and experience the clarity today.