JONUS Orderflow V

JONUX Orderflow-V — Professional Vector Pressure Analysis

JONUX Orderflow-V is a specialized analytical tool designed to visualize internal market pressure within the MetaTrader 5 environment. Unlike standard indicators that rely solely on price movement or simple tick counting, this utility employs a proprietary Vector Pressure Engine to analyze the relationship between volume, price displacement, and candle geometry.

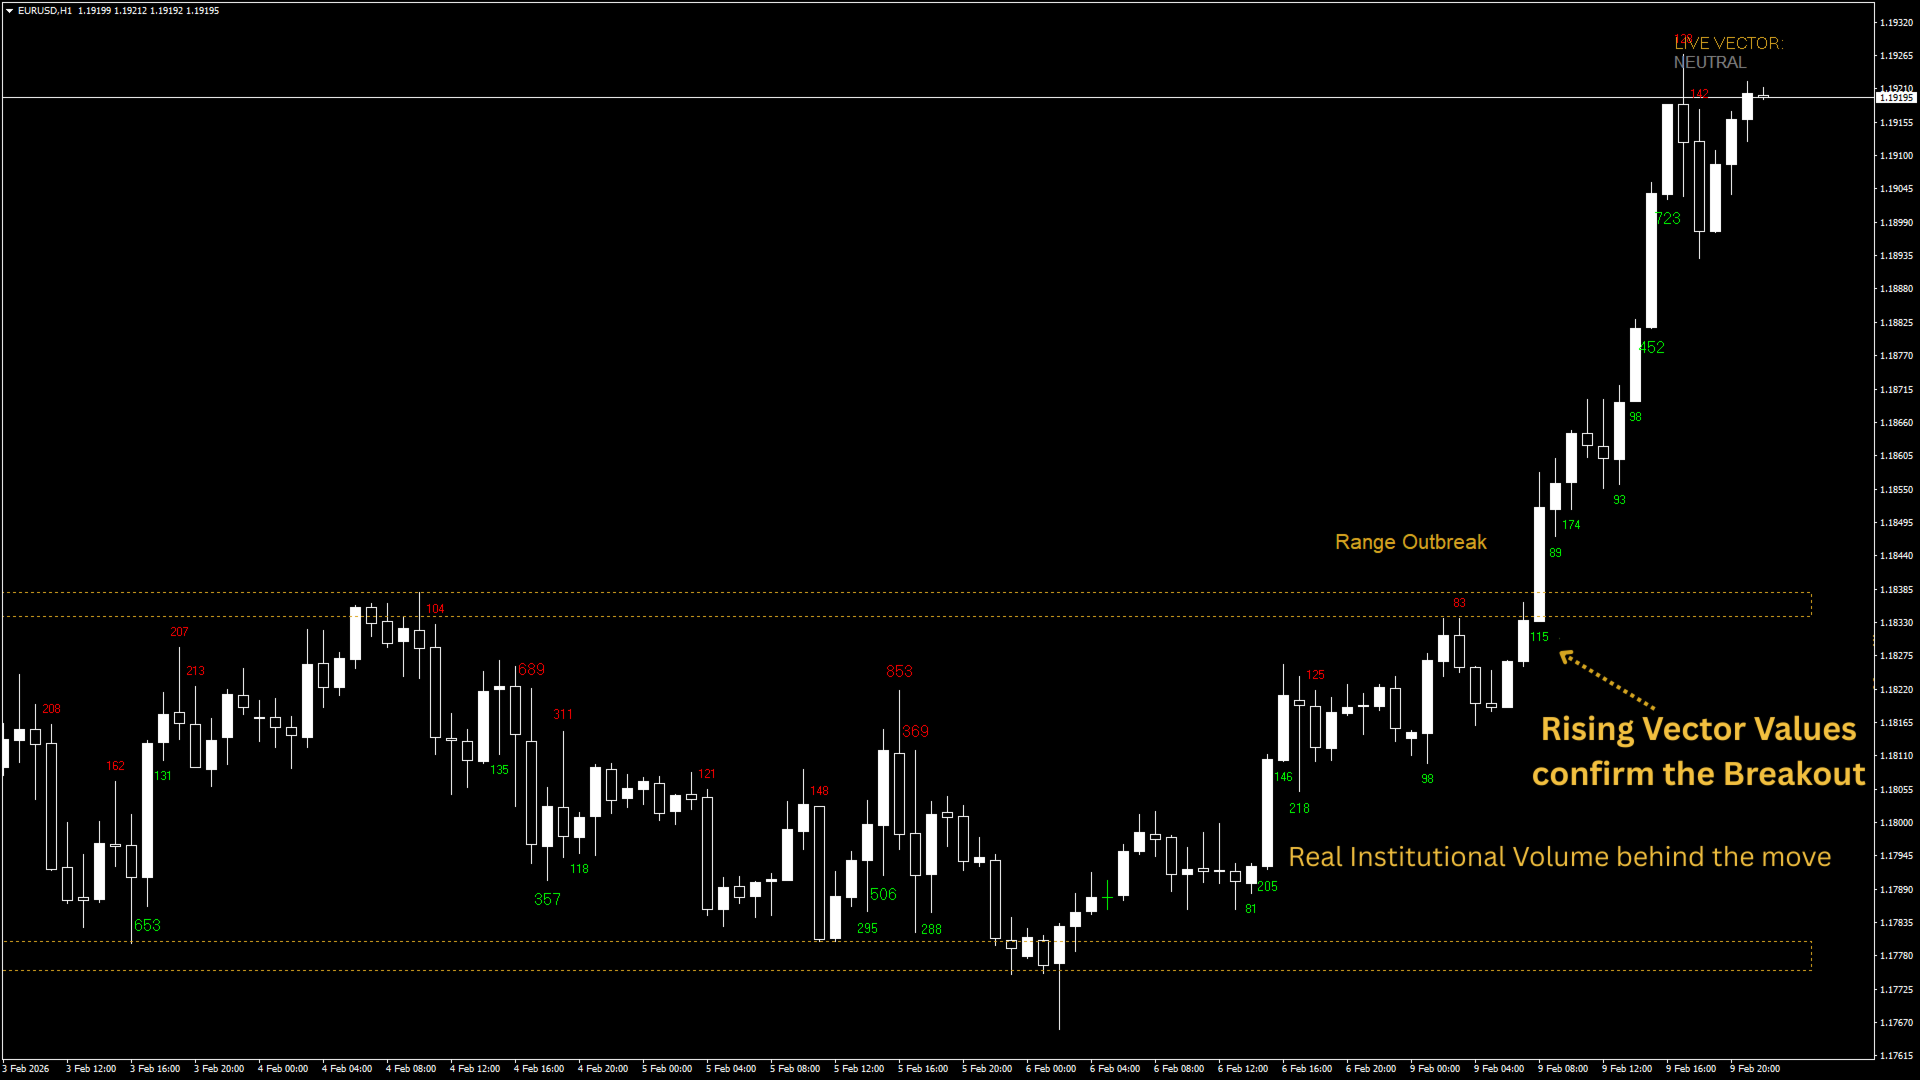
This tool does not generate buy or sell signals on its own. Instead, it provides a quantitative value representing the "force" behind a specific price movement, helping traders to gauge the validity of a breakout or the likelihood of a reversal.


Looking for the MT4 Version? > https://www.mql5.com/de/market/product/164875?source=Site+Profile+Seller


📊 Concept & Functionality
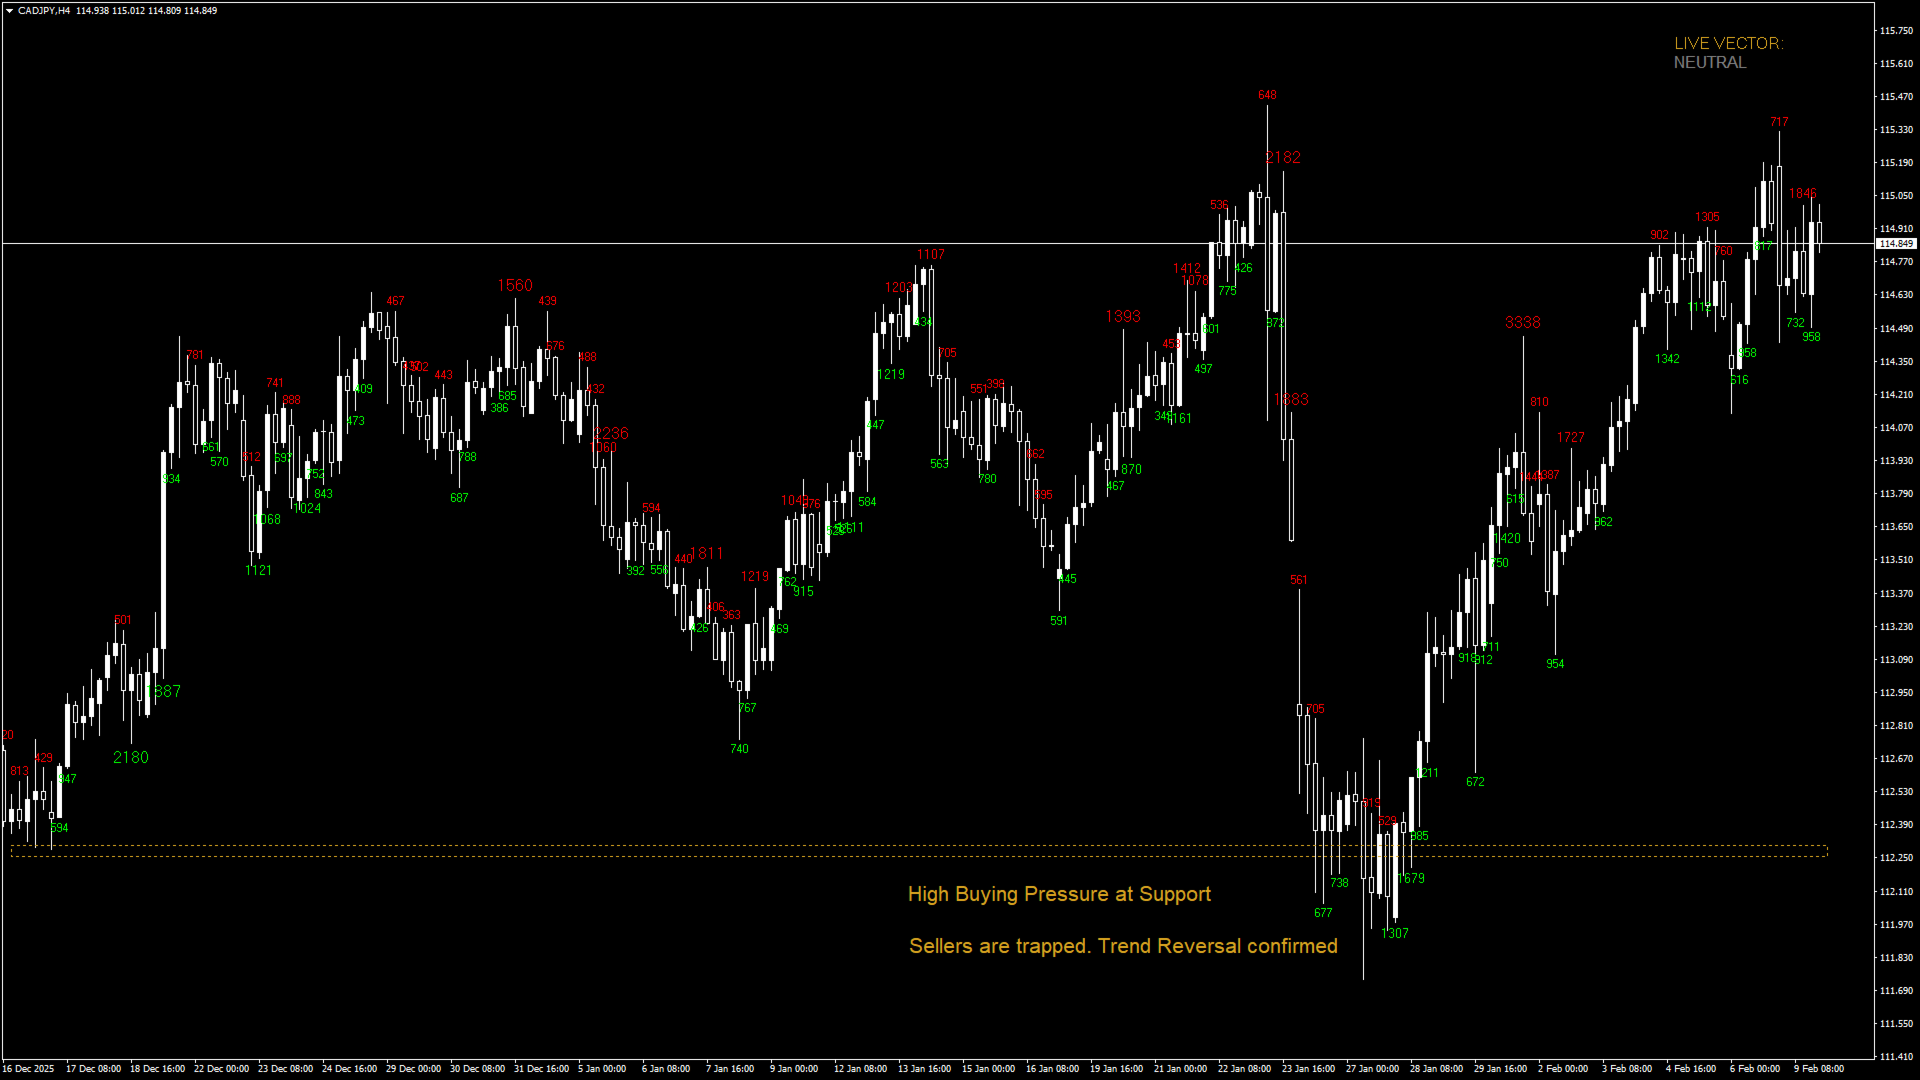
The indicator assigns a numeric "Vector Value" to each candle. This value is derived from an algorithm that weighs the closing price relative to the high/low range against the volume intensity.
* Positive Values (Green): Indicate dominant buying pressure.
* Negative Values (Red): Indicate dominant selling pressure.
* Smart Wick Logic: The tool is capable of detecting "hidden" pressure inside wicks (e.g., strong selling volume within a green candle), revealing potential exhaustion or absorption.

🎯 Strategic Application (Best Practices)
This tool is engineered to work as a confirmation filter. It performs best when analyzing reactions at pre-defined Points of Interest (POIs):
* Significant Highs & Lows: Validate if a breakout has real institutional backing or if it is a "fakeout" (high volume, low vector).
* Session Levels: Analyze reactions at Asia High/Low, London Open, or New York Open.
* Supply & Demand Zones: Confirm absorption or rejection when price enters a key zone.

⚙️ Key Features
* Live Vector Panel: A real-time dashboard displaying the current market state (Neutral, Bullish, or Bearish pressure).
* Dynamic Visualization: Font sizes scale automatically based on the intensity of the volume vector.
* Zero Lag: Historical values are fixed once a candle closes and do not repaint.
* Gold Edition Customization: Fully adjustable colors, panel positioning, and font sizes to fit any chart aesthetic.

Inputs / Parameters
* Vector Engine: Adjust the lookback period for volume baseline.
* Sensitivity: Fine-tune the filter to ignore market noise (Standard: 1.5).
* Smart Wick: Enable/Disable the calculation of wick rejection.

* Panel Design: Customize X/Y coordinates and colors for the live display.


📝 Note on the Free Demo: The free demo version is restricted by MQL5 to the Strategy Tester only. It will not work on live charts. To test it, please open the Strategy Tester in MT4/MT5, select "Indicator", choose JONUX Orderflow-V, and enable "Visual Mode


⚠️ Risk Disclaimer
Trading Forex and CFDs involves a high level of risk and is not suitable for all investors. JONUX Orderflow-V is a technical analysis tool intended to assist in making informed trading decisions. It does not guarantee profits and should not be used as the sole basis for any trade. Past performance of the indicator is not indicative of future market behavior. The user assumes full responsibility for all trading risks.

Developed by JONUX Systems. Precision Analysis Tools

추천 제품
Volume Profile V6
Andrey Kolesnik
4.67 (3)
시장 매물대 지표(Volume Profile) + 스마트 오실레이터. 통화 쌍, 주식, 선물, 암호화폐 등 거의 모든 종목에서 작동하며, 실제 거래량(Real Volume)과 틱 거래량(Tick Volume)을 모두 지원합니다. 프로파일 생성 범위를 일주일이나 한 달 등으로 자동 설정할 수 있을 뿐만 아니라, 두 개의 수직선(빨간색과 파란색)을 이동하여 수동으로 범위를 설정할 수도 있습니다. 히스트그램 형태로 표시되며, 특정 가격 수준의 히스토그램 너비는 해당 가격대에서 발생한 거래량을 의미합니다. Mode level line color 파라미터를 사용하면 가격이 반등할 가능성이 높은 주요 매물대 수준을 자동으로 표시할 수 있으며, Maximum color 파라미터는 설정된 전체 범위에서 거래가장 많이 발생한 최대 거래량 수준을 별도로 보여줍니다. 스마트 오실레이터는 과매수 및 과매도 구간을 표시합니다. 여러 지표로부터 오는 정보를 분석하고, 처리된 데이터를 바탕으로 과매수 및 과매
The Accumulation and Distribution indicator is a volume-based indicator that was essentially designed to measure underlying supply and demand. This is accomplished by trying to determine whether traders are actually accumulating (buying) or distributing (selling). This is accomplished by plotting a cumulative total of the money flow volume for each period. This indicator can reveal divergences between volume flow and actual price to primarily affirm a current trend or to anticipate a future reve
Delta Profile Volume
Teresinha Moraes Correia
기술 설명 – MetaTrader 5용 Delta Profile Delta Profile 은 MetaTrader 5에서 정의된 캔들 범위 내의 거래량 흐름을 세부적으로 분석하기 위해 설계된 지표입니다. 이 도구는 각 가격 수준에서 양의 거래량(상승과 관련) 과 음의 거래량(하락과 관련) 간의 불균형을 구조화하고 시각화합니다. 이를 통해 사용자는 실제로 거래가 집중되는 가격 영역과 시장 불균형이 형성되는 구간을 명확하게 파악할 수 있습니다. 핵심 개념 지표는 가격 레벨 을 인식하고 이를 양의 거래량, 음의 거래량 및 순 델타(양-음 차이)로 분류합니다. 각 가격 레벨은 수평 막대 로 차트에 표시되며, 거래가 집중되는 구간을 직관적으로 보여줍니다. 사용자는 분석할 캔들의 개수 , 가격 반올림 정밀도 , 최대 표시 레벨 수 , 표시 옵션 등을 직접 설정할 수 있습니다. 주요 기능 가격 레벨 매핑 : 사용자가 지정한 자릿수에 맞게 가격을 반올림하여 거래량을 집계합니다. 순 델타 계산 : 양
Volume Profile Advance
Israr Hussain Shah
Daily & Composite Volume Profile   This is a professional-grade market profile tool designed for MetaTrader 5. It utilizes a   Dual-Profile System   to visualize supply, demand, and liquidity concentrations. Key Features Left Side: Daily Session Profiles Automatically identifies the start and end of every trading day. Generates a unique Volume Profile for each individual day. Allows you to see how value migrated from yesterday to today (e.g., Is today's volume higher or lower than yesterday?).
Mean Volume indicator for MT5
Renaud Herve Francois Candel
Mean Volume Most indicators are based on price analysis. This indicator is based on volume. Volume is overlooked piece of information in most trading systems. And this is a big mistake since volume gives important information about market participants. Mean Volume is an indicator that can be used to spot when volume is above average. It usually means that institutional traders are active. Peak in volume can be used to confirm an entry since increased volume can sustain the move in one or anot
Advanced Volume Profile Analysis Tool for MetaTrader 5 The Kecia Volume Profile Order Finder provides traders with volume profile analysis capabilities. This MT5 indicator combines volume profile visualization with statistical calculations to help identify potential trading opportunities and suggests entry, stop loss, and take profit levels based on market structure. Market Profile Visualization Transform your chart with customizable volume profile visualizations: Multiple visualization options
WAPV Weis Wave Chart Forex
Eduardo Da Costa Custodio Santos
The Weis Wave Chart Forex for MT5 is a Price and Volume indicator. The Price and Volume reading was widely disseminated through Richard Demille Wyckoff based on the three laws created by him: Supply and Demand, Cause and Effect and Effort vs. Result. In 1900 R.Wyckoff already used the wave chart in his analyses. Many years later, around 1990, David Weis Automated R. Wyckoff's wave chart and today we bring you the evolution of David Weis' wave chart. It shows the amount of Volume and the amount o
This Volume Delta Profile is an advanced MetaTrader 5 indicator that visualizes   volume delta (order flow imbalance)   using a volume profile-style histogram. It shows the difference between buying and selling pressure at specific price levels, helping traders identify supply and demand zones. This indicator provides a unique perspective on market dynamics by visualizing the imbalance between buying and selling pressure, offering insights beyond traditional volume analysis. Core Concept Positiv
Volume Flow Indicator for MT5
Mohammad Taher Halimi Tabrizi
Volume Flow Indicator for MetaTrader 5 Check all of our products from the link below Our most popular indicator What are the specifications of this indicator? Platform: MetaTrader 5 (MT5) Type of Application: Custom Trading Indicator Level: Intermediate Timeframe: All Timeframes (Multi-Timeframe Support) Trading Styles: Scalping, Day Trading, Swing Trading, Position Trading Trading Markets: Forex, Stocks, Commodities, Indices, and Crypto What does this indicator do? The Volume Flow Indicator
CvdDeltaVolumes
Parasbhai N Patel
Delta + CVD & CVD Candles Order-flow indicator combining Delta (Ask–Bid), Cumulative Volume Delta (CVD), and a unique CVD-based synthetic candle system. Shows buy/sell pressure, volume aggressiveness, and momentum shifts with optional Delta histogram, CVD line, and CVD+Delta combined candles. Useful for scalping, intraday trading, divergence detection, and understanding buyer/seller dominance. Overview The Delta + CVD & CVD Candles Indicator combines multiple order-flow tools into one clean
Blahtech Market Profile MT5
Blahtech Limited
5 (10)
Was: $249  Now: $99   Market Profile defines a number of day types that can help the trader to determine market behaviour. A key feature is the Value Area, representing the range of price action where 70% of trading took place. Understanding the Value Area can give traders valuable insight into market direction and establish the higher odds trade. It is an excellent addition to any system you may be using. Inspired by Jim Dalton’s book “Mind Over Markets”, this indicator is designed to suit the
Buy Sell Smart
Syamsurizal Dimjati
BUY and SELL smart The BUY and SELL Smart Indicator is a next-generation trading tool engineered for precision scalpers, intraday strategists, and professional analysts who demand both speed and clarity in market visualization. It seamlessly integrates smart candle-based analytics, adaptive ATR logic, and real-time economic event awareness — giving you a fully synchronized view of market volatility and momentum. Through an elegant and optimized interface, FlashScalp delivers   instant signal fee
No Demand No Supply MT5
Trade The Volume Waves Single Member P.C.
No Demand No Supply   This indicator identifies   No Demand –No Supply candles to your chart and plots volume bars colored according to the signal. It can be applied to all timeframes or to a specific one only. It can also be used as regular volume indicator  with exceptional future of WEIGHTED VOLUME. Furthermore is has an alert notification, sound and email when a signals occurs. The indicator does not repaint but the alert will come on two candles back due to the definition of No Demand No Su
Max Min Delta Indicator - Market Volume Imbalance Analysis Gain Deeper Insights into Market Volume Imbalance with Delta Analysis What is the Max Min Delta Indicator? The Max Min Delta Indicator is a powerful market volume analysis tool that visually represents maximum and minimum delta values using a histogram. It helps traders identify market strength, weakness, absorption, and aggressive buying/selling activity with precision. Key Features Histogram Visualization: Displays Max Delta (Green) an
Market profile was developed by Peter Steidlmayer in the second half of last century. This is a very effective tool if you understand the nature and usage. It's not like common tools like EMA, RSI, MACD or Bollinger Bands. It operates independently of price, not based on price but its core is volume. The volume is normal, as the instrument is sung everywhere. But the special thing here is that the Market Profile represents the volume at each price level. 1. Price Histogram The Price Histogram i
A "Volume Profile" is an advanced charting indicator that displays total volume traded at every price level over a user specified time period. The main components of the volume profile are POC ( Point Of Control - the price level, at which the maximum number of contracts were executed during a selected period), VAH ( Value Area High - the highest price in the Value Area) and VAL ( Value Area Low - the lowest price in the Value Area). When we settled on the original indicator, we spent a lot of
Color Histogram Volume Set
Ricardo Almeida Branco
Do you use volume in your reading of the market? Certainly many traders use it, and do not imagine operating without it. The Color Histogram Volume Set indicator allows the user to choose the value that he considers interesting to monitor. When you pass this you will have visual confirmation and if you want you will also have the audible alert that is given by the indicator. Of course, there are other ways to try to find a high volume, such as assessing whether the volume is above av
SMC Venom Model BPR 지표는 Smart Money(SMC) 개념 내에서 일하는 트레이더를 위한 전문 도구입니다. 가격 차트에서 두 가지 주요 패턴을 자동으로 식별합니다. FVG (공정 가치 갭)는 3개의 캔들의 조합으로, 첫 번째와 세 번째 캔들 사이에 갭이 있습니다. 이는 볼륨 지원이 없는 레벨 사이에 구역을 형성하여 종종 가격 수정으로 이어집니다. BPR (균형 가격 범위)은 두 개의 FVG 패턴의 조합으로, "브리지"를 형성합니다. 이는 가격이 낮은 볼륨 활동으로 움직일 때 브레이크아웃과 레벨로의 복귀 구역으로, 캔들 사이에 갭을 생성합니다. 이러한 패턴은 거래자가 차트에서 거래량과 가격 역학을 분석하여 주요 지지/저항 수준, 돌파 구역 및 진입 지점을 식별하는 데 도움이 되며, 여기서 대형 시장 참여자와 일반 참여자 간의 상호 작용이 발생합니다. 이 지표는 사각형과 화살표 형태로 패턴을 시각화하며 유연한 경고 설정도 지원합니다. 주요 특징: 패턴 표시 모드
BUYER or SELLER
Syamsurizal Dimjati
BUY or SELL FlashScalp Multi-System Indicator The FlashScalp Multi-System Indicator is a next-generation trading tool engineered for precision scalpers, intraday strategists, and professional analysts who demand both speed and clarity in market visualization. It seamlessly integrates smart candle-based analytics, adaptive ATR logic, and real-time economic event awareness — giving you a fully synchronized view of market volatility and momentum. Through an elegant and optimized interface, FlashSc
MT5용 Crypto_Forex 지표 Bulls Power HTF - Bulls Power HTF 오실레이터는 "매수" 진입 시점을 위한 완벽한 필터입니다. HTF는 상위 시간대를 의미합니다. - Bulls Power 및 Bears Power 지표는 거래에서 해당 추세의 강도를 측정하는 데 사용됩니다. - Bulls Power는 매수 포지션의 강도를 측정합니다. - Bulls Power HTF 지표는 가격 변동 진입 시점을 포함하거나 다른 지표와 함께 사용하는 다중 시간대 거래 시스템에 매우 적합합니다. - 이 지표를 사용하면 상위 시간대의 Bulls Power를 현재 차트에 추가할 수 있습니다. - 지표에는 0 레벨 교차 시 모바일 및 PC 알림 기능이 내장되어 있습니다. 여기를 클릭하여 고품질 트레이딩 로봇과 지표를 확인하세요! 이 제품은 MQL5 웹사이트에서만 제공되는 정품 제품입니다.
Smart SD Rectangle Tool
Liam Alex Thomas Webb
스마트 공급 및 수요 사각형 도구 인디케이터는 MT5에서 최고의 동반자로, 주요 공급 및 수요 데이터를 즉시 시각화하여 필요한 곳에서 실시간으로 확인할 수 있습니다. 이 도구는 구역 위에 풍부하고 실행 가능한 데이터를 자동으로 오버레이하여 구역 분류, 핍 거리, 강도, 구역 크기 등을 각 구역 안에 깔끔하게 표시합니다. 더 이상 복잡함이나 추측이 필요 없습니다—명확하고 역동적인 인사이트로 여러분의 결정을 지원합니다. 트레이더를 위해 제작. 정밀함으로 구동. 인트라데이 스캘핑을 하든 일일 차트에서 주요 구역을 분석하든, 이 인디케이터는 수동으로 그린 구역을 즉시 스마트 구역으로 전환하여 작업 흐름을 방해하지 않으면서 차트의 정보 가치를 높입니다. ### 주요 기능 **자동 레벨 감지** - 차트상의 모든 구역을 즉시 인식 - 공급 또는 수요로 자동 분류—수동 태깅 불필요 **풍부한 실시간 메트릭** - 표시 항목:   - 구역 크기   - 현재 가격과의 실시간 핍 거리   -
CVD SmoothFlow Pro
Thalles Nascimento De Carvalho
CVD SmoothFlow Pro - 모든 자산에 대한 무제한 볼륨 분석! CVD SmoothFlow Pro 는 정밀하고 무제한의 볼륨 분석을 원하는 트레이더를 위한 최적의 솔루션입니다. Cumulative Volume Delta (CVD) 계산과 고급 노이즈 필터링을 활용하여, Pro 버전은 모든 금융 자산 거래에 필요한 유연성과 정확성을 제공합니다. CVD SmoothFlow Pro가 제공하는 기능: 명확한 분석 : 시장 노이즈를 필터링하고 모든 금융 자산에서 중요한 볼륨 변동을 강조합니다. ️ 정확한 계산 : 매수와 매도 차이를 모니터링하여 외환, 지수, 암호화폐 등 자산의 볼륨 행동을 상세히 제공합니다. 직관적인 인터페이스 : 데이터가 명확하게 제시되어 분석이 쉽고 효율적입니다. 트렌드 식별 : 시장 트렌드를 자신 있게 식별하여 정보에 기반한 결정을 지원합니다. 실용적인 적용: 모든 자산의 실시간 매수자와 매도자 균형을 모니터링합니다. 볼륨을 기반
KT Renko Patterns MT5
KEENBASE SOFTWARE SOLUTIONS
KT Renko Patterns는 렌코 차트를 벽돌 하나하나 분석하여, 전 세계 다양한 금융 시장에서 트레이더들이 자주 사용하는 유명한 차트 패턴들을 찾아냅니다. 시간 기반 차트와 비교하면, 렌코 차트는 시각적으로 단순하고 깔끔하여 패턴 중심의 트레이딩이 훨씬 쉽게 가능합니다. KT Renko Patterns에는 다양한 렌코 패턴이 포함되어 있으며, 이 중 상당수는 Prashant Shah의 저서 『Profitable Trading with Renko Charts』에서 자세히 설명되어 있습니다. KT Renko Patterns 인디케이터를 기반으로 한 100% 자동화된 EA는 여기에서 이용할 수 있습니다 - KT Renko Patterns EA . 기능 소개 최대 8개의 명확한 렌코 패턴을 거래할 수 있어, 혼동 없이 신뢰도 높은 트레이딩이 가능합니다. 객관성을 제공하기 위해 각 패턴에는 손절선과 피보나치 목표가 함께 제공됩니다. KT Renko Patterns는 각 패턴의 정
Before installing the HeatMap indicator make sure you are using a broker that gives you access to the Depth of market (DOM) !! This indicator creates a heatmap on your chart allowing you to see the buy or sell limit orders easily and in real time. You have the possibility to change the setting and the colors of the HeatMap in order to adapt to all markets and all charts. Here is an example of a setting you can use with the NASDAQ100 on the AMPGlobal broker :  https://www.youtube.com/watch?v=x0Y
Harmonic Pattern Structure Harmonic Pattern Structure is a professional MetaTrader 5 indicator that automatically detects classic harmonic patterns using strict Fibonacci ratio validation and XABCD price structure. Designed for traders who value precision, clean visuals, and structured analysis, the indicator highlights potential reversal zones based on price geometry, supporting consistent and objective decision-making. SUPPORTED HARMONIC PATTERNS Gartley (222) Butterfly Bat Crab Shark Cy
Overview Market Volume Profile Modes is a powerful MT5 volume distribution indicator that integrates multiple Volume Profile variants. Users can switch between different analysis modes through a simple menu selection. This indicator helps traders identify key price levels, support and resistance zones, and market volume distribution. Core Concepts • POC (Point of Control): The price level with the highest volume concentration, representing the market's accepted "fair value" area • VAH (Value A
Volume Profile For MT5
Abdelkhabir Yassine Alaoui
Volume Profile is a very useful indicator . it allows you to spot the price levels where important price action took place. It is similar to support and resistance levels but with a different logic. ( Check Out  Fixed Range Volume Profile MT5  ) One of the first thing that traders mark up when analyzing a chart is support and resistance. Volume Profile can be used for doing that too. The indicator scans the defined number of previous bars and calculates the volume of activity at each price le
Introduction to Chart Pattern MT Chart Pattern MT is a chart pattern scanner to detect the triangle pattern, falling wedge pattern, rising wedge pattern, channel pattern and so on. Chart Pattern MT uses highly sophisticated chart pattern detection algorithm. However, we have designed it in the easy to use with intuitive user interface. Chart Pattern MT will show all the patterns in your chart in the most efficient format for your trading. You do not have to do tedious manual pattern detection an
The Super Arrow Indicator provides non-repainting buy and sell signals with exceptional accuracy. Key Features No repainting – confirmed signals remain fixed Clear visual arrows: green for buy, red for sell Real-time alerts via pop-up, sound, and optional email Clean chart view with no unnecessary clutter Works on all markets: Forex, gold, oil, indices, crypto Adjustable Parameters TimeFrame Default:   "current time frame" Function:   Sets the time frame for indicator calculation Options:   Can
Triangle Pattern Gann v3.1 - Complete Feature Documentation Core Functionality OverviewTriangle Pattern Gann v3.1 is a sophisticated MetaTrader 5 indicator that combines W.D. Gann's geometric trading principles with advanced triangle pattern recognition to deliver actionable trading signals. Primary Features1. Triangle Pattern Detection SystemAscending Triangle Recognition Function: Automatically identifies bullish continuation patterns Detection Criteria: Flat horizontal resistance line
이 제품의 구매자들이 또한 구매함
이 지표를 구매하면 제 프로페셔널 트레이드 매니저를 무료로 드립니다. 우선 이 거래 시스템이 리페인팅, 리드로잉 및 레이그 인디케이터가 아니라는 점을 강조하는 것이 중요합니다. 이는 수동 및 로봇 거래 모두에 이상적인 것으로 만듭니다. 온라인 강좌, 설명서 및 프리셋 다운로드. "스마트 트렌드 트레이딩 시스템 MT5"은 새로운 및 경험이 풍부한 트레이더를 위해 맞춤형으로 제작된 종합적인 거래 솔루션입니다. 10개 이상의 프리미엄 인디케이터를 결합하고 7개 이상의 견고한 거래 전략을 특징으로 하여 다양한 시장 조건에 대한 다목적 선택이 가능합니다. 트렌드 추종 전략: 효과적인 트렌드 추이를 타기 위한 정확한 진입 및 손절 관리를 제공합니다. 반전 전략: 잠재적인 트렌드 반전을 식별하여 트레이더가 범위 시장을 활용할 수 있게 합니다. 스캘핑 전략: 빠르고 정확한 데이 트레이딩 및 단기 거래를 위해 설계되었습니다. 안정성: 모든 인디케이터가 리페인팅, 리드로잉 및 레이그가 아니므로 신뢰
ARIPoint
Temirlan Kdyrkhan
ARIPoint is a powerful trading companion designed to generate high-probability entry signals with dynamic TP/SL/DP levels based on volatility. Built-in performance tracking shows win/loss stats, PP1/PP2 hits, and success rates all updated live. Key Features: Buy/Sell signals with adaptive volatility bands Real-time TP/SL/DP levels based on ATR Built-in MA Filter with optional ATR/StdDev volatility Performance stats panel (Success, Profit/Loss, PP1/PP2) Alerts via popup, sound, push, or email Cu
Entry In The Zone and SMC Multi Timeframe is a real-time market analysis tool developed based on Smart Money Concepts (SMC). It is designed to analyze market structure, price direction, reversal points, and key zones across multiple timeframes in a systematic way. The system displays Points of Interest (POI) and real-time No Repaint signals, with instant alerts when price reaches key zones or when signals occur within those zones. It functions as both an Indicator and a Signal System (2-in-1), c
Divergence Bomber
Ihor Otkydach
4.89 (81)
이 지표를 구매하신 분께는 다음과 같은 혜택이 무료로 제공됩니다: 각 거래를 자동으로 관리하고, 손절/익절 수준을 설정하며, 전략 규칙에 따라 거래를 종료하는 전용 도우미 툴 "Bomber Utility" 다양한 자산에 맞게 지표를 설정할 수 있는 셋업 파일(Set Files) "최소 위험", "균형 잡힌 위험", "관망 전략" 모드로 설정 가능한 Bomber Utility의 셋업 파일 이 전략을 빠르게 설치, 설정, 시작할 수 있도록 돕는 단계별 영상 매뉴얼 주의: 위의 모든 보너스를 받기 위해서는 MQL5 개인 메시지 시스템을 통해 판매자에게 연락해 주세요. 독창적인 커스텀 지표인 “Divergence Bomber(다이버전스 봄버)”를 소개합니다. 이 지표는 MACD 다이버전스(괴리) 전략을 기반으로 한 올인원(All-in-One) 거래 시스템입니다. 이 기술 지표의 주요 목적은 가격과 MACD 지표 간의 다이버전스를 감지하고, **향후 가격이 어느 방향으로 움직일지를 알려주는
Azimuth Pro
Ottaviano De Cicco
5 (3)
LAUNCH PROMO Azimuth Pro price is initially set at 299$ for the first 100 buyers. Final price will be 499$ . THE DIFFERENCE BETWEEN RETAIL AND INSTITUTIONAL ENTRIES ISN'T THE INDICATOR — IT'S THE LOCATION. Most traders enter at arbitrary price levels, chasing momentum or reacting to lagging signals. Institutions wait for price to reach structured levels where supply and demand actually shift. Azimuth Pro maps these levels automatically: swing-anchored VWAP, multi-timeframe structure lines, an
FX Power MT5 NG
Daniel Stein
5 (31)
FX Power: 통화 강세 분석으로 더 스마트한 거래 결정을 개요 FX Power 는 어떤 시장 상황에서도 주요 통화와 금의 실제 강세를 이해하기 위한 필수 도구입니다. 강한 통화를 매수하고 약한 통화를 매도함으로써 FX Power 는 거래 결정을 단순화하고 높은 확률의 기회를 발견합니다. 트렌드를 따르거나 극단적인 델타 값을 사용해 반전을 예측하고자 한다면, 이 도구는 귀하의 거래 스타일에 완벽히 적응합니다. 단순히 거래하지 말고, FX Power 로 더 스마트하게 거래하세요. 1. FX Power가 거래자에게 매우 유용한 이유 통화와 금의 실시간 강세 분석 • FX Power 는 주요 통화와 금의 상대적 강세를 계산하고 표시하여 시장 역학에 대한 명확한 통찰력을 제공합니다. • 어떤 자산이 앞서고 있고 어떤 자산이 뒤처지는지 모니터링하여 보다 현명한 거래 결정을 내릴 수 있습니다. 포괄적인 멀티 타임프레임 뷰 • 단기, 중기 및 장기 타임프레임에서 통화와 금의 강세를
TrendMaestro5
Stefano Frisetti
note: this indicator is for METATRADER4, if you want the version for METATRADER5 this is the link:  https://www.mql5.com/it/market/product/108106 TRENDMAESTRO ver 2.5 TRENDMAESTRO recognizes a new TREND from the start, he never makes mistakes. The certainty of identifying a new TREND is priceless. DESCRIPTION TRENDMAESTRO identifies a new TREND in the bud, this indicator examines the volatility, volumes and momentum to identify the moment in which there is an explosion of one or more of these da
Atomic Analyst MT5
Issam Kassas
4.07 (28)
우선적으로 언급할 점은이 거래 지표가 다시 그리지 않고 지연되지 않으며 이를 통해 수동 및 로봇 거래 모두에 이상적이라는 점입니다. 사용자 매뉴얼: 설정, 입력 및 전략. Atomic Analyst는 가격의 강도와 모멘텀을 활용하여 시장에서 더 나은 이점을 찾는 PA Price Action Indicator입니다. 고급 필터를 장착하여 잡음과 거짓 신호를 제거하고 거래 잠재력을 높이는 데 도움이 됩니다. 복잡한 지표의 다중 레이어를 사용하여 Atomic Analyst는 차트를 스캔하고 복잡한 수학적 계산을 간단한 신호와 색상으로 변환하여 초보 트레이더가 이해하고 일관된 거래 결정을 내릴 수 있도록합니다. "Atomic Analyst"는 새로운 및 경험이 풍부한 트레이더를위한 종합적인 거래 솔루션입니다. 프리미엄 지표와 최고 수준의 기능을 하나의 거래 전략에 결합하여 모든 종류의 트레이더에 대한 다재다능한 선택지가되었습니다. 인트라데이 거래 및 스캘핑 전략 : 빠르고 정확한 일일
Grabber System MT5
Ihor Otkydach
4.82 (22)
탁월한 기술적 지표인 Grabber를 소개합니다. 이 도구는 즉시 사용 가능한 “올인원(All-Inclusive)” 트레이딩 전략으로 작동합니다. 하나의 코드 안에 강력한 시장 기술 분석 도구, 매매 신호(화살표), 알림 기능, 푸시 알림이 통합되어 있습니다. 이 인디케이터를 구매하신 모든 분들께는 다음의 항목이 무료로 제공됩니다: Grabber 유틸리티: 오픈 포지션을 자동으로 관리하는 도구 단계별 영상 매뉴얼: 설치, 설정, 그리고 실제 거래 방법을 안내 맞춤형 세트 파일: 인디케이터를 빠르게 자동 설정하여 최고의 성과를 낼 수 있도록 도와줍니다 다른 전략은 이제 잊어버리세요! Grabber만이 여러분을 새로운 트레이딩의 정점으로 이끌어 줄 수 있습니다. Grabber 전략의 주요 특징: 거래 시간 프레임: M5부터 H4까지 거래 가능한 자산: 어떤 자산이든 사용 가능하지만, 제가 직접 테스트한 종목들을 추천드립니다 (GBPUSD, GBPCAD, GBPCHF, AUDCAD, AU
Entry Points Pro for MT5
Yury Orlov
4.48 (138)
다시 색을 칠하지 않고 거래에 진입할 수 있는 정확한 신호를 제공하는 MT5용 지표입니다. 외환, 암호화폐, 금속, 주식, 지수 등 모든 금융 자산에 적용할 수 있습니다. 매우 정확한 추정값을 제공하고 매수와 매도의 가장 좋은 시점을 알려줍니다. 하나의 시그널로 수익을 내는 지표의 예와 함께 비디오 (6:22)시청하십시오! 대부분의 거래자는 Entry Points Pro 지표의 도움으로 첫 거래 주 동안 트레이딩 결과를 개선합니다. 저희의   Telegram Group 을 구독하세요! Entry Points Pro 지표의 좋은점. 재도색이 없는 진입 신호 신호가 나타나고 확인되면(시그널 캔들이 완성된 경우) 신호는 더 이상 사라지지 않습니다. 여타 보조지표의 경우 신호를 표시한 다음 제거되기 때문에 큰 재정적 손실로 이어집니다. 오류 없는 거래 게시 알고리즘을 통해 트레이드(진입 또는 청산)를 할 이상적인 순간을 찾을 수 있으며, 이를 통해 이를 사용하는 모든 거래자의 성공률이
Transaction Speed MT5
Ivan Stefanov
5 (2)
이 지표는 시장에서 관심이 나타나는 영역 을 강조 표시한 후, 주문이 누적되는 영역 을 보여줍니다. 이는 **대규모 오더북(호가창)**처럼 작동합니다. 이것은 거대한 자금 을 위한 인디케이터입니다. 성능은 탁월하며, 시장에서 어떤 관심이 있든 반드시 포착할 수 있습니다 . (이것은 완전히 새로 작성되고 자동화된 버전 입니다 – 이제 수동 분석은 필요하지 않습니다.) **거래 속도(Transaction Speed)**는 새로운 개념의 인디케이터로, 시장에 대규모 주문이 언제, 어디에 쌓이는지를 보여주며 , 그 이점을 분석합니다. 매우 초기 단계에서 트렌드 전환 을 감지할 수 있습니다. FX 시장에서 흔히 사용하는 "거래량(volume)"은 오해입니다. 실제로는 시간당 가격 변화량 이므로, 올바른 용어는 거래 속도 입니다. 우리가 어떻게 사고하고, 행동하며, 분석하느냐 가 가장 중요합니다. 분석 패러다임의 전환 은 필수적입니다. 이 인디케이터는 외환 시장에서의 볼륨 개념을 논리적으로
" Dynamic Scalper System MT5 " 지표는 추세 파동 내에서 스캘핑 방식으로 거래하도록 설계되었습니다. 주요 통화쌍 및 금에서 테스트되었으며, 다른 거래 상품과의 호환성이 가능합니다. 추가적인 가격 변동 지원을 통해 추세에 따라 단기 포지션 진입 신호를 제공합니다. 지표의 원리 큰 화살표는 추세 방향을 결정합니다. 작은 화살표 형태의 스캘핑 신호를 생성하는 알고리즘은 추세 파동 내에서 작동합니다. 빨간색 화살표는 상승 방향을, 파란색 화살표는 하락 방향을 나타냅니다. 민감한 가격 변동선은 추세 방향으로 그려지며, 작은 화살표의 신호와 함께 작용합니다. 신호는 다음과 같이 작동합니다. 적절한 시점에 선이 나타나면 진입 신호가 형성되고, 선이 있는 동안 미결제 포지션을 유지하며, 완료되면 거래를 종료합니다. 권장되는 작업 시간대는 M1~H4입니다. 화살표는 현재 캔들에 형성되며, 다음 캔들이 이미 시작되었더라도 이전 캔들의 화살표는 다시 그려지지 않습니다. 입
RelicusRoad Pro MT5
Relicus LLC
5 (24)
RelicusRoad Pro: 퀀트 시장 운영 체제 70% 할인 평생 이용권 (한정 시간) - 2,000명 이상의 트레이더와 함께하세요 왜 대부분의 트레이더는 "완벽한" 지표를 가지고도 실패할까요? 진공 상태에서 단일 개념 만으로 거래하기 때문입니다. 문맥 없는 신호는 도박입니다. 지속적인 승리를 위해서는 컨플루언스(중첩) 가 필요합니다. RelicusRoad Pro는 단순한 화살표 지표가 아닙니다. 완전한 퀀트 시장 생태계 입니다. 독점적인 변동성 모델링을 사용하여 가격이 이동하는 "공정 가치 로드"를 매핑하고, 단순 노이즈와 실제 구조적 돌파를 구분합니다. 추측은 그만두세요. 기관급 로드 로직으로 거래를 시작하세요. 핵심 엔진: "Road" 알고리즘 시스템의 중심에는 시장 상황에 실시간으로 적응하는 동적 변동성 채널인 Road Algo 가 있습니다. 세이프 라인(평형) 과 가격이 수학적으로 반전될 가능성이 높은 확장 레벨 을 투영합니다. Simple Road: 일반적인 시장을 위
Super Signal – Skyblade Edition 전문가용 노리페인트 / 노래그 트렌드 신호 시스템, 뛰어난 승률 제공 | MT4 / MT5용 1분, 5분, 15분과 같은 낮은 타임프레임에서 가장 좋은 성능을 보입니다. 핵심 기능: Super Signal – Skyblade Edition은 추세 매매를 위해 설계된 스마트 신호 시스템입니다. 이 시스템은 다중 필터 로직을 활용하여, 명확한 방향성과 실질적인 모멘텀이 수반된 고품질 추세만을 감지합니다. 이 시스템은   고점 또는 저점을 예측하지 않으며 , 다음 세 가지 조건이 모두 충족될 때만 신호를 발생시킵니다: 명확한 추세 방향 강화되는 모멘텀 건전한 변동성 구조 또한, 시장 세션 기반의 유동성 분석을 통해 신호의 신뢰성과 타이밍을 더욱 향상시킵니다. 신호 특성: 모든 화살표 신호는 100% 리페인트 없음 / 지연 없음 신호가 한 번 발생하면 고정되며, 깜빡이거나 사라지지 않음 차트 상의 시각적 화살표, 정보 패널, 팝업
TPSproTREND PrO MT5
Roman Podpora
4.74 (19)
TPSproTrend PRO는 시장이 실제로 방향을 바꾸는 순간을 포착하여 움직임의 시작점에서 진입점을 형성합니다. 가격이 움직이기 시작할 때 시장에 진입해야 하며, 이미 가격 변동이 일어난 후에 진입해서는 안 됩니다.   (지표)       신호를 다시 그리지 않고 진입점, 손절매, 이익실현을 자동으로 표시하여 거래를 명확하고 시각적이며 체계적으로 만들어줍니다. 설명서 (러시아어)   -   MT4 버전 주요 장점 신호 재표시 없이 신호가 표시됩니다.   모든 신호는 고정되어 있습니다. 화살표가 나타나면 -       그것은 더 이상 변하거나 사라지지 않을 것입니다. 잘못된 신호의 위험 없이 안정적인 데이터를 기반으로 거래 결정을 내릴 수 있습니다. 바로 사용 가능한 매수/매도 진입점 이 지표는 거래 진입에 가장 적합한 시점을 자동으로 판단하여 차트에 화살표로 표시합니다. 추측이나 주관적인 분석이 아닌, 명확한 신호만 있습니다. 자동 손절매 및 이익실현 영역 신호 직후에 다음
AX Forex Indicator MT5
MQL TOOLS SL
5 (1)
The AX Forex Indicator MT5 is a sophisticated trading tool designed to provide traders with a comprehensive analysis of multiple currency pairs. This   powerful indicator   simplifies the complex nature of the forex market, making it accessible for both novice and experienced traders. AX Forex Indicator uses   advanced algorithms   to detect trends, patterns and is an essential tool for traders aiming to enhance their forex trading performance. With its robust features, ease of use, and reliabl
Dark Support Resistance  is an Indicator for intraday trading. This Indicator is programmed to identify  Support and Resistance Lines , providing a high level of accuracy and reliability. Key benefits Easily visible lines Only the most important levels will be displayed Automated adjustment for each timeframe and instrument Easy to use even for beginners Never repaints, never backpaints, Not Lag 100% compatible with Expert Advisor development All types of alerts available: Pop-up, Email, Push
Weis Wave with Alert MT5
Trade The Volume Waves Single Member P.C.
4.94 (17)
Rental/Lifetime Package Options and Privileges  Rent Monthly Six Months   Yearly/Lifetime Weis Wave with Speed with Alert+Speed Index x x x Manual  x x x Quick Set up Video x x x Blog x x x Lifetime Updates x x x Setup and Training Material x x Discord Access Channel "The SI traders"          x Rectangle Break Alert Tool      x How to trade with it:    http://www.tradethevolumewaves.com   ** If you purchase please contact me to setup your  : Training Room and  complete manual access.  Wei
우선적으로, 이 거래 도구는 전문적인 거래에 이상적인 비-다시 그리기 및 지연되지 않는 지표입니다.  온라인 강좌, 사용자 매뉴얼 및 데모. 스마트 가격 액션 컨셉트 인디케이터는 신규 및 경험 많은 트레이더 모두에게 매우 강력한 도구입니다. Inner Circle Trader Analysis 및 Smart Money Concepts Trading Strategies와 같은 고급 거래 아이디어를 결합하여 20가지 이상의 유용한 지표를 하나로 결합합니다. 이 인디케이터는 스마트 머니 컨셉트에 중점을 두어 대형 기관의 거래 방식을 제공하고 이동을 예측하는 데 도움을 줍니다.  특히 유동성 분석에 뛰어나 기관이 어떻게 거래하는지 이해하는 데 도움을 줍니다. 시장 트렌드를 예측하고 가격 변동을 신중하게 분석하는 데 탁월합니다. 귀하의 거래를 기관 전략에 맞추어 시장의 동향에 대해 더 정확한 예측을 할 수 있습니다. 이 인디케이터는 시장 구조를 분석하고 중요한 주문 블록을 식별하고 다양
매일 많은 트레이더들이 공통적인 어려움에 직면합니다. 가격이 핵심 레벨을 돌파한 것처럼 보여 진입했는데, 이후 시장이 반전하면서 스톱로스가 체결되는 상황입니다. 이는 ‘페이크 브레이크아웃(false breakout, 거짓 돌파)’으로 알려져 있으며, 지지 또는 저항 레벨을 잠깐 넘어섰다가 방향을 되돌리는 가격 움직임을 말합니다. 이러한 움직임은 실제 가격 방향이 명확해지기 전에 스톱로스가 먼저 발동되게 만들 수 있습니다. 기술적 분석에서는 이 현상을 흔히 “유동성 스윕(liquidity sweep)” 또는 “스톱 헌트(stop hunt)”라고 부릅니다. MIRAGE TRADING SYSTEM - 거짓 돌파 패턴을 감지하도록 설계되었습니다. 런칭 오퍼: 구매 시 추가 비용 없이 3개의 추가 제품(가치 $150, 아래 상세 참조)이 포함됩니다. 구매를 완료하신 즉시, 제품을 받기 위해 저에게 연락해 주세요. [Mirage Trading System 구매에 포함된 무료 인디케이터 및
Trend indicator AI mt5
Ramil Minniakhmetov
5 (14)
트렌드 인공 지능 지표는 실행 가능한 진입 점 및 반전 경고와 추세 식별을 결합하여 상인의 시장 분석을 향상시킬 훌륭한 도구입니다. 이 표시기는 사용자가 자신감과 정밀도로 외환 시장의 복잡성을 탐색 할 수 있도록 지원합니다 기본 신호 외에도 트렌드 인공 지능 지표는 풀백 또는 되돌림 중에 발생하는 2 차 진입 점을 식별하여 거래자가 기존 트렌드 내에서 가격 수정을 활용할 수 있도록합니다. 중요한 장점: ·작동 4 및 5 *명확한 구매 또는 판매 신호 *다시 칠하지 않습니다 *모든 자산에서 작동 나는 전보 사기에 개 또는 세트를 판매하지 않도록주의. 모든 설정은 블로그에 여기에 무료.  중요! 지침 및 보너스를 얻기 위해 구입 후 즉시 저에게 연락! 진짜 가동 감시는 뿐 아니라 나의 다른 제품 여기에서 찾아낼 수 있습니다: https://www.mql5.com/en/users/mechanic/seller&nbsp ; 설정 및 입력: 모든 자산에 대해 기본 설정을 권
FX Volume MT5
Daniel Stein
4.79 (24)
FX Volume: 브로커 시각에서 바라보는 진짜 시장 심리 간단 요약 트레이딩 접근 방식을 한층 더 향상시키고 싶으신가요? FX Volume 는 소매 트레이더와 브로커의 포지션을 실시간으로 파악할 수 있게 해 줍니다. 이는 COT 같은 지연된 보고서보다 훨씬 빠릅니다. 꾸준한 수익을 추구하는 분이든, 시장에서 더 깊은 우위를 원하시는 분이든, FX Volume 을 통해 대규모 불균형을 찾아내고, 돌파 여부를 확인하며 리스크 관리를 정교화할 수 있습니다. 지금 시작해 보세요! 실제 거래량 데이터가 의사결정을 어떻게 혁신할 수 있는지 직접 경험해 보시기 바랍니다. 1. 트레이더에게 FX Volume이 매우 유익한 이유 탁월한 정확도를 지닌 조기 경보 신호 • 다른 사람들보다 훨씬 앞서, 각 통화쌍을 매수·매도하는 트레이더 수를 거의 실시간으로 파악할 수 있습니다. • FX Volume 은 여러 리테일 브로커에서 추출한 실제 거래량 데이터를 종합해 명확하고 편리한 형태로 제공하는
PillowIndicator
Sergey Shevchenko
If you need an indicator that shows market entry points, then this is your indicator.  The indicator is not redrawn. Shows buy and sell points for any TF (time frame) and any currency pair. Settings are adjustable for all instruments. You can configure each parameter for any broker, for any account. This is a PILLOW that is comfortable :)) Just check it out.....
ARIScalping
Temirlan Kdyrkhan
ARIScalp is a powerful trading companion designed to generate high-probability entry signals with dynamic TP/SL/DP levels based on volatility. Built-in performance tracking shows win/loss stats, PP1/PP2 hits, and success rates all updated live. Key Features: Buy/Sell signals with adaptive volatility bands Real-time TP/SL/DP levels based on ATR Built-in MA Filter with optional ATR/StdDev volatility Performance stats panel (Success, Profit/Loss, PP1/PP2) Alerts via popup, sound, push, or email Cus
Quantum Entry 는 트레이더들 사이에서 가장 인기 있고 널리 알려진 전략 중 하나인 "브레이크아웃 전략"을 기반으로 구축된 강력한 가격 행동 거래 시스템입니다! 이 지표는 주요 지지 및 저항 구역의 돌파를 기반으로 명확한 매수 및 매도 신호를 생성합니다. 일반적인 브레이크아웃 지표와 달리 고급 계산을 사용하여 돌파를 정확하게 확인합니다! 돌파가 발생하면 즉시 알림을 받을 수 있습니다. 지연 없고 재표시 없음 : 모든 신호는 실시간으로 제공되며 지연 없이 과거 신호가 재표시되지 않습니다! 권장 사항 Quantum Entry는 모든 시간대와 모든 거래 심볼에서 작동합니다. 우리는 개인적으로   XAUUSD(금) 의   M1, M5 및 M15   시간대에서 이 지표를 사용합니다! 당신의 거래 실력을 향상시킬 기회를 놓치지 마세요. 지금 바로   Quantum Entry 를 확보하고 자신감과 정확성으로 거래를 시작하세요! MT4 version -  https://www.mql5.
Bill Williams Advanced
Siarhei Vashchylka
5 (10)
Bill Williams Advanced is designed for automatic chart analysis using Bill Williams' "Profitunity" system. The indicator analyzes four timeframes at once. Manual (Be sure to read before purchasing) Advantages 1. Analyzes the chart using Bill Williams' "Profitunity" system. Signals are displayed in a table in the corner of the screen and on the price chart. 2. Finds all known AO and AC signals, as well as zone signals. Equipped with a trend filter based on the Alligator. 3. Finds "Divergence Bar
Presenting one-of-a-kind Gann Indicator for XAUUSD IQ Gold Gann Levels is a non-repainting, precision tool designed exclusively for XAUUSD/Gold intraday trading. It uses W.D. Gann’s square root method to plot real-time support and resistance levels, helping traders spot high-probability entries with confidence and clarity. William Delbert Gann (W.D. Gann) was an exceptional market analyst whose trading technique was based on a complex blend of mathematics, geometry, astrology, and ancient calcul
CRT Liquidity Pro
Juan Pablo Castro Forero
5 (1)
다음 거래가 걱정되세요? 전략이 실제로 작동하는지 모르는 것에 지치셨나요? CRT Liquidity Pro를 사용하면 감정이 아닌 실제 통계로 거래할 수 있습니다. 확률을 파악하고, 성과를 추적하며, 3의 힘, 스마트 유동성 탐지, CRT 확인을 기반으로 자신 있게 거래하세요. CRT Liquidity 전략의 현실을 보고 싶으신가요? 구매 후 문의해 주세요 , 그러면 저희 다른 제품 중 하나를 무료로 제공해 드리겠습니다. 다른 제품 확인하기 에서 더 많은 실제 전략을 확인하고, Real Trades 커뮤니티에 가입 하여 자신 있게 거래하고 진짜 트레이더들과 연결하세요! CRT Liquidity Pro를 사용하는 이유: 스마트 유동성 탐지 – 이전 세션, 일간, 주간, 월간 레벨에서 유동성 구역을 자동으로 탐지합니다. 3의 힘(PO3) 통합 – 더 높은 시간대의 현재 캔들을 확인하고 실시간으로 주요 트렌드를 쉽게 파악하세요. 시장이 축적, 조작, 확장 단계로 설정될 때를 알 수 있
Current event:  https://c.mql5.com/1/326/A2SR2025_NoMusic.gif MT5용 A2SR 지표: 자동화된 실제 수요 및 공급(S/R). + 거래 상품. Product description in English here. --   Guidance   : -- at   https://www.mql5.com/en/blogs/post/734748/page4#comment_16532516 -- and  https://www.mql5.com/en/users/yohana/blog 더욱 스마트한 거래 결정을 위한 강력하고, 정확하며, 시간 절약적인 기능 + EA 호환 객체. 주요 장점 선행 실제 SR 레벨(지연 또는 재표시 없음) 2014년부터 MT4 에서 수년간 입증된 신뢰성을 바탕으로 A2SR이 이제 MetaTrader 5에서도 사용 가능합니다. 가격이 도달하기 전에 실제 지지선과 저항선을 식별하는 선행적이고 재표시 없는 지표를 통해 트레이더에
Quantum TrendPulse
Bogdan Ion Puscasu
5 (20)
SuperTrend   ,   RSI   ,   Stochastic   의 힘을 하나의 포괄적인 지표로 결합하여 트레이딩 잠재력을 극대화하는 궁극의 트레이딩 도구   인 Quantum TrendPulse를   소개합니다. 정밀성과 효율성을 추구하는 트레이더를 위해 설계된 이 지표는 시장 추세, 모멘텀 변화, 최적의 진입 및 종료 지점을 자신 있게 식별하는 데 도움이 됩니다. 주요 특징: SuperTrend 통합:   주요 시장 추세를 쉽게 따라가고 수익성의 물결을 타세요. RSI 정밀도:   매수 과다 및 매도 과다 수준을 감지하여 시장 반전 시점을 파악하는 데 적합하며 SuperTrend 필터로 사용 가능 확률적 정확도:   변동성이 큰 시장에서 숨겨진 기회를 찾기 위해 확률적 진동   을 활용하고 SuperTrend의 필터로 사용 다중 시간대 분석:   M5부터 H1 또는 H4까지 다양한 시간대에 걸쳐 시장을 최신 상태로 유지하세요. 맞춤형 알림:   맞춤형 거래 조건이 충족되면
제작자의 제품 더 보기
JONUX Orderflow-V — Professional Vector Pressure Analysis JONUX Orderflow-V is a specialized analytical tool designed to visualize internal market pressure within the MetaTrader 4 environment. Unlike standard indicators that rely solely on price movement or simple tick counting, this utility employs a proprietary Vector Pressure Engine  to analyze the relationship between volume, price displacement, and candle geometry. This tool does not generate buy or sell signals on its own. Instead, it p
필터:
리뷰 없음
리뷰 답변