Follow Line Indicator for MT5

5

Follow Line Indicator for MT5


To download all of our products, you can click this link: LINK

Are you interested in RSI: LINK
Are you interested in Chandelier Indicator: LINK

Are you interested in Wave Trend Oscillator: LINK

Are you interested in Support and Resistance Indicator: LINK


Introduction

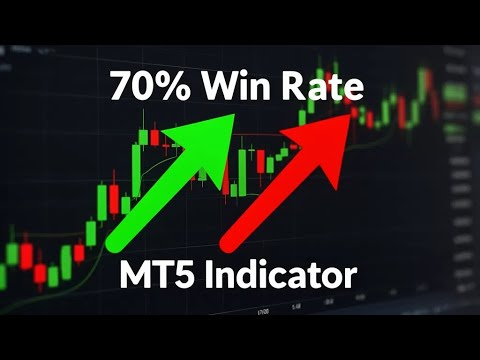
The Follow Line Indicator for MT5 is a powerful non-repainting trend-following tool designed for professional traders.
It combines Bollinger Bands and ATR filtering to generate precise buy and sell signals directly on the chart.
The indicator dynamically adjusts its line with market volatility, showing clear uptrend and downtrend zones.
A built-in back-testing panel instantly reports total trades, wins, and real-time win rate.
Perfect for scalping, day trading, and swing trading across all markets — Forex, Crypto, and Indices.


Specifications

platform

metatrader5 (MT5)

type

custom technical trading indicator

level

intermediate trader

timeframes

all timeframes from 1 minute to daily

trading styles

scalping - day trading - swing trading - position trading

markets

forex - crypto - index - CFD - metal - commodity


Indicator’s setting

The Follow Line Indicator for MT5 offers a flexible and fully customizable setup to match your trading strategy.
Each parameter helps you fine-tune the sensitivity and accuracy of signals:

  • BB Period – Defines the period used for the Bollinger Bands calculation.
    Higher values make the trend smoother and more stable, while smaller values react faster to short-term market changes.

  • BB Deviations – Controls the distance between upper and lower bands.
    Increasing it reduces false signals, while smaller deviations generate more frequent entries.

  • Use ATR Filter – When enabled, the indicator applies an ATR-based filter to smooth volatility and avoid sudden trend flips.
    Turning it off makes the line react directly to Bollinger signals.

  • ATR Period – Determines how sensitive the ATR filter is.
    Lower periods increase reactivity; higher periods stabilize the line for clearer long-term trends.

Tester Group

This section allows traders to backtest performance directly on the chart.
You can define a custom start date, and the indicator will automatically calculate Buy/Sell results, wins, and win rate.

  • Use Tester – Enables or disables the built-in backtest function.

  • Test Start Time – Sets the date from which performance testing begins.

  • TP Points – Defines the Take Profit distance in points for simulated trades.

  • SL Points – Defines the Stop Loss distance in points for each simulated trade.

Alerts Group

Stay updated with automatic notifications whenever a new signal appears.

  • Use Alerts – Enables on-screen pop-up alerts for Buy/Sell signals.

  • Use Push Notifications – Sends real-time alerts directly to your mobile MetaTrader 5 app.


Indicators Functionality 

The Follow Line Indicator for MT5 automatically tracks price movement using Bollinger Bands and ATR filtering to define the market trend.

When the trend turns bullish, a green line appears below candles; when it turns bearish, a red line forms above them.

It generates Buy arrows when the trend flips upward and Sell arrows when it reverses downward.

All signals are calculated in real-time, providing a smooth, non-repainting trend visualization for accurate trading decisions.

Benefits

We provide the following benefits if you choose our indicator (or all indicators)

  • A tester dashboard for the indicator

  • Buffers (enable you to use them in your own or custom Expert Advisors EAs)

  • Sending Alert (on the chart) or Notifications (to the phone) to not lose any opportunity.

  • Above 70% win rate in the back-test and forward-test


리뷰 1
shrtsirkit
695
shrtsirkit 2026.02.13 15:07 
 

I've been running the indicator for a couple of days and so far the signals have been positive. And the support has been the best

추천 제품
The indicator detects and displays М. Gartley's Butterfly pattern. The pattern is plotted by the extreme values of the ZigZag indicator (included in the resources, no need to install). After detecting the pattern, the indicator notifies of that by the pop-up window, a mobile notification and an email. The pattern and wave parameters are displayed on the screenshots. The default parameters are used for demonstration purposes only in order to increase the amount of detected patterns. Parameters z
Order Book, known also as Market Book, market depth, Level 2, - is a dynamically updated table with current volumes of orders to buy and to sell specific financial instument at price levels near Bid and Ask. MetaTrader 5 provides the means for receiving market book from your broker, but in real time only, without access to its history. The indicator OrderBook Cumulative Indicator accumulates market book data online and visualizes them on the chart. In addition, the indicator can show the market
평균 방향 지수(ADX) 다중 통화 스캐너 MT5는 여러 통화 쌍을 동시에 분석하도록 설계된 고급 거래 지표입니다. 이는 평균 방향 지수를 기반으로 한 실시간 신호를 제공하여 거래자들이 의사 결정 과정을 향상시키는 데 도움을 줍니다. 이를 통해 효율적인 시장 추세 분석이 가능합니다. 이 도구는 추세 강도와 방향 이동을 쉽게 식별할 수 있도록 하여 거래 경험을 간소화하며, ADX 기반 전략을 사용하는 거래자에게 필수 자산이 됩니다. 실시간 알림과 사용자 친화적인 대시보드를 통해 거래자들은 시장 상황을 신속하게 평가하고 정보에 기반한 거래 결정을 내릴 수 있습니다. MQL 제품 설치 가이드 | 구매한 MQL 제품 업데이트 MT4/MT5 | 일반 문제 해결 가이드 | 지표 설정 / 가이드 주요 기능 버퍼 통합: 지표 값을 접근 가능한 버퍼로 노출하여 Expert Advisor가 자동 거래를 위해 신호 데이터를 활용할 수 있도록 합니다. 시각적 화살표 신호: 신호 캔들에 직접 차트에 명확한
Intraday Momentum Index IMI
Danilo Hudson Couto Monteiro
Indicador IMI (Intraday Momentum Index) Descrição O Indicador IMI (Intraday Momentum Index) é uma poderosa ferramenta de análise técnica desenvolvida para identificar a força do momentum e potenciais reversões no mercado. Este indicador quantifica a relação entre ganhos e perdas durante um período específico, ajudando traders a avaliar a dinâmica atual do mercado. Características Oscila entre 0 e 100, facilitando a interpretação das condições de mercado Identifica com precisão áreas de sobrecomp
FREE
표시기는 현재 시세를 작성하여 과거 시세와 비교할 수 있으며 이를 바탕으로 가격 변동을 예측합니다. 표시기에는 원하는 날짜로 빠르게 이동할 수 있는 텍스트 필드가 있습니다. 옵션: 기호 - 표시기가 표시할 기호 선택. SymbolPeriod - 지표가 데이터를 가져올 기간 선택. IndicatorColor - 표시기 색상. HorisontalShift - 지시자가 그린 따옴표를 지정된 막대 수만큼 이동합니다. Inverse - true는 인용 부호를 반대로, false - 원래 보기를 반전합니다. ChartVerticalShiftStep - 차트를 수직으로 이동합니다(키보드의 위/아래 화살표). 다음은 날짜를 입력할 수 있는 텍스트 필드의 설정으로, '엔터'를 누르면 즉시 이동할 수 있습니다.
Renko System
Marco Montemari
This indicator can be considered as a trading system. It offers a different view to see the currency pair: full timeless indicator, can be used for manual trading or for automatized trading with some expert advisor. When the price reaches a threshold a new block is created according to the set mode. The indicator beside the Renko bars, shows also 3 moving averages. Features renko mode median renko custom median renko 3 moving averages wicks datetime indicator for each block custom notification
Easy GOLD MT5
Franck Martin
3.91 (43)
Easy Gold is the latest addition to the BotGPT family. It is surprising and very powerful. It is ideal for beginners due to its simplicity.  There is absolutely nothing to do, it's 100% automated, simply indicate the percentage of risk you want to take per trade and the EA is ready. Whatever your capital, the EA takes care of everything. Optimized on (XAUUSD).  Unleash all the power with the professional version (AGI Gold) and its connection to the neural network, available in my store. My othe
FREE
개요 Candle Timer Countdown Pro는 현재 캔들의 마감까지 남은 시간을 부드럽고 정확하게 카운트다운으로 표시하며, 원형 진행 아크를 통해 남은 시간을 직관적으로 보여줍니다. 서버 시간 보간(Server Time Interpolation) 기술을 사용하여 틱이 없는 구간에서도 멈춤 없이 부드럽게 작동합니다. M1부터 MN까지 모든 타임프레임을 지원합니다. 스캘핑(1분 차트)부터 스윙 트레이딩(H4 이상)까지, 캔들 마감 시간을 정확히 파악하면 진입 타이밍을 개선하고 성급한 결정을 방지할 수 있습니다. 주요 특징 틱 간 멈춤 없는 정확한 카운트다운 원형 진행 표시 (Ring 또는 Filled Pie) 6가지 표시 위치 선택 가능 3가지 색상 모드 (Manual / Candle Outline / Candle Body) 마감 직전 하이라이트 기능 연결 상태 감지 (Active / Inactive / Disconnected) 새 캔들 알림 (팝업, 이메일, 푸시) 모든 타임
Donchian Channel DC
Renato Takahashi
Donchian Channel DC is the indicator of Donchian Channels, that plots maximum and minimum values of a specific period, besides mean value line. It´s possible to configure simple period for analysis and the indicator will plot all three values. You can trade with this indicator as trend or reversal, according to each strategy. Do not let to test others indicators as soon as others expert advisors.
Alpha Trend Analyzer
Le Trung Kien Hoang
SuperTrend Indicator – Description & Important Notice The SuperTrend is a composite technical indicator designed to help you identify the primary trend, measure its strength, and assess signal quality. However, an indicator is only a tool —it’s never 100% accurate and cannot replace sound risk management. 1. Core Formula & Components ATR (Average True Range): measures price volatility; customize sensitivity via Periods and Multiplier . Upper/Lower Bands: derived from ATR and your chosen source p
FREE
Follow The Line MT5
Oliver Gideon Amofa Appiah
4.6 (35)
This indicator obeys the popular maxim that: "THE TREND IS YOUR FRIEND" It paints a GREEN line for BUY and also paints a RED line for SELL. (you can change the colors). It gives alarms and alerts of all kinds. IT DOES NOT REPAINT and can be used for all currency pairs and timeframes. Yes, as easy and simple as that. Even a newbie can use it to make great and reliable trades. NB: For best results, get my other premium indicators for more powerful and reliable signals. Get them here: https://www.m
FREE
BoxInside MT5
Evgeny Shevtsov
5 (4)
This indicator calculates the volume profile and places labels that correspond to the VAH, VAL and POC levels, for each candle individually. Indicator operation features The indicator works on the timeframes from M3 to MN, but it uses the history data of smaller periods: M1 - for periods from M3 to H1, M5 - for periods from H2 to H12, M30 - for the D1 period, H4 - for the W1 period, D1 - for the MN period. The color and location of the VAL, VAH and POC labels on the current candle are considere
FREE
Statistical Arbitrage Spread Generator for Cointegration [MT5] What is Pair Trading? Pair trading is a market-neutral strategy that looks to exploit the relative price movement between two correlated assets — instead of betting on the direction of the market. The idea? When two assets that usually move together diverge beyond a statistically significant threshold, one is likely mispriced. You sell the expensive one, buy the cheap one , and profit when they converge again. It’s a statistica
FREE
Price Magnet — Price Density and Attraction Levels Indicator Price Magnet is a professional analytical tool designed to identify key support and resistance levels based on statistical Price Density. The indicator analyzes a specified historical period and detects price levels where the market spent the most time. These zones act as “magnets,” attracting price action or forming a structural base for potential reversals. Unlike traditional Volume Profile tools, Price Magnet focuses on price-time d
Daily Variation Indicator Daily Variation Indicator shows the percentage difference between the current price and the previous day close. The indicator displays the daily market movement directly on the chart, allowing traders to quickly identify whether the market is moving up or down during the current trading session. It is designed to be lightweight, minimal, and highly configurable while providing clear information about the daily price variation. Features • Displays daily percentage variat
Pyjama Chart
Karim Abdelwahab
Pyjama Chart is a comprehensive technical analysis toolkit for MetaTrader 5, designed to automatically map key historical price structures and key zones on your chart. This professional utility automates the manual charting process for several advanced price-action concepts. It dynamically detects and renders structure points, trend continuation markers, supply/demand imbalances, volatility-based zones, and areas of potential liquidity, providing a complete structural blueprint of the market at
Haven Volume Profile
Maksim Tarutin
4.5 (10)
Haven Volume Profile은 거래량 분포를 기반으로 중요한 가격 수준을 식별하는 데 도움이 되는 다기능 볼륨 프로파일 분석 지표입니다. 시장을 더 잘 이해하고 중요한 진입 및 퇴장 지점을 식별하려는 전문 트레이더를 위해 설계되었습니다. 기타 제품 ->  여기 주요 기능: Point of Control (POC) 계산 - 최대 거래 활동 수준으로, 가장 유동성이 높은 수준을 식별하는 데 도움이 됩니다 Value Area 정의 (높은 활동 영역) 및 사용자 지정 가능한 거래량 비율로 거래 범위를 보다 정확하게 평가할 수 있습니다 틱 거래량과 실제 거래량 모두 지원, 다양한 시장 유형과 거래 전략에 적합 계산 기간(일 수)의 유연한 설정으로 모든 시간 프레임에 도구를 적용할 수 있습니다 터미널의 밝은 테마와 어두운 테마에 자동 적응하여 사용자 인터페이스의 시각적 경험을 향상시킵니다 레벨 시각화가 명확하고 스타일과 색상을 사용자 지정할 수 있어 빠른 의사 결정을 돕습니다 이 지표
FREE
Tenet Support and Resistance Pro
Lucas De Melo Carvalho Cruz
Ideal for scalpers, day traders and swing trades. Automatically identifies key support and resistance levels based on historical price data. It displays real-time trading zones and a precise countdown timer for each candle, helping traders make faster and more confident decisions. Fully customizable for multiple timeframes and instruments. The indicator analyzes historical price data to draw horizontal levels that represent key trading areas. It also displays, in real time, the current zone whe
FREE
VR Grid Mt5
Vladimir Pastushak
3.25 (8)
VR 그리드 표시기는 사용자 정의 설정으로 그래픽 그리드를 생성하도록 설계 되었습니다. 표준 그리드 와 달리 VR 그리드는 원형 레벨 을 구축하는 데 사용됩니다. 사용자의 선택에 따라 라운드 수준 사이의 단계는 임의적일 수 있습니다. 또한 VR Grid는 다른 인디케이터나 유틸리티와는 달리 기간이 바뀌거나 단말기를 재부팅해도 그리드의 위치 를 유지합니다. 설정, 세트 파일, 데모 버전, 지침, 문제 해결 등은 다음에서 얻을 수 있습니다. [블로그] 다음에서 리뷰를 읽거나 작성할 수 있습니다. [링크] 버전 [MetaTrader 4] 수직 수준 은 실제 시간 간격을 기준으로 하며 누락 또는 존재하지 않는 기간은 무시 합니다. 따라서 레벨 사이의 단계는 사용자가 선택한 값과 엄격하게 일치합니다. VR 그리드 표시기를 사용할 때 트레이더는 모든 수준에서 스타일 , 수직선 및 수평선의 색상 및 두께를 변경할 수 있습니다. 이를 통해 금융 상품의 라운드 수준 을 제어할 수 있습니다. 라운
FREE
BKT Pro Tooco SR
Khac Thanh Bui
BKT Pro Tooco MetaTrader 5용 멀티 방법 지지 및 저항 툴킷으로, 4가지 선택 가능한 감지 알고리즘을 사용하여 확정된 신호를 재그림 없이 실시간으로 스윙 레벨을 감지합니다. BKT Pro Tooco는 다양한 시장 구조에서 신뢰할 수 있는 구역 감지가 필요한 트레이더를 위해 설계된 MetaTrader 5용 지지 및 저항 지표입니다. 4가지 독립적인 감지 방법을 제공하여 트레이더가 선호하는 매매 스타일에 맞는 알고리즘을 선택할 수 있습니다. 피봇 기반 구조 분석, 돈치안 채널 반전, 연속 캔들 시퀀스, 또는 ZigZag 스윙 식별 중에서 선택 가능합니다. 모든 확정된 구역은 마감된 봉을 기반으로 계산되며 재그림이 발생하지 않습니다.   개요 이 지표는 역사적 가격 움직임과 현재 봉을 스캔하여 중요한 스윙 고점과 저점을 찾아냅니다. 스윙 포인트가 식별되면 ATR 기반 깊이 계산을 사용하여 해당 지지 또는 저항 구역이 구성됩니다. 구역 너비는 두 가지 파라미터로 결정됩니
FREE
Free automatic Fibonacci is an indicator that automatically plots a Fibonacci retracement based on the number of bars you select on the BarsToScan setting in the indicator. The Fibonacci is automatically updated in real time as new highest and lowest values appears amongst the selected bars. You can select which level values to be displayed in the indicator settings. You can also select the color of the levels thus enabling the trader to be able to attach the indicator several times with differe
FREE
DALA Forecast
Grigorii Matsnev
About the indicator: DALA Forecast is a universal tool for predicting the dynamics of time series of any nature. For prediction, modified methods of nonlinear dynamics analysis are used, on the basis of which a predictive model is built using machine learning methods.  To get the trial version of the indicator, you can contact me in private messages. How to use the indicator: Apply the indicator to your chosen financial instrument or indicator with the settings you need. The prediction will be
FREE
PZ Penta O MT5
PZ TRADING SLU
3.5 (4)
The Penta-O is a 6-point retracement harmonacci pattern which usually precedes big market movements. Penta-O patterns can expand and repaint quite a bit. To make things easier this indicator implements a twist: it waits for a donchian breakout in the right direction before signaling the trade. The end result is an otherwise repainting indicator with a very reliable trading signal. The donchian breakout period is entered as an input. [ Installation Guide | Update Guide | Troubleshooting | FAQ | A
FREE
Dynamic Zones
Kee Huang Tan
Dynamic Supply and Demand indicator automatically identifies and displays Supply and Demand Zones on your chart based on price action patterns and market structure.  These zones represent areas where institutional buying or selling pressure has historically occurred, making them key levels for potential price reactions. This form of indicator takes inspiration from ICT as well as traditional Support & Resistance formation. **For the first 50 candles (number depends on LookBackCandles) when indic
FREE
Mitimom
Danil Poletavkin
The indicator is based on Robert Miner's methodology described in his book "High probability trading strategies" and displays signals along with momentum of 2 timeframes. A Stochastic oscillator is used as a momentum indicator. The settings speak for themselves period_1 is the current timeframe, 'current' period_2 is indicated - the senior timeframe is 4 or 5 times larger than the current one. For example, if the current one is 5 minutes, then the older one will be 20 minutes The rest of the s
FREE
Visual Dolphin Indicator
AL MOOSAWI ABDULLAH JAFFER BAQER
Visual Dolphin Indicator Unlock the rhythm of the market with the Visual Dolphin Indicator, your ultimate tool for identifying and capitalizing on market trends with clarity and confidence. Designed for both novice and experienced traders, this indicator eliminates the noise and guesswork, providing crystal-clear buy and sell signals directly on your chart. The Logic Behind the Waves The core of the Visual Dolphin Indicator is a sophisticated yet intuitive dual-wave system based on moving avera
This indicator is a zero-lag indicator and displays  strength of trend change . True Trend  Oscillator Pro works best in combination with True Trend Moving Average Pro that displays exact trend as is. Oscillator value is exact price change in given direction of the trend. True Trend Moving Average Pro: https://www.mql5.com/en/market/product/103586 If you set PERIOD input parameter to 1 this indicator becomes a sharpshooter for binary options. Developers can use True Trend Oscillator in Exper
FREE
Smoothed Heiken Ashi Plus
Daniel Ortega Clemente
5 (1)
Overview: This technical indicator applies a double smoothing algorithm to the standard Heiken Ashi calculation. It is designed to filter market noise and visualize the market structure clearly without the lag associated with standard moving averages. The tool allows the user to select different Moving Average types, including Hull Moving Average (HMA) and Linear Weighted Moving Average (LWMA) , to calculate the open, high, low, and close prices of the candles. Key Features: Double Smoothing En
FREE
Spectral Edge
Aparecida Bertelli Bruna
SpectralEdge Periodogram - Cycle Analysis Indicator Overview The SpectralEdge Periodogram is a powerful technical analysis indicator for MetaTrader 5, designed to uncover hidden price cycles in financial markets using Fast Fourier Transform (FFT). By transforming price data into the frequency domain, this indicator reveals the dominant cycles driving market movements, enabling traders to identify repeating patterns and make informed trading decisions. Whether you're a day trader, swing trader
VFI Quantum
Nikita Berdnikov
5 (1)
Introducing VFI (Volume Flow Indicator) – a trading indicator that analyzes the relationship between volume and price movement to identify key trading opportunities. The indicator displays the strength and direction of volume flow, providing clear signals about potential entry and exit points. Signals are formed based on zero line crossovers, crossovers between the VFI line and its exponential moving average (EMA), and when the indicator exits overbought and oversold zones. Attention! This stra
FREE
이 제품의 구매자들이 또한 구매함
ARIPoint
Temirlan Kdyrkhan
ARIPoint is a powerful trading companion designed to generate high-probability entry signals with dynamic TP/SL/DP levels based on volatility. Built-in performance tracking shows win/loss stats, PP1/PP2 hits, and success rates all updated live. Key Features: Buy/Sell signals with adaptive volatility bands Real-time TP/SL/DP levels based on ATR Built-in MA Filter with optional ATR/StdDev volatility Performance stats panel (Success, Profit/Loss, PP1/PP2) Alerts via popup, sound, push, or email Cu
SuperScalp Pro
Van Minh Nguyen
4.63 (24)
SuperScalp Pro – 고급 멀티 필터 스캘핑 지표 시스템 SuperScalp Pro는 클래식 Supertrend와 여러 지능형 확인 필터를 결합한 고급 스캘핑 지표로, 거래 기회를 식별하는 데 도움을 줍니다. M1부터 H4까지 다양한 시간대에서 효율적으로 작동하며, XAUUSD, BTCUSD 및 주요 Forex 통화쌍에 최적화되어 있습니다. 이 지표는 명확한 매수 및 매도 신호를 제공하며, ATR 기반으로 진입가, 손절가, 익절가를 자동 계산하여 보다 효과적인 리스크 관리를 지원합니다. Fibonacci Take Profit 기능은 중요한 가격 구간에서 더 빠르게 포지션을 청산할 수 있도록 하며, 해당 수준 도달 시 알림을 전송합니다. 기본 설정은 Fibonacci Take Profit이 활성화된 상태로 최적화되어 있으며, 보다 안정적이고 일관된 거래 경험에 중점을 둡니다. 차트에 적용하는 것만으로 즉시 사용할 수 있습니다. 고급 사용자를 위해 모든 파라미터는 자유롭게 사용
Entry In The Zone and SMC Multi Timeframe is a real-time 2-in-1 market analysis tool that combines market structure analysis and a No Repaint BUY / SELL signal system into a single indicator, built on Smart Money Concepts (SMC) — a widely adopted framework used by professional traders to understand market structure. This indicator helps you see the market more clearly, make decisions based on structure rather than guesswork, and focus on high-probability zones where price is more likely to react
Divergence Bomber
Ihor Otkydach
4.9 (88)
이 지표를 구매하신 분께는 다음과 같은 혜택이 무료로 제공됩니다: 각 거래를 자동으로 관리하고, 손절/익절 수준을 설정하며, 전략 규칙에 따라 거래를 종료하는 전용 도우미 툴 "Bomber Utility" 다양한 자산에 맞게 지표를 설정할 수 있는 셋업 파일(Set Files) "최소 위험", "균형 잡힌 위험", "관망 전략" 모드로 설정 가능한 Bomber Utility의 셋업 파일 이 전략을 빠르게 설치, 설정, 시작할 수 있도록 돕는 단계별 영상 매뉴얼 주의: 위의 모든 보너스를 받기 위해서는 MQL5 개인 메시지 시스템을 통해 판매자에게 연락해 주세요. 독창적인 커스텀 지표인 “Divergence Bomber(다이버전스 봄버)”를 소개합니다. 이 지표는 MACD 다이버전스(괴리) 전략을 기반으로 한 올인원(All-in-One) 거래 시스템입니다. 이 기술 지표의 주요 목적은 가격과 MACD 지표 간의 다이버전스를 감지하고, **향후 가격이 어느 방향으로 움직일지를 알려주는
Power Candles MT5
Daniel Stein
5 (8)
Power Candles V3 - 자체 최적화 강도 지표 파워 캔들 V3는 적용된 모든 차트에서 통화 및 상품의 강세를 실행 가능한 거래 계획으로 전환합니다. 단순히 캔들에 색상을 입히는 대신, 백그라운드에서 실시간 자동 최적화를 수행하여 현재 보고 있는 종목에 대한 최적의 손절매, 익절 및 신호 임계값을 제공합니다. 한 번의 클릭으로 실시간 거래에 적용할 수 있으며, 진입점, 손절매 및 익절 선이 정확한 가격에 맞춰 차트에 표시되고, 방향과 함께 알림이 발령됩니다. 이 도구는 Stein Investments 에코시스템의 일부입니다. 18개 이상의 도구와 함께 당신의 1대1 AI 트레이딩 멘토 Max.  항상 대기 중, 모든 인디케이터를 깊이 있게 이해, 무언가를 차근차근 생각해보고 싶은 순간에 도움을 줍니다.  https://stein.investments 에서 만나보세요 매 종가 바마다 3,000회 이상의 트레이딩 시뮬레이션. 9가지 강도 상태. 2가지 전략을 병렬로 테스트.
소개       Quantum Breakout PRO   , 브레이크아웃 존 거래 방식을 변화시키는 획기적인 MQL5 지표! 13년 이상의 거래 경험을 가진 숙련된 트레이더 팀이 개발한       퀀텀 브레이크아웃 PRO       혁신적이고 역동적인 브레이크아웃 존 전략으로 거래 여정을 새로운 차원으로 끌어올리도록 설계되었습니다. Quantum Breakout Indicator는 5개의 이익 목표 영역이 있는 브레이크아웃 영역의 신호 화살표와 브레이크아웃 상자를 기반으로 한 손절 제안을 제공합니다. 초보자 거래자와 전문 거래자 모두에게 적합합니다. Quantum EA 채널:       여기를 클릭하세요 중요한! 구매 후 설치 매뉴얼을 받으려면 개인 메시지를 보내주십시오. 추천: 기간: M15 통화쌍: GBPJPY, EURJPY, USDJPY,NZDUSD, XAUUSD 계정 유형: 스프레드가 매우 낮은 ECN, Raw 또는 Razor 브로커 시간: GMT +3 중개인 :
SignalTech MT5
Yue Wang
5 (21)
SignalTech MT5 is a fully rule based trading system for EURUSD, USDCHF, USDJPY, AUDUSD, NZDUSD, EURJPY, AUDJPY, NZDJPY, CADJPY.  All the winning trades with chart setups are published on the comments page. 2025-12 1174 Pips 2026-01 2624 Pips 2026-02 2937 Pips 2026-03 2165 Pips 2026-04 2243 Pips It can generate signals with Buy/Sell Arrows and Pop-Up/Sound Alerts. Each signal has clear Entry and Stop Loss levels, which should be automatically flagged on the chart, as well as potential Targets 1,
Azimuth Pro
Ottaviano De Cicco
5 (7)
Azimuth Pro V2: Synthetic Fractal Structure and Confirmed Entries for MT5 Overview Azimuth Pro is a multi-level swing structure indicator by Merkava Labs . Four nested swing layers, swing-anchored VWAP, ABC pattern detection, three-timeframe structural filtering, and closed-bar confirmed entries — one chart, one workflow from micro-swings to macro-cycles. This is not a blind signal product. It is a structure-first workflow for traders who care about location, context, and timing. V2 Launch Offe
RelicusRoad Pro MT5
Relicus LLC
4.96 (24)
RelicusRoad Pro: 퀀트 시장 운영 체제 70% 할인 평생 이용권 (한정 시간) - 2,000명 이상의 트레이더와 함께하세요 왜 대부분의 트레이더는 "완벽한" 지표를 가지고도 실패할까요? 진공 상태에서 단일 개념 만으로 거래하기 때문입니다. 문맥 없는 신호는 도박입니다. 지속적인 승리를 위해서는 컨플루언스(중첩) 가 필요합니다. RelicusRoad Pro는 단순한 화살표 지표가 아닙니다. 완전한 퀀트 시장 생태계 입니다. 독점적인 변동성 모델링을 사용하여 가격이 이동하는 "공정 가치 로드"를 매핑하고, 단순 노이즈와 실제 구조적 돌파를 구분합니다. 추측은 그만두세요. 기관급 로드 로직으로 거래를 시작하세요. 핵심 엔진: "Road" 알고리즘 시스템의 중심에는 시장 상황에 실시간으로 적응하는 동적 변동성 채널인 Road Algo 가 있습니다. 세이프 라인(평형) 과 가격이 수학적으로 반전될 가능성이 높은 확장 레벨 을 투영합니다. Simple Road: 일반적인 시장을 위
MetaTrader 5용 스마트 다층 브레이크아웃 및 풀백 탐지기 "스마트하고, 간단하고, 빠르게!" 고확률 브레이크아웃 진입을 놓치는 것에 지치셨나요? 여러 차트를 몇 시간씩 스캔하면서 브레이크아웃을 추세 방향과 통화 모멘텀에 맞추려고 하지만 — 결국 움직임을 놓치고 마나요? Break Pullback은 하나의 지표로 이 모든 문제를 해결합니다. Break Pullback이란 무엇인가요? Break Pullback은 시장 구조, 브레이크아웃, 추세 지속 설정을 거래하는 트레이더를 위해 특별히 설계된 전문가급 MetaTrader 5 지표입니다. 실시간으로 여러 통화 쌍에 걸쳐 Break와 Pullback 형성을 자동으로 감지하고 — 세 가지 확인 레이어를 통해 모든 신호를 필터링합니다: 구조적 브레이크아웃 탐지 — 차트의 주요 브레이크 레벨 식별 HTF 일봉 바이어스 — 진입을 지배적인 일봉 추세 방향에 맞춤 통화 강도 지수 — 쌍을 이룬 통화 간의 모멘텀 불균형 확인 결과: 오
이 지표를 구매하면 제 프로페셔널 트레이드 매니저를 무료로 드립니다. 우선 이 거래 시스템이 리페인팅, 리드로잉 및 레이그 인디케이터가 아니라는 점을 강조하는 것이 중요합니다. 이는 수동 및 로봇 거래 모두에 이상적인 것으로 만듭니다. 온라인 강좌, 설명서 및 프리셋 다운로드. "스마트 트렌드 트레이딩 시스템 MT5"은 새로운 및 경험이 풍부한 트레이더를 위해 맞춤형으로 제작된 종합적인 거래 솔루션입니다. 10개 이상의 프리미엄 인디케이터를 결합하고 7개 이상의 견고한 거래 전략을 특징으로 하여 다양한 시장 조건에 대한 다목적 선택이 가능합니다. 트렌드 추종 전략: 효과적인 트렌드 추이를 타기 위한 정확한 진입 및 손절 관리를 제공합니다. 반전 전략: 잠재적인 트렌드 반전을 식별하여 트레이더가 범위 시장을 활용할 수 있게 합니다. 스캘핑 전략: 빠르고 정확한 데이 트레이딩 및 단기 거래를 위해 설계되었습니다. 안정성: 모든 인디케이터가 리페인팅, 리드로잉 및 레이그가 아니므로 신뢰
Gann Made Easy MT5
Oleg Rodin
5 (4)
Gann Made Easy 는 mr.의 이론을 사용하여 최고의 거래 원칙을 기반으로 하는 전문적이고 사용하기 쉬운 Forex 거래 시스템입니다. W.D. 간. 이 표시기는 Stop Loss 및 Take Profit Levels를 포함하여 정확한 BUY 및 SELL 신호를 제공합니다. PUSH 알림을 사용하여 이동 중에도 거래할 수 있습니다. 구매 후 거래 방법 안내 및 유용한 추가 지표를 무료로 받으시려면 저에게 연락주세요! 아마도 Gann 거래 방법에 대해 이미 여러 번 들었을 것입니다. 일반적으로 Gann의 이론은 초보자 거래자뿐만 아니라 이미 거래 경험이 있는 사람들에게도 매우 복잡한 것입니다. Gann의 거래 방식은 이론적으로 적용하기 쉽지 않기 때문입니다. 나는 그 지식을 연마하고 Forex 지표에 최고의 원칙을 적용하기 위해 몇 년을 보냈습니다. 표시기는 적용하기가 매우 쉽습니다. 차트에 첨부하고 간단한 거래 권장 사항을 따르기만 하면 됩니다. 지표는 지속적으로 시장 분석
Atomic Analyst MT5
Issam Kassas
3.94 (31)
우선적으로 언급할 점은이 거래 지표가 다시 그리지 않고 지연되지 않으며 이를 통해 수동 및 로봇 거래 모두에 이상적이라는 점입니다. 사용자 매뉴얼: 설정, 입력 및 전략. Atomic Analyst는 가격의 강도와 모멘텀을 활용하여 시장에서 더 나은 이점을 찾는 PA Price Action Indicator입니다. 고급 필터를 장착하여 잡음과 거짓 신호를 제거하고 거래 잠재력을 높이는 데 도움이 됩니다. 복잡한 지표의 다중 레이어를 사용하여 Atomic Analyst는 차트를 스캔하고 복잡한 수학적 계산을 간단한 신호와 색상으로 변환하여 초보 트레이더가 이해하고 일관된 거래 결정을 내릴 수 있도록합니다. "Atomic Analyst"는 새로운 및 경험이 풍부한 트레이더를위한 종합적인 거래 솔루션입니다. 프리미엄 지표와 최고 수준의 기능을 하나의 거래 전략에 결합하여 모든 종류의 트레이더에 대한 다재다능한 선택지가되었습니다. 인트라데이 거래 및 스캘핑 전략 : 빠르고 정확한 일일
Quantum TrendPulse
Bogdan Ion Puscasu
5 (24)
SuperTrend   ,   RSI   ,   Stochastic   의 힘을 하나의 포괄적인 지표로 결합하여 트레이딩 잠재력을 극대화하는 궁극의 트레이딩 도구   인 Quantum TrendPulse를   소개합니다. 정밀성과 효율성을 추구하는 트레이더를 위해 설계된 이 지표는 시장 추세, 모멘텀 변화, 최적의 진입 및 종료 지점을 자신 있게 식별하는 데 도움이 됩니다. 주요 특징: SuperTrend 통합:   주요 시장 추세를 쉽게 따라가고 수익성의 물결을 타세요. RSI 정밀도:   매수 과다 및 매도 과다 수준을 감지하여 시장 반전 시점을 파악하는 데 적합하며 SuperTrend 필터로 사용 가능 확률적 정확도:   변동성이 큰 시장에서 숨겨진 기회를 찾기 위해 확률적 진동   을 활용하고 SuperTrend의 필터로 사용 다중 시간대 분석:   M5부터 H1 또는 H4까지 다양한 시간대에 걸쳐 시장을 최신 상태로 유지하세요. 맞춤형 알림:   맞춤형 거래 조건이 충족되면
Market Structure Order Block Dashboard MT5는 시장 구조와 주요 가격 반응 구역을 차트에서 직접 읽고자 하는 트레이더를 위해 설계된 MT5 지표입니다. BOS, ChoCH, 오더 블록, Fair Value Gap (FVG), 유동성, Kill Zones, Volume Profile 그리고 빠른 분석을 위한 콤팩트한 대시보드를 결합합니다. 이 지표는 시장 구조, ICT 및 Smart Money 개념을 의사결정 프레임워크로 사용하는 트레이더를 대상으로 합니다. 추세 지속, 가능한 반전, 가격 불균형, 유동성 타겟 및 관심 구역을 보다 체계적으로 식별하는 데 도움을 줄 수 있습니다. 구매자를 위한 포함 리소스 구매 후 MQL5 개인 메시지로 요청하시면 완전한 PDF 사용 설명서와 파라미터 설정 팁을 제공해 드립니다. MQL5 개인 메시지를 통한 직접 기술 지원. 1.20 버전은 두 가지 주요 추가 기능을 제공합니다: Pending BOS / Pending
FX Trend MT5 NG
Daniel Stein
5 (4)
FX Trend NG: 차세대 멀티 마켓 트렌드 인텔리전스 개요 FX Trend NG 는 다중 시간 프레임 기반의 전문 트렌드 분석 및 시장 모니터링 도구입니다. 몇 초 만에 전체 시장 구조를 파악할 수 있도록 설계되었습니다. 여러 차트를 일일이 전환할 필요 없이, 어떤 종목이 추세에 있는지, 어디에서 모멘텀이 약화되고 있는지, 그리고 어떤 시간 프레임이 서로 정렬되어 있는지 즉시 확인할 수 있습니다. 출시 기념 특별 혜택 – FX Trend NG 를 $30 (6개월) 또는 $80 평생 라이선스 로 이용할 수 있습니다. 이미 Stein Investments 고객이신가요? -> 메시지를 보내 전용 고객 그룹에 참여하세요. 설정이나 사용 방법이 필요하신가요? -> Stein Investments 공식 페이지 를 방문하세요. 1. FX Trend NG가 특별한 이유 3단계 추세 로직 – 단순한 Buy / Sell이 아닙니다 • 대부분의 지표는 Buy 또는 Sell 두 가지 상태만 제
Btmm state engine pro
Garry James Goodchild
5 (4)
BTMM State Engine Pro is a MetaTrader 5 indicator for traders who use the Beat The Market Maker approach: Asian session context, kill zone timing, level progression, peak formation detection, and a multi-pair scanner from a single chart. It combines cycle state logic with a built-in scanner dashboard so you do not need the same tool on many charts at once. What it does Draws the Asian session range; session times can follow broker server offset or be set in inputs. Tracks level progression (L
우선적으로, 이 거래 도구는 전문적인 거래에 이상적인 비-다시 그리기 및 지연되지 않는 지표입니다.  온라인 강좌, 사용자 매뉴얼 및 데모. 스마트 가격 액션 컨셉트 인디케이터는 신규 및 경험 많은 트레이더 모두에게 매우 강력한 도구입니다. Inner Circle Trader Analysis 및 Smart Money Concepts Trading Strategies와 같은 고급 거래 아이디어를 결합하여 20가지 이상의 유용한 지표를 하나로 결합합니다. 이 인디케이터는 스마트 머니 컨셉트에 중점을 두어 대형 기관의 거래 방식을 제공하고 이동을 예측하는 데 도움을 줍니다.  특히 유동성 분석에 뛰어나 기관이 어떻게 거래하는지 이해하는 데 도움을 줍니다. 시장 트렌드를 예측하고 가격 변동을 신중하게 분석하는 데 탁월합니다. 귀하의 거래를 기관 전략에 맞추어 시장의 동향에 대해 더 정확한 예측을 할 수 있습니다. 이 인디케이터는 시장 구조를 분석하고 중요한 주문 블록을 식별하고 다양
Grabber System MT5
Ihor Otkydach
4.83 (23)
탁월한 기술적 지표인 Grabber를 소개합니다. 이 도구는 즉시 사용 가능한 “올인원(All-Inclusive)” 트레이딩 전략으로 작동합니다. 하나의 코드 안에 강력한 시장 기술 분석 도구, 매매 신호(화살표), 알림 기능, 푸시 알림이 통합되어 있습니다. 이 인디케이터를 구매하신 모든 분들께는 다음의 항목이 무료로 제공됩니다: Grabber 유틸리티: 오픈 포지션을 자동으로 관리하는 도구 단계별 영상 매뉴얼: 설치, 설정, 그리고 실제 거래 방법을 안내 맞춤형 세트 파일: 인디케이터를 빠르게 자동 설정하여 최고의 성과를 낼 수 있도록 도와줍니다 다른 전략은 이제 잊어버리세요! Grabber만이 여러분을 새로운 트레이딩의 정점으로 이끌어 줄 수 있습니다. Grabber 전략의 주요 특징: 거래 시간 프레임: M5부터 H4까지 거래 가능한 자산: 어떤 자산이든 사용 가능하지만, 제가 직접 테스트한 종목들을 추천드립니다 (GBPUSD, GBPCAD, GBPCHF, AUDCAD, AU
OrderFlux | MetaTrader 5용 풋프린트 오더플로우 버전 2.0 – 액티브 트레이더를 위한 실시간 Bid/Ask 시각화 OrderFlux는 MT5를 위한 풋프린트 및 오더플로우 지표입니다. 가격이 어디로 이동했는지뿐만 아니라, 그 움직임 내부에서 어떤 일이 발생하고 있는지(가격 수준별 Bid/Ask 거래량, 델타, 임밸런스, 거래량 분포)를 보여줍니다. 많은 차트가 캔들의 최종 결과만 보여줍니다. OrderFlux는 그곳에 도달하기까지의 과정을 보여줍니다. 이것이 바로 캔들 모양뿐만 아니라 시장 참여자들의 동향을 읽고자 할 때 정확히 도움이 되는 부분입니다. 라이브 차트에서 OrderFlux는 주로 다음 세 가지 질문에 답합니다: 현재 어디에서 공격적인 매수 또는 매도 압력이 시장에 진입하고 있는가? 어떤 가격 수준에서 거래량이 흡수되거나 거부되고 있는가? 현재의 움직임이 세션 컨텍스트(배경)에 어떻게 부합하는가? 인터페이스에서 제공되는 기능 메인 차트는 Canvas
Crystal Heikin Ashi Signals
Muhammad Jawad Shabir
5 (2)
Crystal Heikin Ashi Signals - Professional Trend & Signal Detection Indicator Advanced Heikin Ashi Visualization with Intelligent Signal System for Manual & Automated Trading Final Price: $149 ---------> Price goes up $10 after every 10 sales . Limited slots available — act fast . Overview Crystal Heikin Ashi Signals is a professional-grade MetaTrader 5 indicator that combines pure Heikin Ashi candle visualization with an advanced momentum-shift detection system. Designed for both manual traders
SMC Intraday Formula
Kareem Abbas
5 (8)
먼저 솔직하게 말하겠습니다. 어떤 인디케이터도 단독으로 당신을 수익성 있게 만들어주지 않습니다. 누군가 그렇게 말한다면, 그는 당신에게 꿈을 파는 것입니다. 완벽한 매수/매도 화살표를 보여주는 모든 인디케이터는 완벽하게 보이도록 만들 수 있습니다 — 단지 올바른 과거 구간을 확대하고 승리한 거래만 캡처하면 됩니다. 우리는 그렇게 하지 않습니다.  SMC Intraday Formula는 도구입니다. 시장 구조를 읽고, 가장 높은 확률의 가격 구간을 표시하며, 현재 스마트 머니의 흐름이 어떻게 보이는지 아주 단순한 언어로 보여줍니다. 최종 결정은 여전히 당신이 합니다. 실행도 당신이 합니다. 하지만 이제는 희망이 아니라 정확성으로 거래하게 됩니다. 우리는 이 인디케이터를 지난 약 3년 동안 골드(XAUUSD) 및 주요 외환 통화쌍의 데이 트레이딩 스캘핑에 사용해 왔습니다. M1, M5, M15, M30에서 우리의 핵심 도구입니다. 이 도구는 미래를 예측하려 하지 않습니다 — 지금 형성
Super Signal Market Slayer 비재페인트 | 고정확도 | 멀티 마켓 지능형 추세 지표 트레이딩에서 진짜 어려운 것은 주문이 아니라, 시장 변동 속에서 추세가 시작되는 순간을 정확히 파악하는 것입니다. Market Slayer 는 이를 위해 만들어졌습니다. 이 지표는 데이 트레이딩을 위해 설계된 비재페인트 지능형 지표입니다. 다중 확인 및 추세 필터링을 통해 중요한 시점에서만 명확하고 신뢰할 수 있는 Buy / Sell 신호를 제공합니다. 핵심 장점 비재페인트 신호 한 번 생성된 신호는 이동하거나 사라지지 않습니다. 고정확도 추세 판단 다양한 종목에서 테스트되었으며, 특히 골드 M5 / M15에서 안정적인 성과를 보입니다. 멀티 마켓 지원 골드, 외환, 지수, 주요 암호화폐 지원. 데이 트레이딩 최적화 M5, M15에 집중하여 노이즈를 줄이고 실행력을 향상. 직관적 구조 초보자도 쉽게 이해하고 사용할 수 있습니다. 기술 로직 요약 Market Slayer 는 단일
" Dynamic Scalper System MT5 " 지표는 추세 파동 내에서 스캘핑 방식으로 거래하도록 설계되었습니다. 주요 통화쌍 및 금에서 테스트되었으며, 다른 거래 상품과의 호환성이 가능합니다. 추가적인 가격 변동 지원을 통해 추세에 따라 단기 포지션 진입 신호를 제공합니다. 지표의 원리 큰 화살표는 추세 방향을 결정합니다. 작은 화살표 형태의 스캘핑 신호를 생성하는 알고리즘은 추세 파동 내에서 작동합니다. 빨간색 화살표는 상승 방향을, 파란색 화살표는 하락 방향을 나타냅니다. 민감한 가격 변동선은 추세 방향으로 그려지며, 작은 화살표의 신호와 함께 작용합니다. 신호는 다음과 같이 작동합니다. 적절한 시점에 선이 나타나면 진입 신호가 형성되고, 선이 있는 동안 미결제 포지션을 유지하며, 완료되면 거래를 종료합니다. 권장되는 작업 시간대는 M1~H4입니다. 화살표는 현재 캔들에 형성되며, 다음 캔들이 이미 시작되었더라도 이전 캔들의 화살표는 다시 그려지지 않습니다. 입
Basic Harmonic Patterns Dashboard MT5
Mehran Sepah Mansoor
4.36 (11)
이 대시보드는 선택한 심볼에 대해 사용 가능한 최신 고조파 패턴을 표시하므로 시간을 절약하고 더 효율적으로 사용할 수 있습니다 /   MT4 버전 . 무료 인디케이터:   Basic Harmonic Pattern 인디케이터 열 Symbol :   선택한 심볼이 나타납니다 Trend :   강세 또는 약세 Pattern :   패턴 유형(가틀리, 나비, 박쥐, 게, 상어, 사이퍼 또는 ABCD) Entry :   진입 가격 SL:   스톱로스 가격 TP1:   1차 테이크프로핏 가격 TP2:   2차 테이크프로핏 가격 TP3:   3차 테이크프로핏 가격 Current price:   현재 가격 Age (in bars):   마지막으로 그려진 패턴의 나이 주요 입력 Symbols :   "28개 주요 통화쌍" 또는 "선택한 심볼" 중에서 선택합니다. Selected Symbols :   쉼표로 구분하여 모니터링하려는 원하는 심볼("EURUSD,GBPUSD,XAUUSD")을 선택
OmniSync Projection
Antonio-alin Teculescu
5 (1)
Chronos Fractal Engine is an innovative price projection indicator for MetaTrader 5, designed to transform your technical analysis by intelligently identifying and projecting historical price patterns. Built upon an advanced correlation algorithm and the fractal principles of the market, this powerful tool visualizes potential future price movements, giving you a unique edge in your trading decisions. What is Chronos Fractal Engine? At its core, the Chronos Fractal Engine employs a sophisticat
Meridian Pro
Ottaviano De Cicco
5 (2)
Meridian Pro 2.00: Professional Multi-Timeframe Trend Matrix for MT5 Meridian Pro 2.00 is a professional adaptive trend matrix for MetaTrader 5. It combines the original Meridian trend engine, a clean chart ribbon, closed-bar signal arrows, an 8-timeframe dashboard, Fuel momentum, weighted consensus, synthetic HTF processing and chart-native higher-timeframe context lines. The goal is simple: read current trend, multi-timeframe structure, strength, momentum and EA-ready state from one discipline
FX Power MT5 NG
Daniel Stein
5 (31)
FX Power: 통화 강세 분석으로 더 스마트한 거래 결정을 개요 FX Power 는 어떤 시장 상황에서도 주요 통화와 금의 실제 강세를 이해하기 위한 필수 도구입니다. 강한 통화를 매수하고 약한 통화를 매도함으로써 FX Power 는 거래 결정을 단순화하고 높은 확률의 기회를 발견합니다. 트렌드를 따르거나 극단적인 델타 값을 사용해 반전을 예측하고자 한다면, 이 도구는 귀하의 거래 스타일에 완벽히 적응합니다. 단순히 거래하지 말고, FX Power 로 더 스마트하게 거래하세요. 1. FX Power가 거래자에게 매우 유용한 이유 통화와 금의 실시간 강세 분석 • FX Power 는 주요 통화와 금의 상대적 강세를 계산하고 표시하여 시장 역학에 대한 명확한 통찰력을 제공합니다. • 어떤 자산이 앞서고 있고 어떤 자산이 뒤처지는지 모니터링하여 보다 현명한 거래 결정을 내릴 수 있습니다. 포괄적인 멀티 타임프레임 뷰 • 단기, 중기 및 장기 타임프레임에서 통화와 금의 강세를
Market Structure Patterns
Samuel Manoel De Souza
4.47 (19)
Market Structure Patterns   is an indicator based on   smart money concepts   that displays   SMC/ICT   elements that can take your trading decisions to the next level. Take advantage of the   alerts ,   push notifications   and   email messages   to keep informed from when an element is formed on the chart, the price crosses a level and/or enters in a box/zone. Developers can access the values of the elements of the indicator using the   global variables  what allows the automation of trading
Trend indicator AI mt5
Ramil Minniakhmetov
5 (17)
트렌드 인공 지능 지표는 실행 가능한 진입 점 및 반전 경고와 추세 식별을 결합하여 상인의 시장 분석을 향상시킬 훌륭한 도구입니다. 이 표시기는 사용자가 자신감과 정밀도로 외환 시장의 복잡성을 탐색 할 수 있도록 지원합니다 기본 신호 외에도 트렌드 인공 지능 지표는 풀백 또는 되돌림 중에 발생하는 2 차 진입 점을 식별하여 거래자가 기존 트렌드 내에서 가격 수정을 활용할 수 있도록합니다. 중요한 장점: ·작동 4 및 5 *명확한 구매 또는 판매 신호 *다시 칠하지 않습니다 *모든 자산에서 작동 나는 전보 사기에 개 또는 세트를 판매하지 않도록주의. 모든 설정은 블로그에 여기에 무료.  중요! 지침 및 보너스를 얻기 위해 구입 후 즉시 저에게 연락! 진짜 가동 감시는 뿐 아니라 나의 다른 제품 여기에서 찾아낼 수 있습니다: https://www.mql5.com/en/users/mechanic/seller&nbsp ; 설정 및 입력: 모든 자산에 대해 기본 설정을 권
제작자의 제품 더 보기
Madrid Ribbon
Mohammad Taher Halimi Tabrizi
Category: Trend Indicator Platform: MetaTrader 5 Type: Level Indicator Timeframes: All Trader Styles: Scalping, Day Trading, Swing Trading Markets: All Description The Madrid Ribbon is a moving average–based trend visualization tool. It combines multiple exponential or simple moving averages into a ribbon structure that adapts to market changes. The indicator highlights trend direction, possible reentry zones, and areas where reversals may occur. Main features: Dynamic Trend Display – Multiple m
Optimized Trend Tracker OTT
Mohammad Taher Halimi Tabrizi
Optimized Trend Tracker (OTT) Indicator The Optimized Trend Tracker (OTT) is a custom indicator designed to visualize trend direction and potential changes based on a configurable moving average and dynamic support/resistance levels. It provides multiple visualization and signal options, making it suitable for discretionary analysis or integration into automated systems. Key Features Configurable Moving Average Types Supports SMA, EMA, WMA, TMA, VAR, WWMA, ZLEMA, and TSF for flexible calculatio
Super Trend Trading View 4
Mohammad Taher Halimi Tabrizi
The SuperTrend indicator is a popular technical analysis tool used by traders and investors to identify trends in the price of a financial instrument, such as a stock, currency pair, or commodity. It is primarily used in chart analysis to help traders make decisions about entering or exiting positions in the market. this version of super trend indicator is exactly converted from trading view to be used in MT4
UT Bot Alerts MT5
Mohammad Taher Halimi Tabrizi
5 (2)
This indicator is converted from UT Bot alerts indicator by @QuantNomad of Trading View to MT5. its considering ATR and creating new candles on chart and also is giving good entry points based on its candles. all buffers of new candles and also entry signals are included as buffer so can be used easily on any EA. there are also some different strategies on the internet that can be used or contact me to create it for you.
Better RSI With Tester
Mohammad Taher Halimi Tabrizi
Category: Trend Indicator Platform: MetaTrader 5 Type: Entry Indicator Timeframes: All Trader Styles: Scalping, Day Trading, Swing Trading, Binary Options Markets: All Description This indicator is an enhanced version of the Relative Strength Index (RSI) with additional features for visual clarity and cycle detection. It is designed to provide traders with a clearer view of momentum conditions and potential turning points. Main features: Improved RSI Visualization – The indicator displays RSI va
Smart FVG Levels Indicator for MT5
Mohammad Taher Halimi Tabrizi
Smart FVG Levels Indicator for MT5 Introduction Smart FVG Levels Indicator is designed to automatically detect and display Fair Value Gaps (FVG) on MetaTrader 5 charts. It provides a structured way to visualize price imbalances and potential reaction zones. Settings General Settings Number of candles used for calculations Option to hide overlapping levels FVG Settings Enable or disable FVG levels Support level color Resistance level color Show level labels Display recent levels (limit number of
Binance Chart
Mohammad Taher Halimi Tabrizi
Product Description: Effortlessly bridge the gap between Binance and MetaTrader 5 with this sleek integration tool. Designed for traders who demand precision and real-time data, this product fetches live Binance chart information directly into MT5, enabling seamless technical analysis and strategy execution. Whether you're tracking candlestick patterns or refining your forex indicators, this tool ensures your MT5 environment stays synced with the crypto market pulse. Getting Started: Place the
FREE
Magic Moving Indicator
Mohammad Taher Halimi Tabrizi
This is a very powerful indicator which is very useful in trend detection the way is used is similar to moving average but giving very reliable results. principle is very easy, that depicts a mobile support and resistance line when the price is below the orange line the trend is bearish and the line act as resistance and as soon as the resistance is broken and price is above the line then the trend becomes bullish and the line changes into the support line. this can be used in any time frames. i
ATR Stops
Mohammad Taher Halimi Tabrizi
ATR Stops is an indicator which shows Dynamic support and resistance lines by considering ATR value and also a multiplier. its highly effective to find out the trend direction and also is useful for using as stop loss levels. it could be used in different ways one usual way is to buy when line becomes green and sell when it becomes red. when its combined with money management rules and risk reward considerations there is good results.
PP Super Trend MT4
Mohammad Taher Halimi Tabrizi
Pivot Point Super Trend is another type of famous super trend indicator which is equipped with pivot points in different way. this indicator used to be available in the Trading view and this is converted from there to the MT4 language. MT5 version of the indicator is also available and you can find in my products. there are also buy/sell signals shown on the screen.
SuperTrend Kivanc Ozbilgic
Mohammad Taher Halimi Tabrizi
Here is another version of famous Super Trend indicators which is modified by Kivanc Ozbilgic. I have get the code from Trading View and converted it to MT4 language. this is great opportunity for Trading View users who want to migrate to MT4 so can test this indicator and also make their custom EAs based on it. there are much more inputs than standard super trend also there are up/down arrows with alarms as well.
QQE MOD of Trading View 4
Mohammad Taher Halimi Tabrizi
The QQE indicator is a momentum-based indicator used to identify trends and sideways. The Qualitative Quantitative Estimate (QQE) indicator works like a smoothed version of the popular Relative Strength Index (RSI) indicator. QQE extends the RSI by adding two volatility-based trailing stops. This indicator is converted from Trading View QQE MOD by Mihkel00 to be used in MT4 Version.
Angel Algo MT4
Mohammad Taher Halimi Tabrizi
The "Angel Algo" indicator, designed for the TradingView platform, is a powerful technical analysis tool that assists traders in identifying dynamic support and resistance levels in real-time. It provides valuable insights into potential breakout points and market regimes. At its core, the "Angel Algo" indicator utilizes a rolling window of price data to calculate maximum and minimum price levels. It then dynamically identifies support and resistance levels by examining specific conditions rela
Best Renko Chart Generator
Mohammad Taher Halimi Tabrizi
5 (1)
This is the Best Renko chart generator ever in the market you can set the box sizes based on ATR or Fixed Size: 1. Fixed Box Size 2. Current ATR Size 3. ATR size of the Chart Start Time. also you can set the Renko chart cut of date and time to start as reference of creating renko charts. you need to attach to a symbol chart that want the renko chart of it, then immediately a new chart will be opened which is based on renko, you can use this generated chart and attach your EA to trade on or you e
ATR Stops MT5
Mohammad Taher Halimi Tabrizi
ATR Stops is an indicator which shows Dynamic support and resistance lines by considering ATR value and also a multiplier. its highly effective to find out the trend direction and also is useful for using as stop loss levels. it could be used in different ways one usual way is to buy when line becomes green and sell when it becomes red. when its combined with money management rules and risk reward considerations there is good results.
PP Super Trend MT5
Mohammad Taher Halimi Tabrizi
Pivot Point Super Trend is another type of famous super trend indicator which is equipped with pivot points in different way. this indicator used to be available in the Trading view and this is converted from there to the MT5 language. MT4 version of the indicator is also available and you can find in my products. there are also buy/sell signals shown on the screen.
Schaff Trend Cycle STC
Mohammad Taher Halimi Tabrizi
The Schaff Trend Cycle indicator is the product of combining Slow Stochastics and the moving average convergence/divergence (MACD). The MACD has a reputation as a trend indicator, but it's also notorious for lagging due to its slow responsive signal line. The improved signal line gives the STC its relevance as an early warning sign to detect currency trends. this indicator is converted from Trading View code of STC Indicator - A Better MACD [SHK]
HIGH and LOW OTT
Mohammad Taher Halimi Tabrizi
This product is converted form Trading View of Kivanc Ozbilgic to be used on MT5 and below are descriptions of developer on Trading View: Anıl Özekşi's latest development on his precious OTT - Optimized Trend Tracker: In this version, there are two lines of OTT which are derived from HIGHEST price values (HOTT) and LOVEST price values (LOTT) which were originally sourced to CLOSE values on default OTT. Another significant difference is there is no Support Line (Moving Average) in this version
Stock Trend Navigator
Mohammad Taher Halimi Tabrizi
In the fast-paced and ever-evolving world of stock trading, having a reliable compass is essential for navigating the complexities of the financial markets. Meet the Stock Trade Navigator, your trusted partner in the quest for investments. Unlock the Power of Data: Our Stock Trade Navigator is not just a tool; it's your data-driven co-pilot. Harnessing cutting-edge algorithms and real-time market data, it empowers you with a comprehensive view of the financial landscape, enabling you to make inf
QQE MOD of Trading View 5
Mohammad Taher Halimi Tabrizi
The QQE indicator is a momentum-based indicator used to identify trends and sideways. The Qualitative Quantitative Estimate (QQE) indicator works like a smoothed version of the popular Relative Strength Index (RSI) indicator. QQE extends the RSI by adding two volatility-based trailing stops. This indicator is converted Qfrom Trading View QQE MOD by Mihkel00 to be used in MT5 Version.
Super Trend Trading View 5
Mohammad Taher Halimi Tabrizi
The SuperTrend indicator is a popular technical analysis tool used by traders and investors to identify trends in the price of a financial instrument, such as a stock, currency pair, or commodity. It is primarily used in chart analysis to help traders make decisions about entering or exiting positions in the market. this version of super trend indicator is exactly converted from trading view to be used in MT5
MT5 Trades To Telegram
Mohammad Taher Halimi Tabrizi
The Trades To Telegram is a powerful and customizable trading assistant designed to bridge the gap between the MetaTrader 5 platform and the popular messaging app, Telegram. This bot serves as a crucial tool for traders, providing them with timely and accurate trading signals, alerts, and updates directly to their Telegram accounts. Key Features: Real-Time Signals: The bot monitors the MetaTrader 5 platform continuously, detecting trading signals, such as Opening/Closing of  buy/sell orders , a
Angel Algo MT5
Mohammad Taher Halimi Tabrizi
The "Angel Algo" indicator, designed for the TradingView platform, is a powerful technical analysis tool that assists traders in identifying dynamic support and resistance levels in real-time. It provides valuable insights into potential breakout points and market regimes. At its core, the "Angel Algo" indicator utilizes a rolling window of price data to calculate maximum and minimum price levels. It then dynamically identifies support and resistance levels by examining specific conditions rela
Heiken Ashi Smoothed MT5
Mohammad Taher Halimi Tabrizi
Heiken Ashi Smoothed – The Ultimate Trend Filtering Indicator for MT5   Enhance Your Trading with Smoother Trends!   The Heiken Ashi Smoothed indicator is a powerful tool designed for traders who want clearer trend signals while eliminating market noise. Unlike traditional Heiken Ashi candles, this smoothed version provides fluid, lag-free price action , making it perfect for swing trading, trend following, and long-term analysis. Key Features: Crystal-Clear Trends – Filters out market noise for
Linear Regression Line
Mohammad Taher Halimi Tabrizi
What is Linear Regression? Linear regression is a statistical method used to model the relationship between price and time. In forex trading, it helps traders identify trends, potential reversals, and areas of support and resistance. Uses of Linear Regression in Forex Trading Trend Identification The regression line acts as a dynamic trendline, showing whether the market is trending upward or downward. Traders can use the slope of the regression line to measure trend strength. Support and Resist
Range Detector by LuxAlgo
Mohammad Taher Halimi Tabrizi
This indicator is converted from Pinescript to MQL5 and consisting of buffers for the range lines as well, its not only object. The Range Detector indicator aims to detect and highlight intervals where prices are ranging. The extremities of the ranges are highlighted in real-time, with breakouts being indicated by the color changes of the extremities.   USAGE Ranging prices are defined by a period of stationarity, that is where prices move within a specific range. Detecting ranging marke
Two Pole Oscilator
Mohammad Taher Halimi Tabrizi
Category: Oscillator Indicator Platform: MetaTrader 5 Type: Entry Indicator Timeframes: All Trader Styles: Scalping, Day Trading, Swing Trading, Binary Options Markets: All Description The Two-Pole Oscillator is an analytical tool based on deviation calculations and a two-pole smoothing filter. It is designed to highlight momentum conditions and potential trading signals while filtering out short-term noise. Main features: Two-Pole Filtering – Reduces chart noise for smoother oscillator curves.
Slope MA with Tester
Mohammad Taher Halimi Tabrizi
Rule-compliant Description Category: Trend Indicator Platform: MetaTrader 5 Type: Level Indicator Timeframes: All Trader Styles: Scalping, Day Trading, Swing Trading Markets: All Description The Slope MA With Tester is a technical indicator that evaluates the slope of a moving average relative to volatility (ATR). It highlights directional bias through a color-coded slope line and plots entry arrows when slope conditions change. Main features: Slope-based Calculation – The slope of an EMA is nor
Market Structure Break and Order Block
Mohammad Taher Halimi Tabrizi
Market Structure Break & Order Block (MSB-OB) The Market Structure Break & Order Block (MSB-OB) indicator is built to analyze price structure, highlight market structure breaks, and mark order block zones. It also provides buffers for Buy/Sell signals and MSB detection, making it suitable for both manual analysis and automated strategies. A tester panel is included to evaluate performance under different conditions in the Strategy Tester. Main Concept Market Structure Break (MSB): Occurs after
Squeeze momentum Indicator for MT5
Mohammad Taher Halimi Tabrizi
The Smart Squeeze Momentum Indicator MT5 is a powerful trading tool that helps traders identify periods of market contraction, expansion, and potential trend reversals . Built on the proven concepts of Bollinger Bands and Keltner Channels , this indicator detects “squeeze” conditions and provides a clear momentum histogram along with buy and sell trading signals . Key Features Momentum Histogram – Visualizes the strength and direction of market momentum. Squeeze Detection – Identifies low-vol
필터:
shrtsirkit
695
shrtsirkit 2026.02.13 15:07 
 

I've been running the indicator for a couple of days and so far the signals have been positive. And the support has been the best

Mohammad Taher Halimi Tabrizi
38393
개발자의 답변 Mohammad Taher Halimi Tabrizi 2026.02.13 15:41
thank you very much for your interest, let me know whenever you need anything.
리뷰 답변