ATR Stops MT5
- 지표
-
Mohammad Taher Halimi Tabrizi
 I have been studied financial markets in the university and programmed successful experts and scripts for MT4 & MT5 for many years.
I have done more than 500 jobs and have 5 stars out of 5 where you can read all of previous clients review in below link: - 버전: 1.0
- 활성화: 5
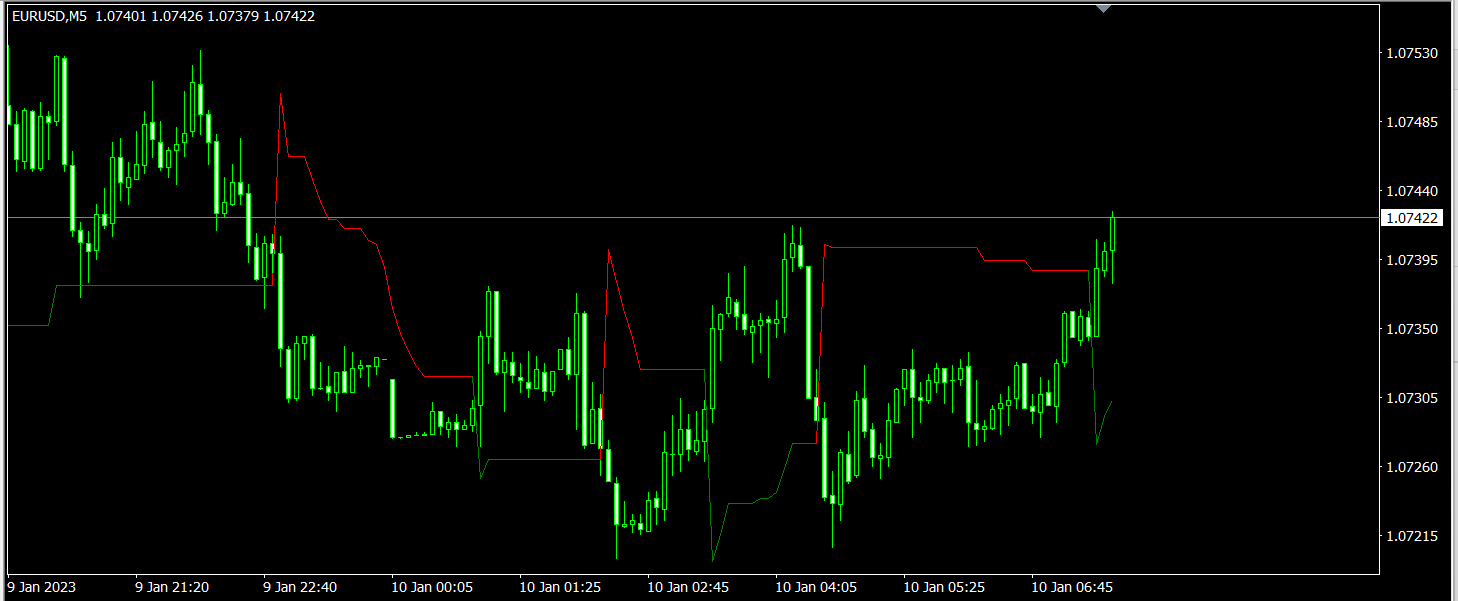
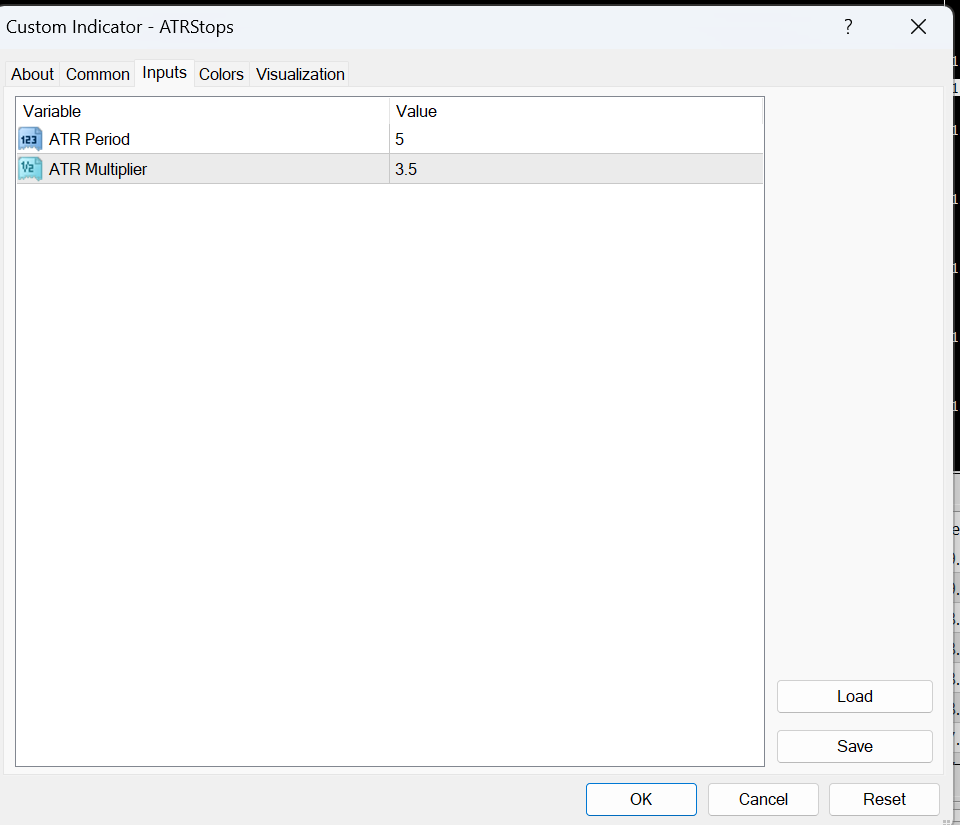
ATR Stops is an indicator which shows Dynamic support and resistance lines by considering ATR value and also a multiplier.
its highly effective to find out the trend direction and also is useful for using as stop loss levels.
it could be used in different ways one usual way is to buy when line becomes green and sell when it becomes red.
when its combined with money management rules and risk reward considerations there is good results.