Precision Breakout Pro
- 지표
-
James Patrick D Artanion Grieves
 저는 진정으로 효과적인 전문가 자문(EA), 지표, 유틸리티 및 거래 전략을 개발합니다. 제 전문 분야는 다음과 같습니다.
언어 및 프레임워크: MQL4, MQL5, OOP, OpenCL
인터페이스: 패널, 객체 및 사용자 인터페이스
분야: 자동 거래, 수동 수익, 전략 개발
추가 자료: 고객이 실수를 했을 때 이를 알리고 성공으로 안내하세요.
시장의 비효율성을 악용하기 위해 모듈화되고 확장 가능하며 심리적으로 설계된 무언가를 찾고 있다면, 저를 믿으세요. 사소한 것을 찾고 있다면 다른 곳을 찾아보세요. - 버전: 10.8
- 업데이트됨: 11 8월 2025
- 활성화: 10
- 작동 원리
핵심 개념
이 지표는 횡보 구간(범위)을 파악하고 가격이 해당 범위 위 또는 아래로 돌파할 때 신호를 생성하는 범위 돌파형 매매 지표입니다. 추세 모드와 평균 회귀 모드 모두에서 작동합니다.
주요 구성 요소:
1. 범위 식별
- 범위 기간 : 각 거래일의 특정 시간대를 정의합니다(예: 오전 10시~오후 12시)
- 범위 계산 : 이 기간 동안 지표는 가장 높은 최고가와 가장 낮은 최저가를 추적합니다.
- 거래일 : 월요일부터 금요일까지 구성 가능
2. 범위 모드
- SAME_DAY : 범위와 거래가 같은 날에 발생합니다.
- OVER_NIGHT : 범위가 밤새도록 확장될 수 있습니다.
- NEXT_DAY : 범위가 하루로 설정되고 거래 신호는 다음 날에 발생합니다.
3. 신호 생성
표시기는 다음을 생성합니다. 4가지 유형의 신호 :
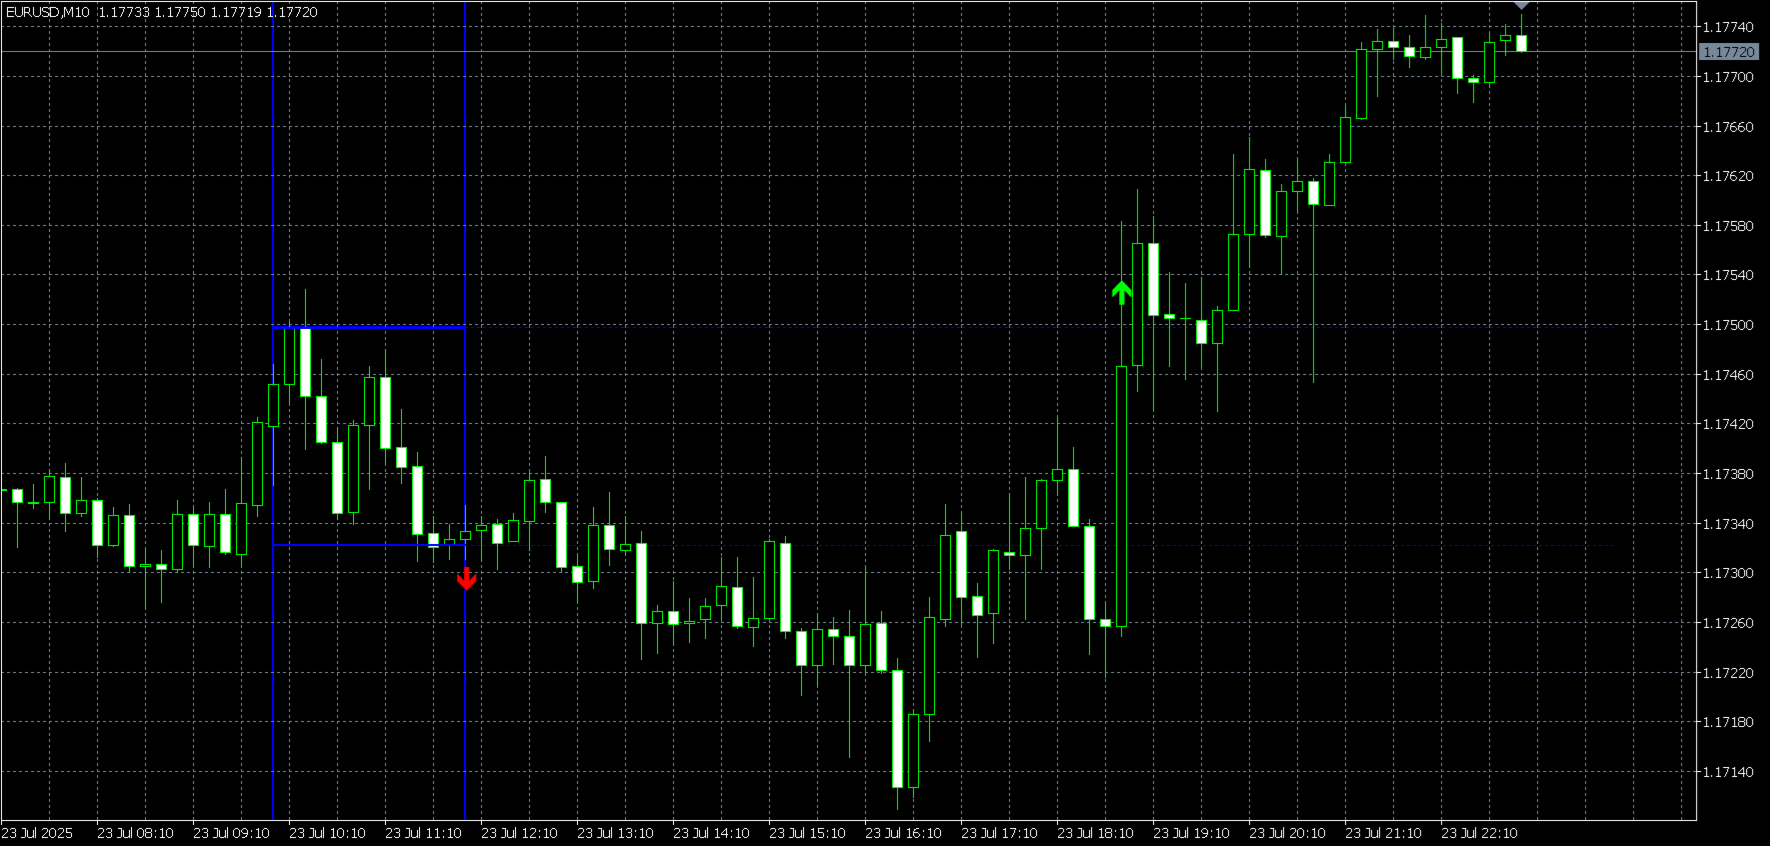
- 인기 상품 구매 (녹색/라임색 화살표): 가격이 범위 최고치 위로 떨어지면 매수
- 인기 판매 (빨간색 화살표): 가격이 범위 최저치 아래로 떨어지면 매도
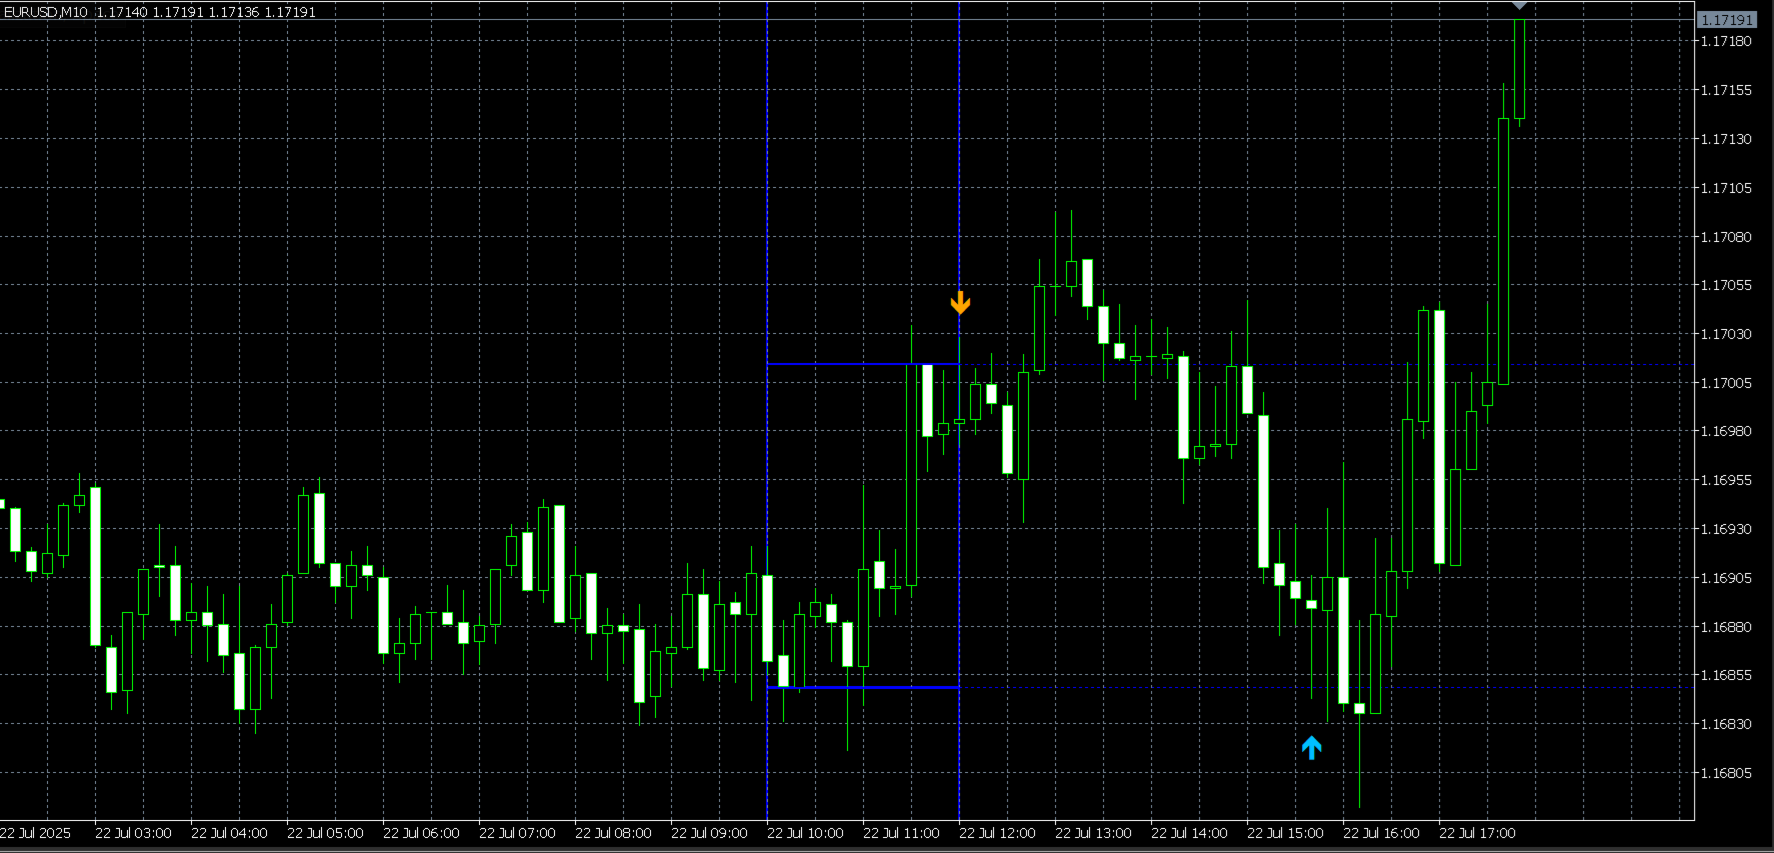
- 평균 회귀 매수 (파란색 화살표): 가격이 최저 범위 아래로 떨어질 때 매수(반등을 예상)
- 평균 회귀 매도 (주황색 화살표): 가격이 범위 고점 위로 돌파할 때 매도(후퇴 예상)
4. 브레이크아웃 모드
- HIGH_SIGNAL : 상승 돌파 시에만 신호 발생
- LOW_SIGNAL : 하향 돌파 시에만 신호 발생
- BOTH_SIGNALS : 양방향 신호(기본값)
- FIRST_SIGNAL : 범위당 첫 번째 브레이크아웃만
- SECOND_SIGNAL : 범위당 두 번째 브레이크아웃만
5. 평균 회귀 토글
- 끄다 (기본값): 표준 브레이크아웃 전략 - 높은 브레이크아웃 매수, 낮은 브레이크아웃 매도
- 켜짐 : 반전 신호 - 높은 돌파구 매도, 낮은 돌파구 매수(가격이 범위 내로 돌아올 것으로 예상)
시각적 요소:
- 파란색 실선 : 범위 기간 동안 현재 범위 최고/최저
- 파란색 점선 : 사격 기간 종료 후 확장된 사격 범위 선
- 파란색 수직선 : 범위 시작 및 종료 시간
- 녹색 수직선 : 자정 전환(NEXT_DAY 모드)
- 회색 점선 : 이전 날짜의 과거 범위
- 색상 화살표 : 가격 위/아래에 위치한 신호 표시기
경보 시스템:
- 사운드 알림 : 브레이크아웃 신호에 대한 사용자 정의 사운드
- 팝업 알림 : 화면에 시각적 알림 표시
- 이메일 알림 : 신호가 발생하면 이메일을 보냅니다.
- 푸시 알림 : 모바일 알림
보안 기능:
- 계정 승인 : 승인된 거래 계정에서만 작동합니다.
- 데모 계정 액세스 : 데모 계정에서는 항상 작동합니다.
- 전략 테스터 접속 : MT5 전략 테스터에서 항상 작동합니다.
일반적인 거래 워크플로:
- 범위 형성 : 각 거래일, 지정된 시간 창 동안 지표는 지지/저항 수준을 식별합니다.
- 범위 완료 : 범위 기간이 종료된 후 지표는 돌파를 모니터링합니다.
- 신호 생성 : 가격이 범위 위/아래로 떨어지면 추세 신호와 평균 회귀 신호가 모두 생성됩니다.
- 알림 전달 : 알림은 사운드, 팝업, 이메일 또는 모바일 푸시를 통해 전송됩니다.
- 과거 추적 : 이전 범위는 회색 참조선으로 보존됩니다.
실제 사용 사례:
- 데이 트레이딩 : 일중 돌파 기회 파악
- 세션 트레이딩 : 런던/뉴욕 세션 브레이크아웃 트레이딩
- 평균 회귀 : 가격이 범위 내로 복귀할 것으로 예상하는 거짓 돌파구가 사라짐
- 추세 추종 : 진정한 돌파구를 돌파 방향으로 추적합니다.
이 지표는 이중 신호 유형(추세 대 평균 회귀)을 통한 내장된 위험 관리를 통해 범위 돌파를 체계적으로 식별하고 거래하려는 트레이더에게 특히 유용합니다.