Crossfire Dashboard

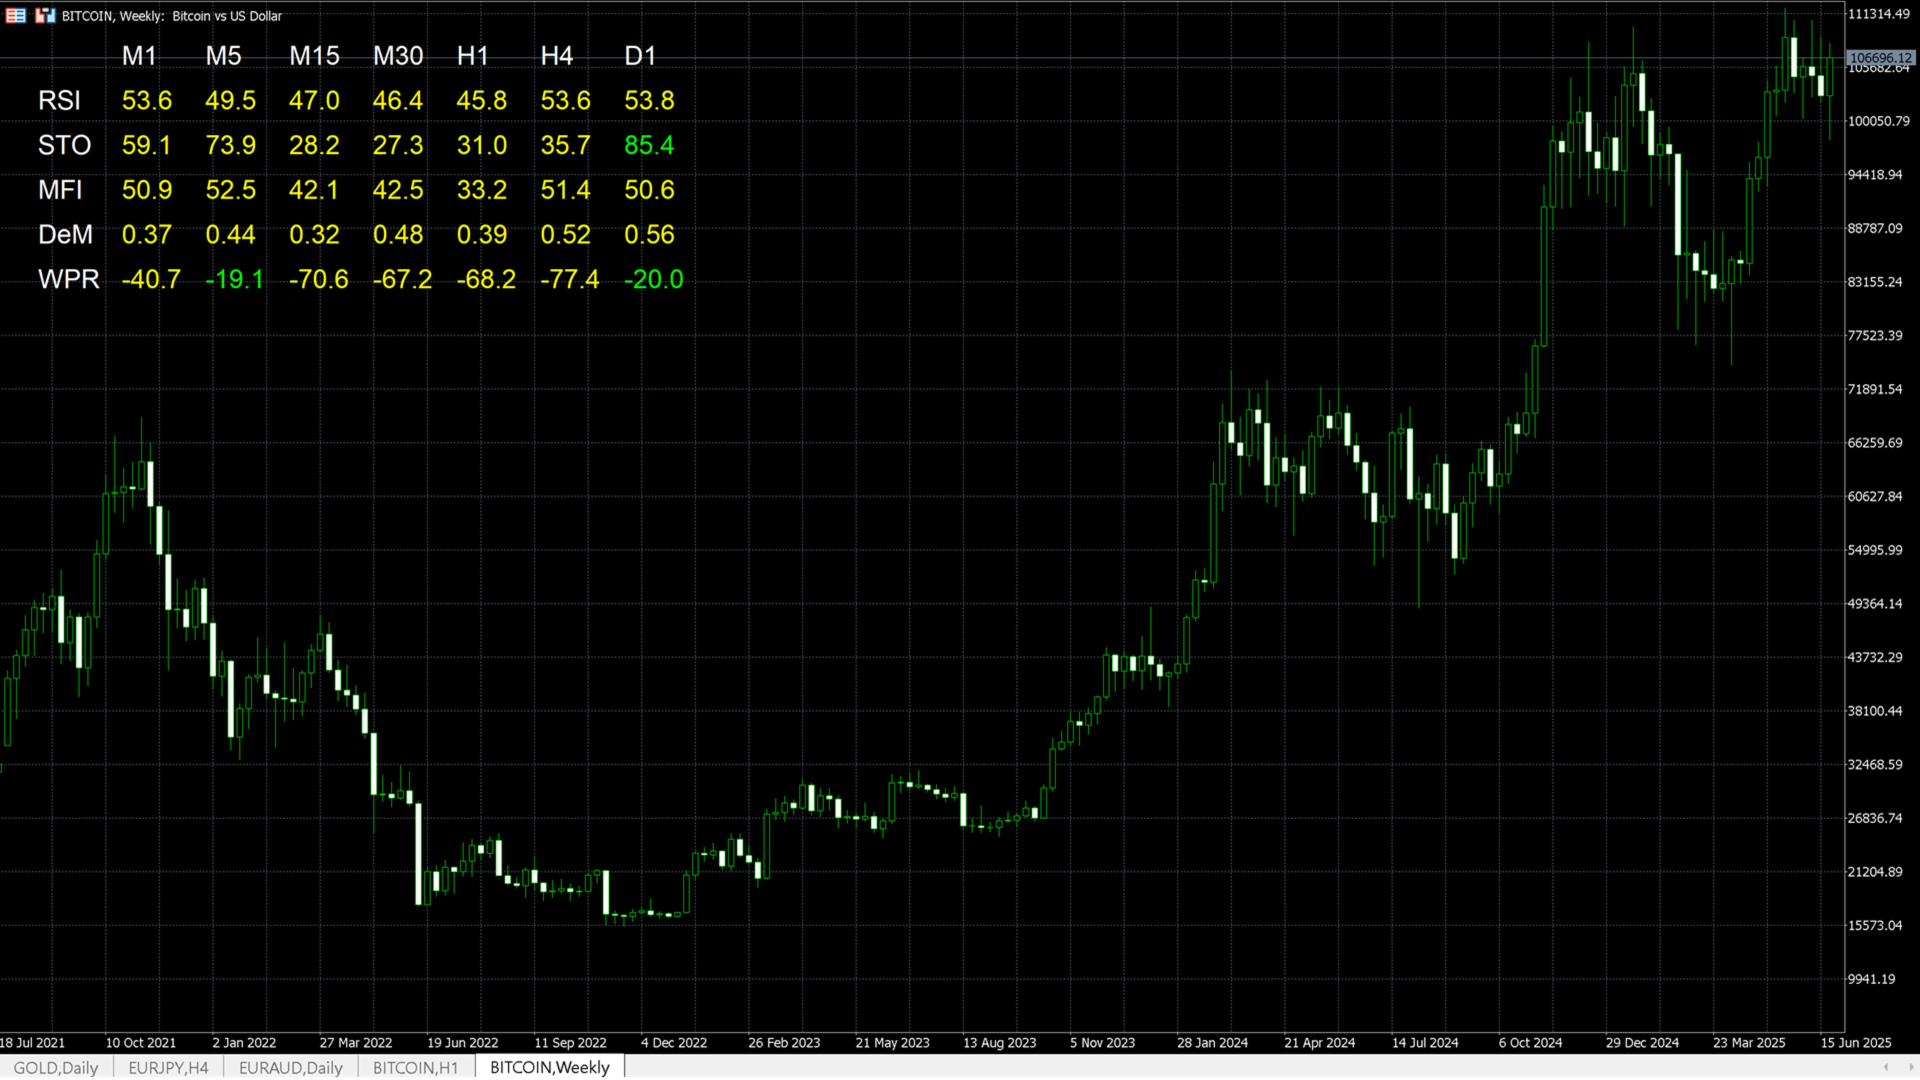
Crossfire Dashboard is an assisting visual tool that displays real-time values of selected financial instrument's key technical indicators across multiple timeframes in a single, organized table. It enables traders to quickly assess trend strength, overbought/oversold conditions, and alignment across timeframes — without switching charts or manually loading multiple indicators.

This dashboard is ideal for traders who rely on momentum, trend-following, or reversal strategies and want a clean birds-eye view of market sentiment across five bounded idnicators  Relative Strength Index (RSI), Stochastic (STO), Money Flow Index (MFI), DeMarker (DeM), and William's %R (WPR).

The indicator displays the above-mentioned five indicators' values across multiple time-frames (M1, M5, M15, M30, H1, H4, and D1).


Key Features

  • Live multi-timeframe updates for five core indicators: RSI, Stochastic, MFI, DeMarker, and WPR.

  • Scans and updates values for 7 major timeframes: M1, M5, M15, M30, H1, H4, D1.

  • Color-coded readings to highlight Overbought, Oversold, and Neutral zones.

  • Clean, customizable design that does not clutter your chart.

  • No repainting, no lag – works entirely based on current market data.


🎯 Use Cases

  • Confirm signals from your main strategy by checking multi-timeframe consensus.

  • Identify momentum exhaustion zones across multiple periods.

  • Combine with price action for pinpointing entry/exit points.


🛠️ How to Use

  1. Load the indicator on any chart, any timeframe.

  2. Adjust input parameters as desired (see explanation of inputs below).

  3. Let the dashboard refresh automatically to reflect current multi-timeframe conditions.

  4. Look for alignment of overbought/oversold zones across indicators and timeframes to spot strong confluence signals related to the attached financial instrument.


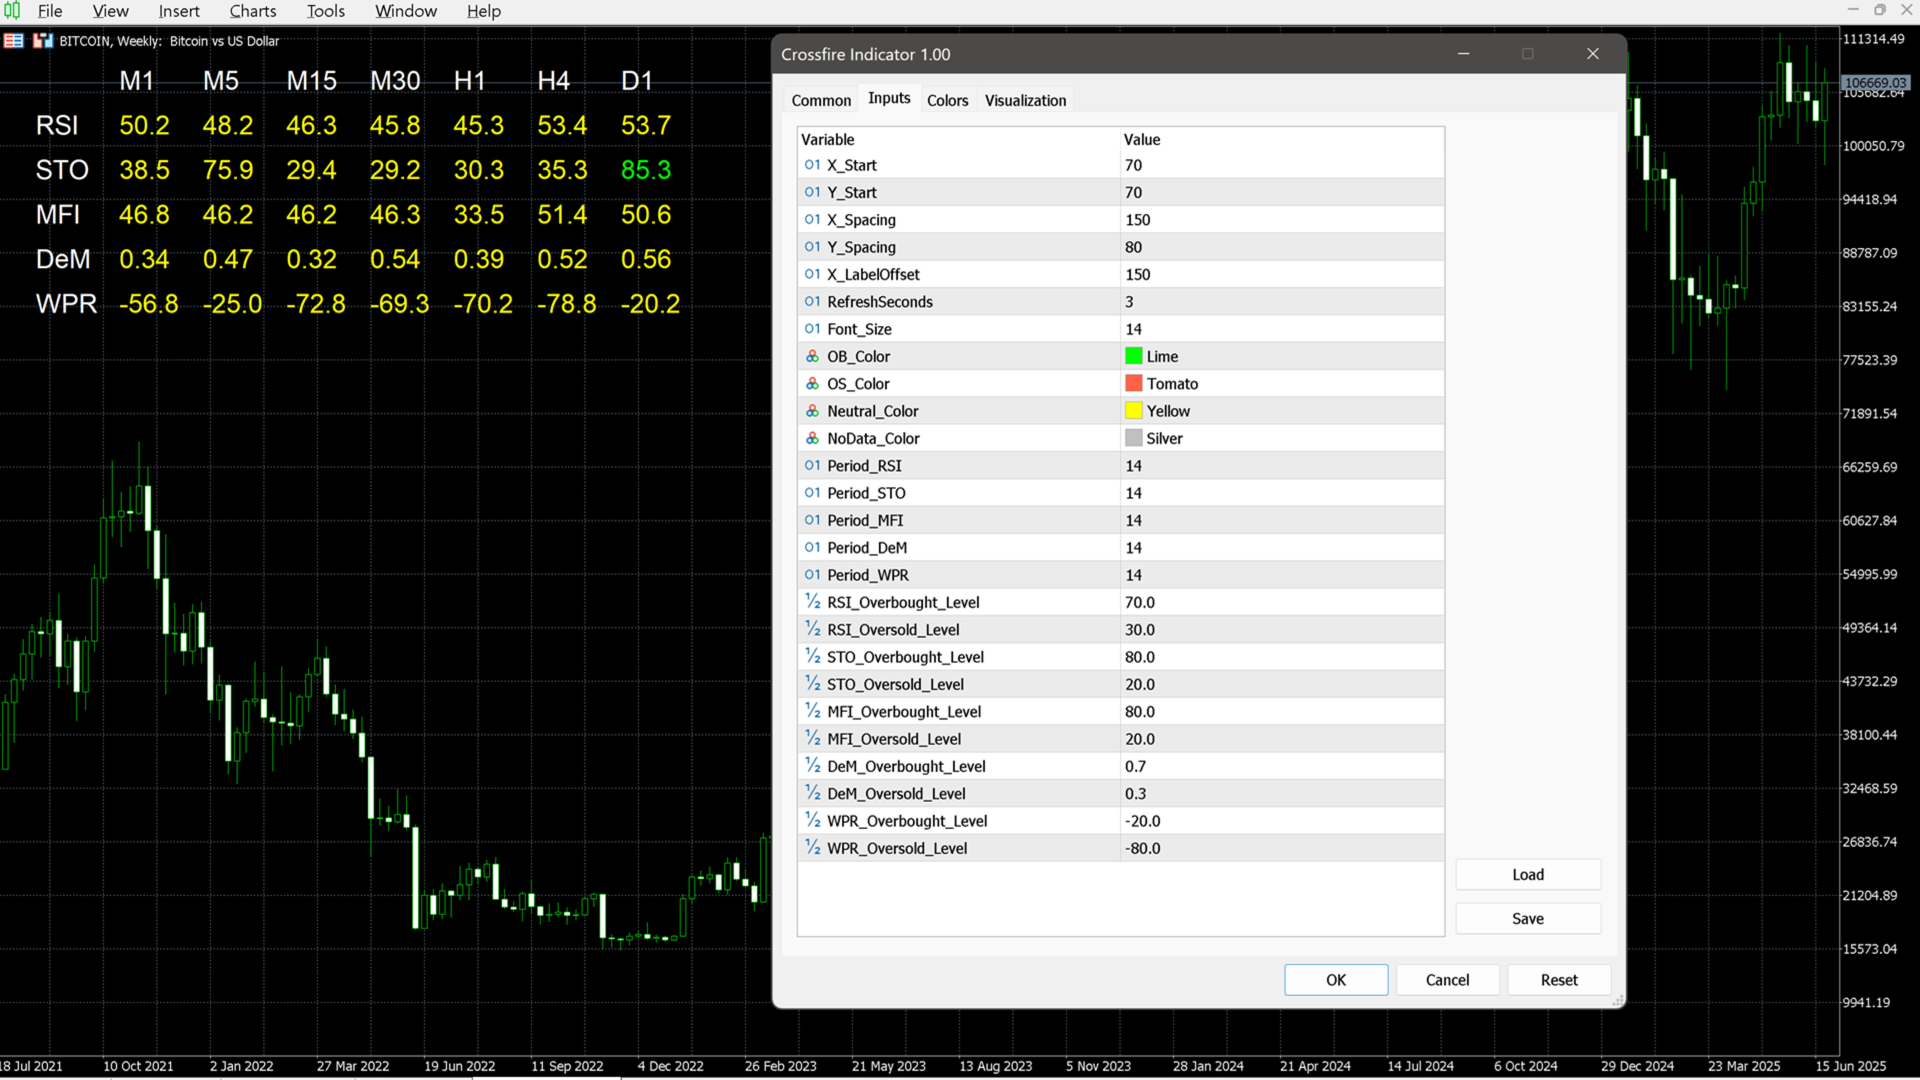
⚙️ Inputs & Customization

Below is a detailed explanation of each input parameter you can configure:

📐 Dashboard Layout

  • X_Start – Horizontal starting pixel for the dashboard placement.

  • Y_Start – Vertical starting pixel for the dashboard placement.

  • X_Spacing – Horizontal space between columns (i.e., timeframes).

  • Y_Spacing – Vertical space between indicator rows.

  • X_LabelOffset – Distance between the indicator names and the data grid.

  • Font_Size – Font size of the dashboard text.

Performance Settings

  • RefreshSeconds – Controls how often the dashboard updates (in seconds). Recommended: 5–10 seconds for real-time monitoring.

🎨 Color Settings

  • OB_Color – Color for Overbought values (default: Lime).

  • OS_Color – Color for Oversold values (default: Tomato).

  • Neutral_Color – Color for values within neutral range (default: Yellow).

  • NoData_Color – Color for timeframes when there is insufficient data (default: Silver).

📊 Indicator Periods

  • Period_RSI – Period setting for the Relative Strength Index.

  • Period_STO – %K period for Stochastic Oscillator (uses 3,3 as fixed D and Slowing).

  • Period_MFI – Period for Money Flow Index.

  • Period_DeM – Period for DeMarker.

  • Period_WPR – Period for Williams %R.

🔺 OB/OS Threshold Levels

  • RSI_Overbought_Level / RSI_Oversold_Level – Thresholds for overbought/oversold RSI.

  • STO_Overbought_Level / STO_Oversold_Level – Thresholds for Stochastic %K line.

  • MFI_Overbought_Level / MFI_Oversold_Level – Thresholds for MFI extremes.

  • DeM_Overbought_Level / DeM_Oversold_Level – Upper and lower bounds for DeMarker.

  • WPR_Overbought_Level / WPR_Oversold_Level – Levels (e.g., -20/-80) for Williams %R.


추천 제품
EPoCreW Super ORB H4 Indicator
Livhuwani Neville Ramovha
EPo-CreW Forex Super ORB-H4 지표에 오신 것을 환영합니다! 이 가이드는 시장의 첫 번째 4시간 오프닝 레인지를 기반으로 높은 확률의 거래 기회를 식별하는 이 강력한 도구의 사용 방법을 설명합니다. 초보자든 숙련된 트레이더든, 이 시스템은 보다 자신감 있고 일관된 트레이딩을 할 수 있도록 도와줍니다. 이 제품은 데모 제품이며, 설치일로부터 30일 후에 만료됩니다. 전체 버전은 여기서 확인: https://www.mql5.com/en/market/product/160926?source=Site OR https://t.me/Fundamental_fx 거래: 모든 통화, 금(GOLD) 및 BTCUSD NB: M5 타임프레임으로 전환했는지 확인하세요. 이 인디케이터를 사용하는 데 최적의 타임프레임입니다 트레이딩 전략 전략 1: 브레이크아웃 & 되돌림 (메인 전략) SELL(매도) 설정: 가격이 파란색 라인을 상향 돌파한다 (고점 돌파) 금색 BREAKOUT 화살표가 나
FREE
Show Pips for MT5
Roman Podpora
4.55 (29)
이 정보 표시기는 계정의 현재 상황을 항상 알고 싶어하는 사람들에게 유용합니다. VERSION MT 4 -   More useful indicators 표시기는 포인트, 백분율, 통화 단위의 이익뿐만 아니라 현재 쌍의 스프레드와 현재 기간에서 막대가 마감될 때까지의 시간과 같은 데이터를 표시합니다. 차트에 정보선을 배치하는 데는 여러 가지 옵션이 있습니다. 가격 오른쪽(가격보다 뒤에 있음) 코멘트(차트의 왼쪽 상단) 화면의 선택된 모서리에 있습니다. 정보 구분 기호를 선택할 수도 있습니다. | / \ # 이 표시기는 사용하기 쉽고 매우 유익합니다. 설정에서 불필요한 정보 항목을 비활성화할 수 있습니다. 설정 외모의 종류       - 정보 라인 표시 유형. 세 가지 옵션이 있습니다: 가격을 따르세요       - 가격을 따르세요. 댓글로       - 코멘트로; 화면의 선택된 모서리에서       - 화면의 선택한 모서리에 있습니다. 첨부용 그래프 코너       - 화면의 선택한
FREE
CosmiCLab FIBO
Kirils Subins
CosmiCLab SMC FIBO CosmiCLab SMC FIBO is a professional trading indicator designed for traders who use Smart Money Concepts (SMC), market structure analysis and Fibonacci retracement levels. The indicator automatically detects market swings and builds Fibonacci levels based on the latest impulse movement. It also identifies market structure changes such as BOS (Break of Structure) and CHOCH (Change of Character), helping traders understand the current market direction. CosmiCLab SMC FIBO also pr
Double Correlation indicator (free) plots two windowed correlations in a separate window.  the size of window is taken as input before the two symbols to correlate to. Two symbols are taken as an input parameters as well as period length. and the two correlations are computed with the currently shown symbol ex: input GBPJPY and AUDNZD.  current symbol EURUSD then the following will be computed corr(EURUSD,GBPJPY) and corr(EURUSD,AUDNZD) The indicator can be useful to run a multi-symbol pair trad
FREE
Donchian Breakout And Rsi
Mattia Impicciatore
4.5 (2)
개요 이 지표는 클래식 돈치안 채널(Donchian Channel) 의 향상된 버전으로, 실전 트레이딩을 위한 다양한 기능이 추가되었습니다. 표준 세 개의 선(상단, 하단, 중앙선) 외에도 브레이크아웃 을 감지하여 차트에 화살표로 시각적으로 표시하며, 차트를 깔끔하게 보기 위해 현재 추세 방향의 반대 라인만 표시 합니다. 지표 기능: 시각적 신호 : 브레이크아웃 시 컬러 화살표 표시 자동 알림 : 팝업, 푸시 알림, 이메일 RSI 필터 : 시장의 상대 강도를 기반으로 신호 검증 사용자 맞춤 설정 : 색상, 선 두께, 화살표 코드, RSI 임계값 등 동작 원리 돈치안 채널은 다음을 계산합니다: 상단선 : 최근 N개의 종가 완료 캔들에서 가장 높은 고가 하단선 : 최근 N개의 종가 완료 캔들에서 가장 낮은 저가 중앙선 : 고가와 저가의 평균값 상방 브레이크아웃 은 종가가 상단선을 돌파할 때 발생하며, 하방 브레이크아웃 은 종가가 하단선 아래로 내려갈 때 발생합니다. 이 지표는: 세 개의
FREE
Spread Monitor Pro
Simon Draxler
5 (1)
DRX SPREAD MONITOR 는 브로커의 스프레드를 실시간으로 시각화하고 분석하기 위해 설계된 전문 유틸리티입니다. 뉴스 이벤트, 롤오버 또는 유동성이 낮은 세션 동안 스프레드 확대로 인한 숨겨진 비용을 식별하는 데 도움을 줍니다. 이 도구는 실행 품질을 보장하고 거래 비용이 통계적으로 너무 높을 때 진입을 피해야 하는 스캘퍼(Scalpers)와 골드 트레이더에게 필수적입니다. 주요 기능 실시간 히스토그램: 별도의 창에 스프레드 기록을 표시하며 정상, 높음, 극단적 수준을 색상으로 구분합니다. 동적 이동 평균(MA): 평균 스프레드 추세를 계산하여 일시적인 급등과 구조적인 스프레드 증가를 구별할 수 있게 합니다. 시각적 "이퀄라이저" 모드: 차트를 복잡하게 하지 않으면서 시장 유동성 상태에 대한 즉각적인 피드백을 제공하는 독특한 막대 차트 시각화입니다. 라이브 데이터 패널: 차트상의 컴팩트한 대시보드로 다음을 표시합니다: 현재 스프레드 평균 스프레드 (시간 기준) 최소/최대 기
FREE
Currency Strength Monitor is a professional multi-currency strength indicator for MetaTrader 5 that analyzes and displays the relative strength of 8 major currencies (USD, EUR, GBP, AUD, NZD, JPY, CHF, CAD) in real-time. The indicator calculates strength values by aggregating price movements across 28 currency pairs and normalizing them using ATR, providing traders with a clear visual representation of which currencies are strengthening or weakening. Key Features: Multi-Currency Analysis — Monit
CCI Fixed Dual
Edoardo Centorame
CCI FIXED DUAL이란 무엇인가 CCI FIXED DUAL은 전문적인 Trend Direction Filter로서, 다음 요소를 정확하게 식별하도록 설계되었습니다. 시장의 지배적인 방향 움직임의 구조적 품질 주요 추세와 가속 구간 사이의 일관성 이것은 직접적인 진입 지표가 아닙니다. 이것은 전통적인 오실레이터가 아닙니다. 이것은 컨텍스트 도구로서, 트레이더가 언제 거래해야 하고 언제 거래하지 말아야 하는지를 결정하도록 돕기 위해 설계되었으며, 시장의 노이즈와 해석 오류를 크게 줄여줍니다. CCI FIXED DUAL의 기본 철학 CCI FIXED DUAL이 기반으로 하는 원칙은 단순하지만 강력합니다. 신호는 시장 구조와 일치할 때만 가치가 있습니다. 이러한 이유로 이 지표는 단일 값을 사용하지 않습니다 가격에 충동적으로 반응하지 않습니다 억지 반전 지점을 찾지 않습니다 대신 다음 요소를 기반으로 계층적인 추세 해석을 구축합니다. Typical Price 기반 CCI 서로 다른
Trading Sessions by Mahefa R is an indicator for MetaTrader 5 that visually identifies the four main trading sessions: New York, London, Tokyo, and Sydney . Designed to provide a clean, intuitive, and professional market view, it highlights the most active periods of the Forex market using smart visualization of session ranges , session-specific candle colors , and daily separators . Main Features: Automatic detection of the 4 major sessions New York London Tokyo Sydney Each session is fully c
FREE
LT Rainbow Trend
Thiago Duarte
5 (1)
Do you, like me, like to trade with the trend? Then this indicator will help you! Rainbow Trend is a trend indicator, which uses several Moving Averages on the chart. It measures different trend strenght zones for different periods: very long term, long term, mid term, short term and very short term. Each zone has its color, and it is possible to have sound alert when the prices leaves a zone and enters another. Its configuration is very simple. If you find any bug or have any suggestions, conta
Dsc Oscillator
Diogo Sawitzki Cansi
Recomended broker: https://tinyurl.com/5ftaha7c Indicator used to monitor price fluctuations in the market and discover possible reversals through reversal points or divergences in the indicator. All assets and all timeframes.   SEE OUR RESULTS ON INSTAGRAM:  https://www.instagram.com/diogo.cansi/   TELEGRAM GROUP =  https://t.me/robosdsc More information by email dscinvestimentos@gmail.com or by Whatsapp 55-991372299
FREE
Price Magnet — Price Density and Attraction Levels Indicator Price Magnet is a professional analytical tool designed to identify key support and resistance levels based on statistical Price Density. The indicator analyzes a specified historical period and detects price levels where the market spent the most time. These zones act as “magnets,” attracting price action or forming a structural base for potential reversals. Unlike traditional Volume Profile tools, Price Magnet focuses on price-time d
Japanese Candlestick Indicator
Alexander Denisovich Jegorov
Simple Japanese candlestick indicator Contains 3 patterns: - bearish engulfing - bullish engulfing - doji Only contains these 3 because after rigorous testing and trading (data) these seem to be the most efficient. Also contains: - alerts if enabled  When japanese candlestick is detected it is colored with relevant color depending on bias, and also shows label next to it. Labels: - BEG = Bearish engulfing - BE = Bullish engulfing - DO = Doji
Stamina HUD
Michele Todesco
STAMINA HUD – Advanced Market & Trend Dashboard (MT5) STAMINA HUD   is a professional   market information panel   designed for traders who want   clarity, speed, and control   directly on the chart. It provides a   clean heads-up display (HUD)   with essential market data and   multi-timeframe trend direction , without cluttering the chart or generating trading signals. What STAMINA HUD Shows   Current Price   Spread (in real pips)   Today High–Low range (pips)   Average D
FREE
FX Market Correlation
Igor Pokorni
5 (2)
FX Market Correlation indicator calculates the weakness/strength from all 28 currency pairs in the market. This is unique and powerful way of watching the market. It works on all timeframes. You can use it for scalping, or you can use it for long term trading. FX Market Correlation indicator is NOT repainting. Features: --------- -easy determine which currency is strengthening and which is weakening -choose best currency pairs to trade and times to trade them -find correlation between pairs -NO
Follow The Line MT5
Oliver Gideon Amofa Appiah
4.6 (35)
This indicator obeys the popular maxim that: "THE TREND IS YOUR FRIEND" It paints a GREEN line for BUY and also paints a RED line for SELL. (you can change the colors). It gives alarms and alerts of all kinds. IT DOES NOT REPAINT and can be used for all currency pairs and timeframes. Yes, as easy and simple as that. Even a newbie can use it to make great and reliable trades. NB: For best results, get my other premium indicators for more powerful and reliable signals. Get them here: https://www.m
FREE
Automatic Trendlines
Pasi Hakamaki
4.68 (50)
The indicator draws trendlines on chart. This indicator has six inputs. User can specify alternative labels for both lines. If multiple instances of the indicator are used, the labels must differ. User can set width and color of the lines and depth which specifies what significant peaks should be used. For example, Depth=10 sets trendlines using the current peaks and valleys that have at least 10 bars to the right and to the left and that have highs/lows less/greater than the peak's high/low. In
FREE
TrendView Ultimate — A Complete Trading System for Trend Clarity, Profit Insight, and Strategic Entries TrendView Ultimate is a professional trading system designed to help traders identify trend direction, high-quality entries, and potential exits with clarity, confidence, and measurable performance. More than just a trend indicator, it offers non-repainting signals, dynamic visual feedback, and a powerful statistics panel with real-time analytics, allowing traders to test, adapt, and valida
Gold Venamax MT5
Sergei Linskii
3.5 (2)
Gold Venamax - 이것은 최고의 주식 기술 지표입니다. 지표 알고리즘은 자산의 가격 변동을 분석하고 변동성과 잠재적 진입 영역을 반영합니다. 표시기 기능: 이것은 편안하고 수익성 있는 거래를 위한 매직과 두 개의 추세 화살표 블록을 갖춘 슈퍼 지표입니다. 블록 전환을 위한 빨간색 버튼이 차트에 표시됩니다. 매직은 표시기 설정에서 설정되므로 서로 다른 블록을 표시하는 두 개의 차트에 표시기를 설치할 수 있습니다. Gold Venamax는 서로 다른 화살표 버퍼(GV 및 SD)를 사용하여 두 개의 차트에 배치할 수 있습니다. 이렇게 하려면 설정에서 다른 Magic을 선택해야 합니다. 예를 들어 하나는 Magic = 999이고 다른 하나는 Magic = 666입니다. 다음으로 차트의 빨간색 버튼으로 화살표 버퍼를 선택할 수 있습니다. 지표 설정의 각 화살표 버퍼(GV 및 SD)에는 편안하고 수익성 있는 거래를 위한 별도의 화살표 필터가 있습니다(UseFiltrGV = true;
Pin Bars MT5
Yury Emeliyanov
Main purpose:   "Pin Bars"   is designed to automatically detect pin bars on financial market charts. A pin bar is a candle with a characteristic body and a long tail, which can signal a trend reversal or correction. How it works:   The indicator analyzes each candle on the chart, determining the size of the body, tail and nose of the candle. When a pin bar corresponding to predefined parameters is detected, the indicator marks it on the chart with an up or down arrow, depending on the directi
FREE
This   ForexTrading Sessions   indicator is a powerful visual tool for MetaTrader 5 that highlights the three major forex trading sessions (Asian, London, and New York) on your chart  with the Asian Mid-line. 1. Trading Session Visualization Asian Session : 00:00 - 09:00 GMT (blue/aqua color) London Session : 08:00 - 17:00 GMT (magenta color) New York Session : 13:00 - 22:00 GMT (orange color) 2. Time Zone Adaptation TimeZoneShift   input allows you to adjust sessions to your local time Example:
FREE
️ FWS Currency Strength - 8-Currency Multi-Timeframe Meter See which currency is strongest - and which pair to trade right now. Currency Strength ranks all 8 G8 currencies (USD, EUR, GBP, JPY, AUD, CAD, NZD, CHF) from strongest to weakest using true cross-pair averaging across 5 timeframes (M5/M15/H1/H4/D1). It then auto-suggests the best pair to trade - the strongest currency vs the weakest. Compact on-chart panel plus a stunning browser dashboard. Part of the Forex Weather Station suite.
DC Indicator
Lamont Simone Reynecke
The donchian channel indicator might just be the best fit for you Trading in derivative products such as futures, options, CFD's, forex and certificates contains significant risk. These products are not suitable for every investor. Investors could potentially lose all or more than the original investment. If anything, only money equal to personal risk capital should be used and can be lost without jeopardizing financial security or lifestyle. Partially or fully automated trading programs can
FREE
BW Indicators
Sergei Gurov
A tool for creating Bill Williams indicators Our tool provides the ability to set Bill Williams indicators on a chart with a mouse click. - The Awesome Oscillator (AO) indicator helps to assess the driving force of the trend. - Alligator indicator — determines the current state of the trend and possible entry and exit points. - Fractals indicator — helps to identify significant levels  - Accelerator Oscillator (AC) indicator — shows the change in trend acceleration. - Market Facilitation Index
FREE
Indicator measures strength of each currency in your list. Main idea: It simply iterates through all combinations of pairs and adds difference between open and close in percent. Parameters: List of currencies - what currencies will be calculated (maximum is 8) Calculation type - from which data will be strength calculated Calculation data input - used as input related to calculation type Symbol suffix - used in case of suffix on symbols, e.g: when your symbols look like EURUSDm, EURUSDmicro etc
FREE
Candle Body Power — Real-Time Candle Body Strength Classifier | Juravvlik Trading Tools | CVET System Candle Body Power is a price action quality indicator that measures the body-to-range ratio of each candle and classifies its strength into three power levels in real time. Instead of just showing direction, it reveals how clean and dominant the current candle movement really is — giving you an instant read on candle body strength before the bar closes. CLASSIFICATION — THREE POWER LEVELS The
FREE
Trade Performance Information
Andres Mauricio Serrano Quintero
This indicator will help you track performance of your trades, even scalping trades.  You can use it with the Arab, and many other traders.  This indicator displays essential trading account information directly on your chart. It positions itself in one of the four corners of the screen and showcases details such as: Symbol: The symbol of the asset currently displayed on the chart. Profit/Loss: The total profit or loss in dollars for the current symbol. Pips: The total number of pips gained or
FREE
FVGs + Alerts는 MetaTrader 5 전용으로 설계된 공정가치 갭(Fair Value Gap, FVG) 탐지 및 시각화 도구입니다. 이 도구는 트레이더가 스마트 머니 컨셉(Smart Money Concepts, SMC) 및 ICT 트레이딩 전략에서 주요 지지/저항 또는 반응 영역으로 작용하는 가격 불균형(공정가치 갭)을 식별하고 추적하는 데 도움을 줍니다. 공정가치 갭(FVG)이란 무엇일까요? 전형적인 3캔들 공정가치 갭은 연속된 캔들 사이에 강한 불균형이 있을 때 형성됩니다. 상승형 FVG(잠재적 지지 영역): [n-2] 캔들의 고가 < [n] 캔들의 저가 하락형 FVG(잠재적 저항 영역): [n-2] 캔들의 저가 > [n] 캔들의 고가 이러한 갭은 가격이 원래 방향으로 움직이기 전에 되돌아갈 가능성이 있는 비효율적인 영역을 나타냅니다.  주요 기능 FVG(Foundation-Valid Area)를 자동으로 감지하여 차트에 색상 사각형으로 표시합니다. 상승 FVG
FREE
Day Trader WorkTime
Aurthur Musendame
4.75 (16)
The worktime indicator helps you identify the most important times to day to trade the currency pairs. It was created based on the ICT day trading free tutorials that are freely vailable on his youtube channel.  You can use this indicator together with my other indicators that i have shared freely with you like the true day, custom periods, daily month, weekly open lines - they together complement each other very well. Nuggets from this indicator: 1. Draws the asian session box showinng you the
FREE
Market Sessionsync** is a cutting-edge trading session indicator designed to enhance your trading experience by visually breaking down the market's daily rhythm. With a compact window overlaid on your chart, this indicator provides a split-second understanding of the current trading session through: Basic setup: Set Difference between your local time and your broker time , set DST(Daylight Saving Time) ON or OFF , set timescale sync you want to use (Local, Broker, CET) - A vertical time marker
FREE
이 제품의 구매자들이 또한 구매함
Neuro Poseidon MT5
Daria Rezueva
5 (13)
Neuro Poseidon is a new indicator by Daria Rezueva. It combines precise trading signals with adaptive TP/SL levels - creating best possible trades as a result! Message me and get  Neuro Poseidon Assistant  as a gift to automize your trading process! What makes it stand out? 1. Proven profitability on all assets and timeframes 2. Only confirmed BUY and SELL signals present on the chart 3. Adaptive TP & SL levels generated by the software for each trade 4. Easy to understand - suitable for al
SuperScalp Pro
Van Minh Nguyen
4.65 (26)
SuperScalp Pro – 고급 멀티 필터 스캘핑 지표 시스템 SuperScalp Pro는 클래식 Supertrend와 여러 지능형 확인 필터를 결합한 고급 스캘핑 지표로, 거래 기회를 식별하는 데 도움을 줍니다. M1부터 H4까지 다양한 시간대에서 효율적으로 작동하며, XAUUSD, BTCUSD 및 주요 Forex 통화쌍에 최적화되어 있습니다. 이 지표는 명확한 매수 및 매도 신호를 제공하며, ATR 기반으로 진입가, 손절가, 익절가를 자동 계산하여 보다 효과적인 리스크 관리를 지원합니다. Fibonacci Take Profit 기능은 중요한 가격 구간에서 더 빠르게 포지션을 청산할 수 있도록 하며, 해당 수준 도달 시 알림을 전송합니다. 기본 설정은 Fibonacci Take Profit이 활성화된 상태로 최적화되어 있으며, 보다 안정적이고 일관된 거래 경험에 중점을 둡니다. 차트에 적용하는 것만으로 즉시 사용할 수 있습니다. 고급 사용자를 위해 모든 파라미터는 자유롭게 사용
SMC Intraday Formula
Kareem Abbas
5 (12)
먼저 솔직하게 말하겠습니다. 어떤 인디케이터도 단독으로 당신을 수익성 있게 만들어주지 않습니다. 누군가 그렇게 말한다면, 그는 당신에게 꿈을 파는 것입니다. 완벽한 매수/매도 화살표를 보여주는 모든 인디케이터는 완벽하게 보이도록 만들 수 있습니다 — 단지 올바른 과거 구간을 확대하고 승리한 거래만 캡처하면 됩니다. 우리는 그렇게 하지 않습니다.  SMC Intraday Formula는 도구입니다. 시장 구조를 읽고, 가장 높은 확률의 가격 구간을 표시하며, 현재 스마트 머니의 흐름이 어떻게 보이는지 아주 단순한 언어로 보여줍니다. 최종 결정은 여전히 당신이 합니다. 실행도 당신이 합니다. 하지만 이제는 희망이 아니라 정확성으로 거래하게 됩니다. 우리는 이 인디케이터를 지난 약 3년 동안 골드(XAUUSD) 및 주요 외환 통화쌍의 데이 트레이딩 스캘핑에 사용해 왔습니다. M1, M5, M15, M30에서 우리의 핵심 도구입니다. 이 도구는 미래를 예측하려 하지 않습니다 — 지금 형성
Entry In The Zone and SMC Multi Timeframe is a real-time 2-in-1 market analysis tool that combines market structure analysis and a No Repaint BUY / SELL signal system into a single indicator, built on Smart Money Concepts (SMC) — a widely adopted framework used by professional traders to understand market structure. This indicator helps you see the market more clearly, make decisions based on structure rather than guesswork, and focus on high-probability zones where price is more likely to react
Divergence Bomber
Ihor Otkydach
4.9 (89)
이 지표를 구매하신 분께는 다음과 같은 혜택이 무료로 제공됩니다: 각 거래를 자동으로 관리하고, 손절/익절 수준을 설정하며, 전략 규칙에 따라 거래를 종료하는 전용 도우미 툴 "Bomber Utility" 다양한 자산에 맞게 지표를 설정할 수 있는 셋업 파일(Set Files) "최소 위험", "균형 잡힌 위험", "관망 전략" 모드로 설정 가능한 Bomber Utility의 셋업 파일 이 전략을 빠르게 설치, 설정, 시작할 수 있도록 돕는 단계별 영상 매뉴얼 주의: 위의 모든 보너스를 받기 위해서는 MQL5 개인 메시지 시스템을 통해 판매자에게 연락해 주세요. 독창적인 커스텀 지표인 “Divergence Bomber(다이버전스 봄버)”를 소개합니다. 이 지표는 MACD 다이버전스(괴리) 전략을 기반으로 한 올인원(All-in-One) 거래 시스템입니다. 이 기술 지표의 주요 목적은 가격과 MACD 지표 간의 다이버전스를 감지하고, **향후 가격이 어느 방향으로 움직일지를 알려주는
ScalpPoint
Temirlan Kdyrkhan
ScalpPoint is a powerful trading companion designed to generate high-probability entry signals with dynamic TP/SL/DP levels based on volatility. Built-in performance tracking shows win/loss stats, PP1/PP2 hits, and success rates — all updated live. Key Features: Buy/Sell signals with adaptive volatility bands Real-time TP/SL/DP levels based on ATR Built-in MA Filter with optional ATR/StdDev volatility Performance stats panel (Success, Profit/Loss, PP1/PP2) Alerts via popup, sound, push, or emai
SmartScalping
Temirlan Kdyrkhan
SmartScalping is a powerful trading companion designed to generate high-probability entry signals with dynamic TP/SL/DP levels based on volatility. Built-in performance tracking shows win/loss stats, PP1/PP2 hits, and success rates — all updated live. Key Features: Buy/Sell signals with adaptive volatility bands Real-time TP/SL/DP levels based on ATR Built-in MA Filter with optional ATR/StdDev volatility Performance stats panel (Success, Profit/Loss, PP1/PP2) Alerts via popup, sound, push, or e
Power Candles MT5
Daniel Stein
5 (8)
Power Candles V3 - 자체 최적화 강도 지표 파워 캔들 V3는 적용된 모든 차트에서 통화 및 상품의 강세를 실행 가능한 거래 계획으로 전환합니다. 단순히 캔들에 색상을 입히는 대신, 백그라운드에서 실시간 자동 최적화를 수행하여 현재 보고 있는 종목에 대한 최적의 손절매, 익절 및 신호 임계값을 제공합니다. 한 번의 클릭으로 실시간 거래에 적용할 수 있으며, 진입점, 손절매 및 익절 선이 정확한 가격에 맞춰 차트에 표시되고, 방향과 함께 알림이 발령됩니다. 이 도구는 Stein Investments 에코시스템의 일부입니다. 18개 이상의 도구와 함께 당신의 1대1 AI 트레이딩 멘토 Max.  항상 대기 중, 모든 인디케이터를 깊이 있게 이해, 무언가를 차근차근 생각해보고 싶은 순간에 도움을 줍니다.  https://stein.investments 에서 만나보세요 매 종가 바마다 3,000회 이상의 트레이딩 시뮬레이션. 9가지 강도 상태. 2가지 전략을 병렬로 테스트.
소개       Quantum Breakout PRO   , 브레이크아웃 존 거래 방식을 변화시키는 획기적인 MQL5 지표! 13년 이상의 거래 경험을 가진 숙련된 트레이더 팀이 개발한       퀀텀 브레이크아웃 PRO       혁신적이고 역동적인 브레이크아웃 존 전략으로 거래 여정을 새로운 차원으로 끌어올리도록 설계되었습니다. Quantum Breakout Indicator는 5개의 이익 목표 영역이 있는 브레이크아웃 영역의 신호 화살표와 브레이크아웃 상자를 기반으로 한 손절 제안을 제공합니다. 초보자 거래자와 전문 거래자 모두에게 적합합니다. Quantum EA 채널:       여기를 클릭하세요 중요한! 구매 후 설치 매뉴얼을 받으려면 개인 메시지를 보내주십시오. 추천: 기간: M15 통화쌍: GBPJPY, EURJPY, USDJPY,NZDUSD, XAUUSD 계정 유형: 스프레드가 매우 낮은 ECN, Raw 또는 Razor 브로커 시간: GMT +3 중개인 :
SignalTech MT5
Yue Wang
5 (26)
SignalTech MT5 is an unique fully rule based trading system for EURUSD, USDCHF, USDJPY, AUDUSD, NZDUSD, EURJPY, AUDJPY, NZDJPY, CADJPY.  All the winning trades with chart setups are published on the comments page. 2026-05 4107 Pips (Until 05-29 NY Closed) 2026-04 2243 Pips 2026-03 2165 Pips 2026-02 2937 Pips 2026-01 2624 Pips 2025-12 1174 Pips It can generate signals with Buy/Sell Arrows and Pop-Up/Sound Alerts. Each signal has clear Entry and Stop Loss levels, which should be automatically flag
TrendProMaster
Temirlan Kdyrkhan
MasterTrend Indicator for MT5 A powerful trend-following and signal-evaluation tool MasterTrend   is a custom MT5 indicator that combines Moving Averages and ATR-based risk/reward logic to generate clear buy/sell signals. It visualizes dynamic SL/TP levels, evaluates past trade outcomes, and displays win/loss statistics in a clean on-chart panel. Key features include: Buy/Sell signals based on MA crossovers ATR-based SL/TP1/TP2/TP3 levels with visual lines and labels Signal outcome tracking wit
MasterTrend
Temirlan Kdyrkhan
MasterTrend Indicator for MT5 A powerful trend-following and signal-evaluation tool MasterTrend   is a custom MT5 indicator that combines Moving Averages and ATR-based risk/reward logic to generate clear buy/sell signals. It visualizes dynamic SL/TP levels, evaluates past trade outcomes, and displays win/loss statistics in a clean on-chart panel. Key features include: Buy/Sell signals based on MA crossovers ATR-based SL/TP1/TP2/TP3 levels with visual lines and labels Signal outcome tracking wit
Azimuth Pro
Ottaviano De Cicco
5 (7)
Azimuth Pro V2: Synthetic Fractal Structure and Confirmed Entries for MT5 Overview Azimuth Pro is a multi-level swing structure indicator by Merkava Labs . Four nested swing layers, swing-anchored VWAP, ABC pattern detection, three-timeframe structural filtering, and closed-bar confirmed entries — one chart, one workflow from micro-swings to macro-cycles. This is not a blind signal product. It is a structure-first workflow for traders who care about location, context, and timing. V2 Launch Offe
Quantum TrendPulse
Bogdan Ion Puscasu
5 (25)
SuperTrend   ,   RSI   ,   Stochastic   의 힘을 하나의 포괄적인 지표로 결합하여 트레이딩 잠재력을 극대화하는 궁극의 트레이딩 도구   인 Quantum TrendPulse를   소개합니다. 정밀성과 효율성을 추구하는 트레이더를 위해 설계된 이 지표는 시장 추세, 모멘텀 변화, 최적의 진입 및 종료 지점을 자신 있게 식별하는 데 도움이 됩니다. 주요 특징: SuperTrend 통합:   주요 시장 추세를 쉽게 따라가고 수익성의 물결을 타세요. RSI 정밀도:   매수 과다 및 매도 과다 수준을 감지하여 시장 반전 시점을 파악하는 데 적합하며 SuperTrend 필터로 사용 가능 확률적 정확도:   변동성이 큰 시장에서 숨겨진 기회를 찾기 위해 확률적 진동   을 활용하고 SuperTrend의 필터로 사용 다중 시간대 분석:   M5부터 H1 또는 H4까지 다양한 시간대에 걸쳐 시장을 최신 상태로 유지하세요. 맞춤형 알림:   맞춤형 거래 조건이 충족되면
이 제품은 2026년 시장에 맞게 업데이트되었으며 최신 MT5 빌드에 최적화되었습니다. 가격 업데이트 안내: Smart Trend Trading System은 현재 $99 에 제공됩니다. 다음 30회 구매 후 가격은 $199 로 인상됩니다. 특별 혜택: Smart Trend Trading System 구매 후 저에게 개인 메시지를 보내시면 Smart Universal EA를 무료 로 받을 수 있으며, Smart Trend 신호를 자동 거래로 전환할 수 있습니다. Smart Trend Trading System은 리페인트 없음, 재그리기 없음, 지연 없음의 완전한 트레이딩 시스템으로, 더 깨끗한 신호, 더 나은 추세 방향, 그리고 더 체계적인 시장 거래 방식을 원하는 트레이더를 위해 제작되었습니다. Online course , manual and download presets . 이 시스템은 추세 감지, 반전 구간, Smart Cloud, 트레일링 스톱 로직, 지지와 저항, 캔들 색
FX Trend MT5 NG
Daniel Stein
5 (6)
FX Trend NG: 차세대 멀티 마켓 트렌드 인텔리전스 개요 FX Trend NG 는 다중 시간 프레임 기반의 전문 트렌드 분석 및 시장 모니터링 도구입니다. 몇 초 만에 전체 시장 구조를 파악할 수 있도록 설계되었습니다. 여러 차트를 일일이 전환할 필요 없이, 어떤 종목이 추세에 있는지, 어디에서 모멘텀이 약화되고 있는지, 그리고 어떤 시간 프레임이 서로 정렬되어 있는지 즉시 확인할 수 있습니다. 출시 기념 특별 혜택 – FX Trend NG 를 $30 (6개월) 또는 $80 평생 라이선스 로 이용할 수 있습니다. 이미 Stein Investments 고객이신가요? -> 메시지를 보내 전용 고객 그룹에 참여하세요. 설정이나 사용 방법이 필요하신가요? -> Stein Investments 공식 페이지 를 방문하세요. 1. FX Trend NG가 특별한 이유 3단계 추세 로직 – 단순한 Buy / Sell이 아닙니다 • 대부분의 지표는 Buy 또는 Sell 두 가지 상태만 제
Gann Made Easy MT5
Oleg Rodin
5 (4)
Gann Made Easy 는 mr.의 이론을 사용하여 최고의 거래 원칙을 기반으로 하는 전문적이고 사용하기 쉬운 Forex 거래 시스템입니다. W.D. 간. 이 표시기는 Stop Loss 및 Take Profit Levels를 포함하여 정확한 BUY 및 SELL 신호를 제공합니다. PUSH 알림을 사용하여 이동 중에도 거래할 수 있습니다. 구매 후 거래 방법 안내 및 유용한 추가 지표를 무료로 받으시려면 저에게 연락주세요! 아마도 Gann 거래 방법에 대해 이미 여러 번 들었을 것입니다. 일반적으로 Gann의 이론은 초보자 거래자뿐만 아니라 이미 거래 경험이 있는 사람들에게도 매우 복잡한 것입니다. Gann의 거래 방식은 이론적으로 적용하기 쉽지 않기 때문입니다. 나는 그 지식을 연마하고 Forex 지표에 최고의 원칙을 적용하기 위해 몇 년을 보냈습니다. 표시기는 적용하기가 매우 쉽습니다. 차트에 첨부하고 간단한 거래 권장 사항을 따르기만 하면 됩니다. 지표는 지속적으로 시장 분석
ARIPoint
Temirlan Kdyrkhan
1 (1)
ARIPoint is a powerful trading companion designed to generate high-probability entry signals with dynamic TP/SL/DP levels based on volatility. Built-in performance tracking shows win/loss stats, PP1/PP2 hits, and success rates all updated live. Key Features: Buy/Sell signals with adaptive volatility bands Real-time TP/SL/DP levels based on ATR Built-in MA Filter with optional ATR/StdDev volatility Performance stats panel (Success, Profit/Loss, PP1/PP2) Alerts via popup, sound, push, or email Cu
M30/H1/H4 스윙 버전 출시 큰 움직임을 잡고 싶으신가요? Gold Signal Swing Pro (M30/H1/H4). 목표: 거래당 $20-$80+. https://www.mql5.com/en/market/product/177643 KURAMA GOLD SIGNAL PRO (MT5) — 7층 필터 탑재 XAUUSD 완벽 트레이딩 시스템 리페인트 없음. 리드로우 없음. 지연 없음. 모든 신호는 확정 후 변하지 않습니다. 구매자 한정 혜택: 매수 라이선스 구매자에게 AI Zone Radar ($59 상당) + PDF 매뉴얼을 무료 제공합니다. 구매 후 MQL5에서 메시지를 보내주세요. AI Zone Radar: https://www.mql5.com/en/market/product/175834 실제 골드 트레이더 커뮤니티에서 사용되며, 정확도와 사용 편의성으로 높은 평가를 받고 있습니다.
Market Structure Order Block Dashboard MT5는 시장 구조와 주요 가격 반응 구역을 차트에서 직접 읽고자 하는 트레이더를 위해 설계된 MT5 지표입니다. BOS, ChoCH, 오더 블록, Fair Value Gap (FVG), 유동성, Kill Zones, Volume Profile 그리고 빠른 분석을 위한 콤팩트한 대시보드를 결합합니다. 이 지표는 시장 구조, ICT 및 Smart Money 개념을 의사결정 프레임워크로 사용하는 트레이더를 대상으로 합니다. 추세 지속, 가능한 반전, 가격 불균형, 유동성 타겟 및 관심 구역을 보다 체계적으로 식별하는 데 도움을 줄 수 있습니다. 구매자를 위한 포함 리소스 구매 후 MQL5 개인 메시지로 요청하시면 완전한 PDF 사용 설명서와 파라미터 설정 팁을 제공해 드립니다. MQL5 개인 메시지를 통한 직접 기술 지원. 1.20 버전은 두 가지 주요 추가 기능을 제공합니다: Pending BOS / Pending
Trend Catcher ind mt5
Ramil Minniakhmetov
5 (4)
트렌드 캐처 인디케이터 트렌드 캐처 인디케이터는 개발자가 자체 개발한 맞춤형 적응형 트렌드 분석 지표들을 조합하여 시장 가격 움직임을 분석합니다. 단기적인 노이즈를 제거하고 근본적인 모멘텀 강도, 변동성 확대, 가격 구조 움직임에 집중하여 진정한 시장 방향을 파악합니다. 또한 이동 평균, RSI, 변동성 필터와 같은 맞춤형 지표들을 활용하여 가격을 평활화하고 트렌드를 필터링합니다. 실제 운영 모니터링 및 기타 제품은 다음 링크에서 확인하실 수 있습니다:   https://www.mql5.com/en/users/mechanic/seller 텔레그램에서는 EA나 설정 파일을 판매하지 않습니다. 사기이니 주의하세요. 모든 설정 파일은 블로그에서 무료로 제공됩니다. 중요! 구매 후 즉시 연락 주시면 사용 방법 및 보너스를 드립니다!
Reversion King Indicator
Eugen-alexandru Zibileanu
5 (3)
새로운 왕의 등장 - 인디케이터 + 주문 관리 표시(TP1 + TP2 + TP3) + 선택형 텔레그램 시그널 전송 기능 포함 (무료) (완전한 트레이딩 및 시그널 시스템) 골드를 위한 최고의 EA: Gold Slayer 이 인디케이터는 고급 전략, 사용자 지정 가능한 주문 관리 시스템, 그리고 엔벨로프 확장을 결합한 평균 회귀(mean reversion) 시스템을 포함하고 있습니다. 또한 RSI와 같은 여러 지능형 확인 필터를 통해 높은 확률의 반전 진입 구간을 포착하여 BUY 및 SELL 시그널을 제공합니다. 단순히 거래 방법만 배우는 것이 아니라, 여러 포지션을 효과적으로 관리하고 이전에 수익 중인 오픈 포지션으로 손실 거래를 커버하는 방법까지 익힐 수 있습니다. M5 전용으로 설계 및 최적화되었으며, 유동성이 풍부해 시그널이 더 깔끔하고 신뢰도 높은 BTCUSD와 XAUUSD에서 뛰어난 성능을 발휘합니다. 이 인디케이터는 ATR 기반으로 자동 계산된 진입가, 손절가, 익절가와
Atomic Analyst MT5
Issam Kassas
4.21 (33)
이 제품은 2026년 시장에 맞게 업데이트되었으며 최신 MT5 빌드에 최적화되었습니다. 가격 업데이트 안내: Atomic Analyst는 현재 $99 에 제공됩니다. 다음 30회 구매 후 가격은 $199 로 인상됩니다. 특별 혜택: Atomic Analyst 구매 후 저에게 개인 메시지를 보내시면 Smart Universal EA를 무료 로 받을 수 있으며, Atomic Analyst 신호를 자동 거래로 전환할 수 있습니다. Atomic Analyst는 리페인트 없음, 재그리기 없음, 지연 없음의 Price Action 거래 인디케이터로, 수동 거래, 신호 명확성, EA 자동화를 위해 설계되었습니다. User manual: settings, inputs and strategy. 가격 움직임, 강도, 모멘텀, 다중 시간대 방향 및 고급 필터를 분석하여 트레이더가 노이즈를 줄이고 약한 세팅을 피하며 더 체계적인 거래 결정을 내릴 수 있도록 돕습니다. 이 인디케이터는 복잡한 시장 계산
Smart Structure Concepts MT5
Cristhian Alexander Gaibor Cuasquer
5 (1)
이것은 영역을 그리고 당신이 추측하게 만드는 또 다른 구조 지표가 아닙니다. Smart Structure Concepts는 당신을 위해 시장을 읽습니다 — XAUUSD(금), 외환, 지수, 암호화폐 및 기타 모든 시장 에서 Smart Money Concepts (SMC / ICT) 구조를 실시간으로 표시합니다. 각 영역을 설정하기 위해 입력값에 들어갈 필요 없습니다: 차트의 인터랙티브 대시보드 패널 로, 단 한 번의 클릭으로 표시, 숨기기 또는 조정을 결정할 수 있습니다 — 속성을 열거나 지표를 다시 시작할 필요 없이. 이 도구는 MetaTrader 5용 성장하는 지표 및 패널 세트의 일부입니다 — 모두 11개 언어의 교육 툴팁과 모든 차트에 내장된 시각적 멘토를 갖추고 있습니다. 각 도구는 당신이 거래하는 동안 가르칩니다: 어떤 영역, 신호 또는 레벨에 마우스를 올리면 설명이 차트에 직접 나타납니다. 블랙박스 없음, 맹목적인 주문 없음. 거래하면서 배웁니다. 전체 라인업을 여기서
Crystal Heikin Ashi Signals
Muhammad Jawad Shabir
5 (2)
Crystal Heikin Ashi Signals - Professional Trend & Signal Detection Indicator Advanced Heikin Ashi Visualization with Intelligent Signal System for Manual & Automated Trading Final Price: $149 ---------> Price goes up $10 after every 10 sales . Limited slots available — act fast . Overview Crystal Heikin Ashi Signals is a professional-grade MetaTrader 5 indicator that combines pure Heikin Ashi candle visualization with an advanced momentum-shift detection system. Designed for both manual traders
Trend Screener Pro MT5
STE S.S.COMPANY
4.85 (104)
트렌드 표시기, 트렌드 트레이딩 및 필터링을 위한 획기적인 고유 솔루션, 하나의 도구 안에 내장된 모든 중요한 트렌드 기능! Forex, 상품, 암호 화폐, 지수 및 주식과 같은 모든 기호/도구에 사용할 수 있는 100% 다시 칠하지 않는 다중 시간 프레임 및 다중 통화 표시기입니다. Trend Screener는 차트에 점이 있는 화살표 추세 신호를 제공하는 효율적인 지표 추세 추종 지표입니다. 추세 분석기 표시기에서 사용할 수 있는 기능: 1. 트렌드 스캐너. 2. 최대 이익 분석이 있는 추세선. 3. 추세 통화 강도 측정기. 4. 경고가 있는 추세 반전 점. 5. 경고가 있는 강력한 추세 점. 6. 추세 화살표 Trend Screener Indicator가 있는 일일 분석 예, 일일 신호 성능...등은 여기에서 찾을 수 있습니다. 여기를 클릭하십시오. LIMITED TIME OFFER : Trend Screener Indicator는 50$ 및 평생 동안만 사용할 수 있습니다.
Meridian Pro
Ottaviano De Cicco
5 (2)
Meridian Pro 2.00: Professional Multi-Timeframe Trend Matrix for MT5 Meridian Pro 2.00 is a professional adaptive trend matrix for MetaTrader 5. It combines the original Meridian trend engine, a clean chart ribbon, closed-bar signal arrows, an 8-timeframe dashboard, Fuel momentum, weighted consensus, synthetic HTF processing and chart-native higher-timeframe context lines. The goal is simple: read current trend, multi-timeframe structure, strength, momentum and EA-ready state from one discipline
FX Levels MT5
Daniel Stein
5 (14)
FX Levels: 모든 시장을 위한 뛰어난 정확도의 지지와 저항 간단 요약 통화쌍, 지수, 주식, 원자재 등 어떤 시장이든 믿을 만한 지지·저항 레벨을 찾고 싶나요? FX Levels 는 전통적인 “Lighthouse” 기법과 첨단 동적 접근을 결합해, 거의 보편적인 정확성을 제공합니다. 실제 브로커 경험을 반영하고, 자동화된 일별 업데이트와 실시간 업데이트를 결합함으로써 FX Levels 는 가격 반전 포인트를 파악하고, 수익 목표를 설정하며, 자신 있게 트레이드를 관리할 수 있게 돕습니다. 지금 바로 시도해 보세요—정교한 지지/저항 분석이 어떻게 여러분의 트레이딩을 한 단계 끌어올릴 수 있는지 직접 확인하세요! 1. FX Levels가 트레이더에게 매우 유용한 이유 뛰어난 정확도의 지지·저항 존 • FX Levels 는 다양한 브로커 환경에서도 거의 동일한 존을 생성하도록 설계되어, 데이터 피드나 시간 설정 차이로 인한 불일치를 해소합니다. • 즉, 어떤 브로커를 사용하
Trend Forecaster
Alexey Minkov
5 (7)
Trend Forecaster – Since 2023. The Trend Forecaster indicator utilizes a unique proprietary algorithm to determine entry points for a breakout trading strategy. The indicator identifies price clusters, analyzes price movement near levels, and provides a signal when the price breaks through a level. The Trend Forecaster indicator is suitable for all financial assets, including currencies (Forex), metals, stocks, indices, and cryptocurrencies. You can also adjust the indicator to work on any time
Btmm state engine pro
Garry James Goodchild
5 (5)
BTMM State Engine Pro is a MetaTrader 5 indicator for traders who use the Beat The Market Maker approach: Asian session context, kill zone timing, level progression, peak formation detection, and a multi-pair scanner from a single chart. It combines cycle state logic with a built-in scanner dashboard so you do not need the same tool on many charts at once. What it does Draws the Asian session range; session times can follow broker server offset or be set in inputs. Tracks level progression (L
제작자의 제품 더 보기
The   Multi-Currency Indicator Dashboard  for MT4  is an assisting tool designed to monitor up to   10 currency pairs   across   6 essential indicators   in one compact, color-coded dashboard. Ideal for traders who value efficiency, this tool eliminates the need to switch between charts or timeframes. Whether you're a scalper, swing trader, or trend follower, this dashboard gives you an instant visual overview of market conditions across your preferred symbols and indicators. Note : This indicat
Average Sentiment Indicator  for MT4 is a composite oscillator that combines the insights of   five conventional technical indicators  — Relative Strength Index ( RSI ), Stochastic ( STO ), Money Flow Index ( MFI ), DeMarker ( DeM ), and William's %R ( WPR ) — into a single line ranging from 0 to 100. It is the   arithmetic average of the five indicators   after normalization. This tool is ideal for traders who want a noise-reduced perspective of   overbought   and   oversold   zones, potential
Multi-timeframe dashboard showing the average value of five core momentum indicators across multiple currency pairs to quickly identify overbought and oversold market conditions. What the Indicator Does Calculates a single   average  value of five indicators (0–100) Uses five well-known momentum indicators Displays values across   multiple timeframes and symbols Highlights   oversold and overbought zones Provides a   BUY / SELL decision column   based on consecutive timeframe alignment Ind
Data Exporter EA is a powerful and easy-to-use Expert Advisor for MetaTrader 5 , designed to export high-precision market data and technical indicators into a structured .CSV file for backtesting, machine learning, algorithmic modeling, or statistical analysis. Whether you're a data-driven trader, quantitative analyst, or system developer, this EA provides a seamless way to collect and store historical indicator values alongside OHLC prices — with full control over timeframe, periods, and indica
The Multi-Currency Indicator Dashboard is an assisting tool designed to monitor up to 10 currency pairs across 6 essential indicators in one compact, color-coded dashboard. Ideal for traders who value efficiency, this tool eliminates the need to switch between charts or timeframes. Whether you're a scalper, swing trader, or trend follower, this dashboard gives you an instant visual overview of market conditions across your preferred symbols and indicators. Note : This indicator is not limited to
Average Sentiment Indicator  is a composite oscillator that combines the insights of five conventional technical indicators  — Relative Strength Index ( RSI ), Stochastic ( STO ), Money Flow Index ( MFI ), DeMarker ( DeM ), and William's %R ( WPR ) — into a single line ranging from 0 to 100. It is the arithmetic average of the five indicators after normalization. This tool is ideal for traders who want a noise-reduced perspective of overbought and oversold zones, potential reversals , and trend
The Bollinger Heatmap is a visual tool designed for traders who want to track Bollinger Band extremes across multiple symbols and timeframes — all in one color-coded dashboard. This indicator scans up to 10 user-defined currency pairs  (or other instruments) across 8 major timeframes ( M1 ,  M5 ,  M15 ,  M30 ,  H1 ,  H4 , D1 and W1 ) and displays how far the current price is from the Bollinger Bands’ upper or lower boundaries in pips (1 pip = 10 points) . If the price is above the upper band,
Pairwise Open Positions Tracker  is a lightweight indicator designed to give traders a clear, real-time summary of their all open positions by financial instrument. Ideal for scalpers, day traders, and portfolio managers, this tool displays important statistics including number of trades, total lots, net profit, and swap. Key Features Live Floating Profit Overview : Instantly shows P/L for each symbol with active trades. Grouped by Symbol : Summarizes positions per instrument, no matter how m
Multi-timeframe dashboard showing the average value of five core momentum indicators across multiple currency pairs to quickly identify overbought and oversold market conditions. What the Indicator Does Calculates a single average  value of five indicators (0–100) Uses five well-known momentum indicators Displays values across multiple timeframes and symbols Highlights oversold and overbought zones Provides a BUY / SELL decision column based on consecutive timeframe alignment Indicators Us
필터:
리뷰 없음
리뷰 답변