MacDPowerTrend

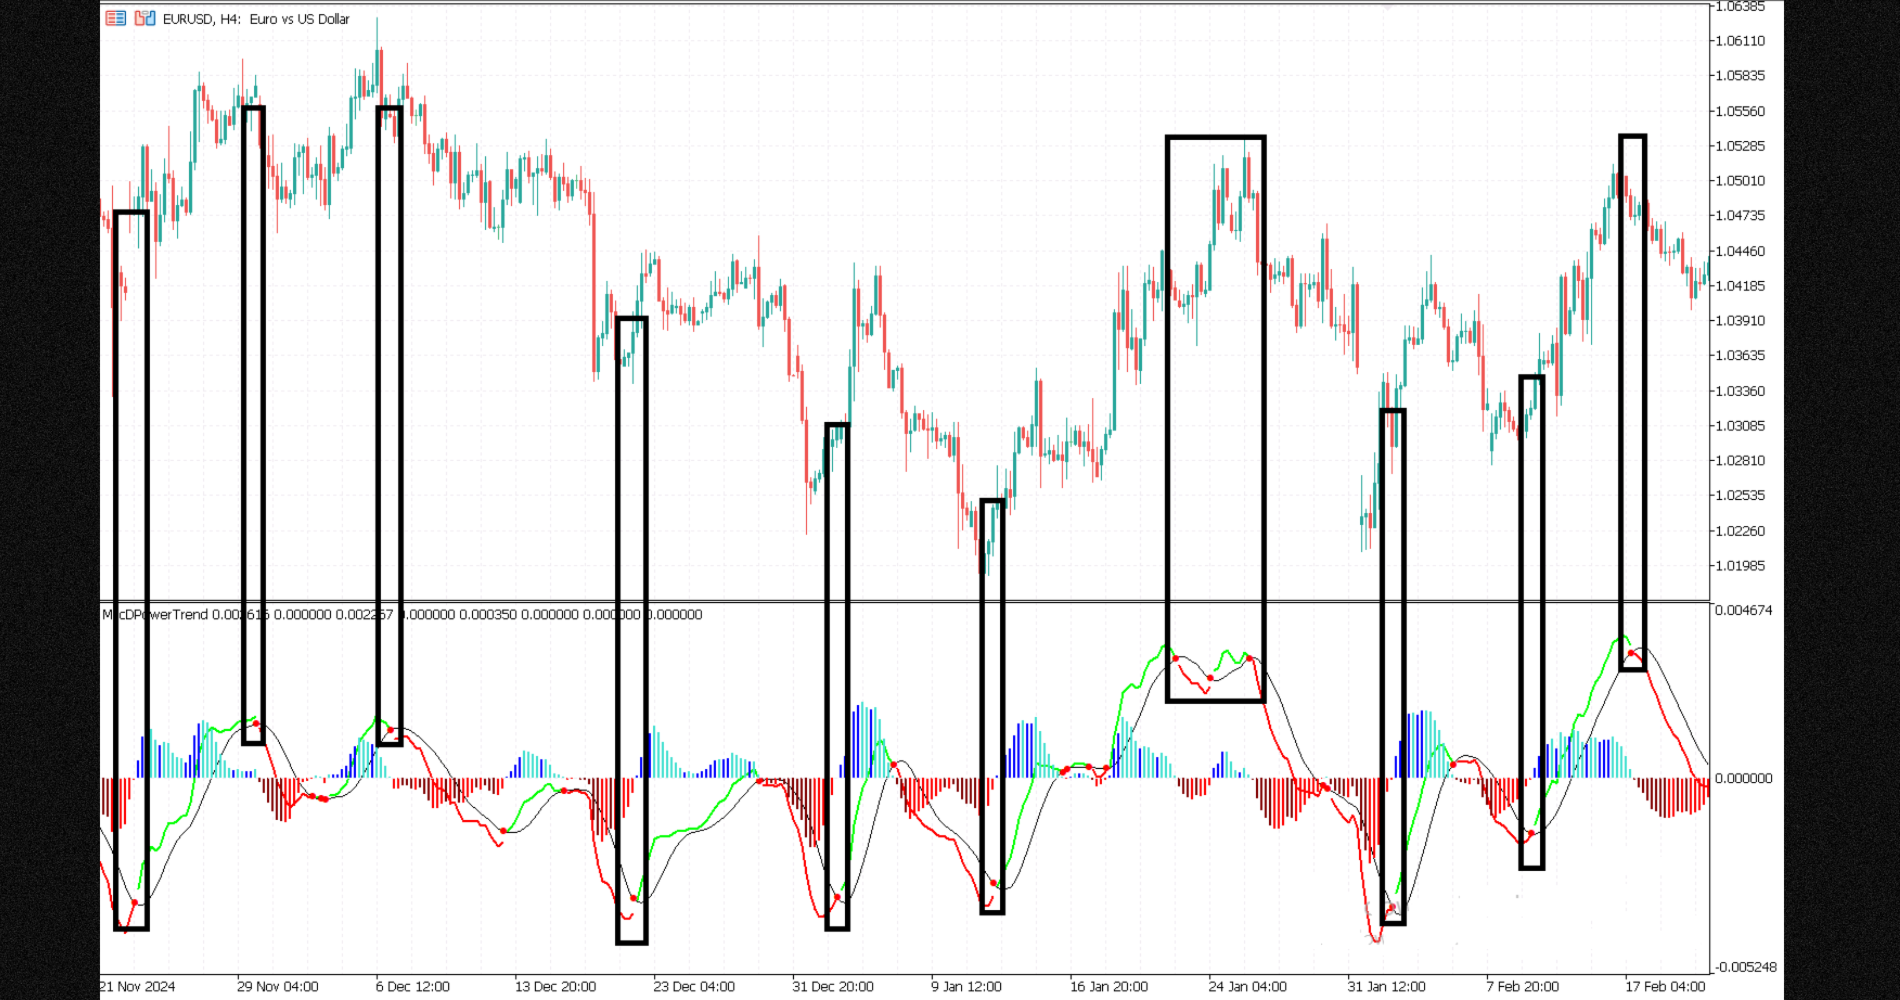
MacD Power Trend — Multi-Timeframe, Color MACD Indicator

Designed to help you avoid missing the most critical turning points in the market. Not a simple indicator, it speeds up the decision-making process for both novice and professional traders with its customizable color palette, multi-timeframe support, and clear visual signals.

• Multi-Timeframe Support
– Track 1-hour, 4-hour, daily, and more beyond your main chart with just one click.

• Dynamic Color Coding
– MACD line and histogram bars automatically change color according to profit/loss and momentum changes.

• Clear Signal Points
– Yellow arrows at intersections prevent you from missing trading opportunities.

• Minimal Resource Usage
– Lightweight, robust, and won’t impact your MT5 performance.

• Full Customization
– Turn on/off any line thickness, color, and indicator element you want.

Catch trend reversals and momentum bursts at a glance. MacD Power Trend; offers a smarter, faster and more visual trading experience.

I Wish You Lots of Earnings..!


추천 제품
Технический индикатор Universal Oscillator является комбинацией торговых сигналов самых популярных и широко используемых осцилляторов. Индикатор представлен гистограммами, а также линиями fast и slow MA, что позволяет расширить список получаемых торговых рекомендаций и работать как по тренду, так и в боковом движении рынка. Таким образом, гистограммы позволяют определить момент пробоя ценовых значений и движение в новой фазе рынка, а линии указывают на зоны перекупленности и перепроданности.  Ос
Paula Bollinger Bands Strategy
Francisco Gomes Da Silva
3.67 (3)
Bollinger bands out/in strategy A strategy created by Joe Ross, and very useful for finding trades when the market is overloaded. Indicator You don't need to find where there are entries on the chart, this indicator shows them for you. The entrance The trade is confirmed when the price closes outside the bollinger bands on a candle and the candle after the price closes inside the bands. comment I want to improve this indicator, so you can help me sending me your reviews and comments, thanks :).
FREE
MACDivergence MTF MT5
Pavel Zamoshnikov
4 (5)
Advanced ideas of the popular MACD indicator: It detects and displays classic and reverse divergences (two methods of detecting divergences). It uses different color to highlight an uptrend and a downtrend. Two methods of determining a trend: а) MACD crosses the 0 level (classic signal); б) MACD crosses its own average (early signal). This is a multi-timeframe indicator: it can display MACD data from other timeframes. Two methods of drawing: classic histogram and line. It generates sound and vis
Wilders MACD
Marco Antonio Cruz Dawkins
Wilder's MACD (Moving Average Convergence Divergence) is a variation of the traditional MACD indicator, incorporating Wilder's smoothing technique for more accurate trend signals. The indicator consists of three main components: MACD Line : This is the difference between two Exponential Moving Averages (EMAs) — a "Fast" EMA and a "Slow" EMA. The default periods are typically 12 for the Fast EMA and 26 for the Slow EMA. Signal Line : A smoothed version of the MACD Line using Wilder's Moving Avera
Multiple TimeFrame MACD Confluency Tool
Kelvin Souza Da Costa Oliveira
Multiple Timeframe MACD indicator. This indicator was built for making multiple timeframe analysis possible in MT5 using MACD Indicator. MACD Indicator traditionally shows two lines and one histogram. MACD Line(Yellow) is calculated by subtracting 12period EMA(fast) from 26period EMA (slow). Signal Line(Blue) is created by a 9period EMA from MACD Line. Histogram is just the difference between MACD and Signal lines. Histogram is colored based on the difference between its value and the previous h
Visual MACD Momentum Shift Indicator
AL MOOSAWI ABDULLAH JAFFER BAQER
MACD Momentum Shift Unleash the Power of Momentum in Your Trades The "MACD Momentum Shift" is an advanced trading indicator based on the renowned Moving Average Convergence Divergence (MACD). It’s crafted to give you the tools you need to optimize and adapt it for your personal trading style. Your Customizable Edge This indicator isn't pre-optimized—it's designed for you to take control. Modify MACD fast, slow, and signal periods, as well as the delay between signals, to suit your preferred str
Stochastic R
Antony Augustine
Stochastic  Reversal  allows you to recognize reversals professionally. Stochastic Indicator: This technical indicator was developed by George Lane more than 50 years ago. The reason why this indicator survived for so many years is because it continues to show consistent signals even in these current times. The Stochastic indicator is a momentum indicator that shows you how strong or weak the current trend is. It helps you identify overbought and oversold market conditions within a trend.  Rules
Discover the Power of the Multi Timeframe MACD Scanner for MT5 The MTF  MACD Scanner indicator is a practical tool for traders using MetaTrader 5 (MT5). It takes the well-known MACD (Moving Average Convergence Divergence) indicator and turns its data into easy-to-read dashboard and candle colors on your chart. This helps you spot market trends, momentum shifts, and potential reversals without needing to analyze separate MACD lines and switch between timeframes. What Does It Do? This indicator cr
The   Fibonacci Confluence Toolkit   is a technical analysis tool designed to help traders identify potential price reversal zones by combining key market signals and patterns. It highlights areas of interest where significant price action or reactions are anticipated, automatically applies Fibonacci retracement levels to outline potential pullback zones, and detects engulfing candle patterns. Its unique strength lies in its reliance solely on price patterns, eliminating the need for user-define
Binary MA Cross   MA Cross indicator by 4Umbella Create for traders both experienced and inexperienced to use it because it is a basic indicator How to use : 1. MA Fast  : Moving Average fast (Period 4 upto 50) 2. MA Middle :  Moving Average Middle (Period 10 upto 100) 3. MA Slow :  Moving Average Slow (Period 50 upto 200) to control trend markets. and trader can be set for Apply to price (Close, Open,Low,High,Median,Typical,weightd) For alert you can set to alert Next bar or instant bars. 
Cvd Divergence
Thalles Nascimento De Carvalho
CVD Divergence – 전문적인 주문 흐름 및 다이버전스 분석 CVD Divergence는 가격과 Cumulative Delta Volume(CVD) 사이의 신뢰할 수 있는 다이버전스를 감지하기 위해 개발된 기술적 지표입니다. 실제 주문 흐름이 가격 움직임을 확인하지 않을 때를 정확하게 포착하여, 잠재적 추세 전환, 매수·매도 세력의 소진, 기관의 시장 조작 가능성을 보여줍니다. 이 지표는 공격적인 거래량 분석과 가격 구조 해석을 결합해 명확하고 객관적이며 빠른 신호를 제공합니다. 지표 기능 CVD Divergence는 누적 델타 거래량을 사용하여 주문 흐름의 방향과 가격 방향을 비교합니다. 두 값이 크게 괴리될 경우 차트에 시각적 표시를 남기고 다이버전스 방향을 명확하게 보여줍니다. 다음과 같은 상황을 감지합니다: 강세 다이버전스 (가격이 하락하지만 CVD가 상승할 때) 약세 다이버전스 (가격이 상승하지만 CVD가 하락할 때) 매수·매도 세력의 힘 고갈 기관 주문 불균형으로
MACD Advanced
Stanislav Korotky
This indicator provides you with MACD formula applied to volume-aware Accumulation/Distribution and OnBalance Volumes indicators. In addition to tick volumes it supports special pseudo-real volumes, synthesized for Forex symbols where real volumes are unknown. More details on the volume surrogates may be found in description of another indicators - TrueVolumeSurrogate and OnBalanceVolumeSurrogate (algorithm of the latter is used internally in MACDAD for AD and OBV calculation before they procee
Buy CTS scalping indicator, provide buying and selling signals, automatic channeling and sending signals to mobile phones Using technical analysis and price action methods and modern methods, CTS indicator can draw price channels and recognize price trends with high accuracy and issue entry and exit signals according to them. Traders can easily fluctuate using this indicator in different time frames and in different markets. With the CTS indicator, you can signal in different ways. This indicato
MT5용 Crypto_Forex 지표 "HTF 이동평균 교차" - MT5용 강력한 HTF 이동평균 교차 지표로 거래 방식을 업그레이드하세요. HTF는 더 높은 시간대를 의미합니다. - 이 지표는 가격 변동이 있는 추세 트레이더에게 매우 유용합니다. - 더 높은 시간대의 빠르고 느린 이동평균을 현재 차트에 추가할 수 있습니다. 이는 전문적인 방법입니다. - HTF 이동평균 교차는 모바일 및 PC 알림 기능을 내장하고 있습니다. - 이 지표는 낮은 위험으로 상당한 수익을 얻을 수 있는 기회를 제공합니다. .......................................................................... 여기를 클릭하여 고품질 트레이딩 로봇과 지표를 확인하세요! 이 제품은 MQL5 웹사이트에서만 제공되는 오리지널 제품입니다.
MACD Divergence on MT5
KEENBASE SOFTWARE SOLUTIONS
KT MACD 다이버전스는 가격과 오실레이터 사이에 형성되는 일반 다이버전스와 숨겨진 다이버전스를 보여줍니다. 만약 당신의 거래 전략이 추세 반전을 예측한다면, MACD의 일반 다이버전스를 활용하여 잠재적인 전환 지점을 예측할 수 있습니다. 추세 지속을 기반으로 하는 전략이라면 MACD의 숨겨진 다이버전스가 적합합니다. KT MACD 다이버전스의 한계 MACD 다이버전스를 단독 진입 신호로 사용하는 것은 위험할 수 있습니다. 모든 다이버전스가 반전 신호로 해석될 수는 없습니다. 더 나은 결과를 얻으려면 가격 행동 및 기타 분석 기법과 함께 사용하는 것이 좋습니다. 기능 소개 가격과 오실레이터 간의 일반 및 숨겨진 다이버전스를 표시합니다. 비대칭 다이버전스는 정확도를 높이고 혼란을 줄이기 위해 제거됩니다. 추세 반전 및 추세 지속 전략 모두에 사용할 수 있습니다. EA(Expert Advisor)에 완벽하게 통합 가능합니다. 진입뿐만 아니라 청산 시점에도 활용할 수 있습니다. 모든
RSI 볼린저 밴드 화살표 전략 (RSI Bollinger Bands Arrow Strategy) RSI 볼린저 밴드 화살표 전략은 RSI와 볼린저 밴드의 조합을 사용하여 높은 확률의 반전 지점을 식별하도록 설계된 깔끔하고 효과적인 기술 지표입니다. 이 전략은 RSI 지표를 볼린저 밴드와 함께 사용하여 다음을 수행합니다. 가격이 볼린저 밴드 상단 위에 있을 때 매도합니다. 가격이 볼린저 밴드 하단 아래에 있을 때 매수합니다. 두 지표가 동일한 시장 상황을 동시에 확인할 때만 신호가 생성되어 정확도를 높이고 잘못된 진입을 줄입니다. 작동 방식 매수 신호: 가격이 볼린저 밴드 하단 아래에서 위로 교차합니다. RSI가 정의된 과매도 수준을 위로 교차합니다. 차트에 녹색 매수 화살표가 나타납니다. 매도 신호: 가격이 볼린저 밴드 상단 위에서 아래로 교차합니다. RSI가 정의된 과매수 수준을 아래로 교차합니다. 차트에 빨간색 매도 화살표가 나타납니다. 이 간단한 전략은 RSI와
Stochastic Divergen MT5
Komang Putra Riswanjaya
2 (1)
Overview The Stochastic Divergence Indicator is a tool designed to help identify potential market turning points by analyzing divergences between price and the Stochastic Oscillator. It highlights divergence signals visually on the chart, assisting traders in observing possible trend changes. Key Features No Repaint: Once a signal is formed, it remains on the chart. Adjustable Parameters: Settings can be modified to fit different trading preferences and timeframes. Visual Display: Arrows are plo
주요 기능 EMA 추세 필터 이 지표는 사용자 정의 가능한 EMA(지수 이동 평균)를 사용하여 현재 추세 방향을 감지합니다. 가격이 EMA 위로 교차 → 매수 신호 가격이 EMA 아래로 교차 → 매도 신호 동적 지지 및 저항 수준 내장된 고점/저점 구조: 빨간색 선 → 이전 N개 봉의 최고 고점 (저항) 녹색 선 → 이전 N개 봉의 최저 저점 (지지) 이러한 수준은 약한 신호를 필터링하고 강력한 돌파를 식별하는 데 도움이 됩니다. 스마트 ATR 변동성 필터 시장의 변동성이 충분히 강할 때만 신호가 나타납니다. 이는 거래량이 적거나 횡보하는 시장에서의 거짓 신호를 방지합니다. 실시간 및 확인된 신호 라이브 바(실시간)와 바 마감 모두에서 작동합니다. 스팸 방지를 위해 신호당 한 번만 알림이 나타납니다. 알림 및 통지 지표가 사용자에게 알리는 방법을 선택하세요: 화면 알림 푸시 알림 소리 알림 다시는 거래를 놓치지 마세요. 깔끔하고 간단하며 효과적 전문적인 코
The RSI Divergence + FVG Signal indicator combines Relative Strength Index (RSI) Divergence with Fair Value Gap (FVG) detection to generate high-probability buy and sell signals based on both momentum shifts and institutional imbalance zones. Core Features: RSI Divergence Detection : Identifies both regular and hidden bullish/bearish divergences between price and RSI. Divergences indicate potential trend reversals or continuation. FVG Zone Recognition : Detects Fair Value Gaps (imbalances caused
The Trend Duration Forecast MT5 indicator is designed to estimate the probable lifespan of a bullish or bearish trend. Using a Hull Moving Average (HMA) to detect directional shifts, it tracks the duration of each historical trend and calculates an average to forecast how long the current trend is statistically likely to continue. This allows traders to visualize both real-time trend strength and potential exhaustion zones with exceptional clarity. KEY FEATURES Dynamic Trend Detection:   Utiliz
Supertrend indicator uses a combination of a moving average and average true range to detect the trend of a trading instrument. Supertrend indicator for MetaTrader 5 easily shows the trend as a line following the price. Triple SuperTrend Histo indicator  calculate  three supertrends to show the trend as a histogram. Changing the color from red to green means you can BUY , from green to red means you can SELL . Description of the method of drawing a histogram. The price is above the EMA 200,
Three Bar Supertrend combines precise reversal pattern detection with the power of the Supertrend trend filter. Built for intraday and swing traders, it spots high-probability bullish and bearish reversals based on a strict three-bar formation—optionally filtered by an SMA trend condition. Features: Detects 3-bar bullish and bearish reversals Uses Supertrend for directional confirmation Optional SMA Fast vs Slow filter for added precision Plots green/red arrows only on valid reversal patterns Ze
Scalping Flash X
Syamsurizal Dimjati
SCALPFLASH-X Where Fibonacci Precision Meets RSI Intelligence. Next-gen trading system combining Adaptive Fibonacci Pivots, RSI Heat Mapping, and Smart Candle Analytics. Detect market dominance, momentum shifts, and reversal zones in real time across multiple timeframes. Institutional accuracy, retail simplicity — built for speed, clarity, and precision. Advanced Multi-Timeframe Fibonacci & RSI-Driven Market Intelligence System ScalpFlash-X — A next-generation trading system combining Fibonacc
Antique Trend
Nadiya Mirosh
The Antique Trend Indicator is a revolutionary trend trading and filtering solution with all the important features of a trend tool built into one tool! The Antique Trend indicator is good for any trader, suitable for any trader both for Forex and binary options. There is no need to configure anything, everything has been perfected by time and experience, it works great during flats and trends. The Antique Trend indicator is a tool for technical analysis of financial markets, reflecting curren
"Blow It Up!" – The Trading Indicator That Questions Your Life Choices Tired of boring indicators? Meet your new market companion that delivers:   "YOLO BUY!" arrows   when you should probably panic   Explosive rectangle confetti   (because why not?)   200+ soul-crushing quotes   like   "Your stop loss is imaginary"   and   "This isn’t trading, it’s donating to whales"   Random alerts that roast your strategy This Indicator is like Therapy   – Because daytrading shouldn’t feel
HMA Trend Professional MT5
Pavel Zamoshnikov
4.25 (4)
Improved version of the free HMA Trend indicator (for MetaTrader 4) with statistical analysis. HMA Trend is a trend indicator based on the Hull Moving Average (HMA) with two periods. HMA with a slow period identifies the trend, while HMA with a fast period determines the short-term movements and signals in the trend direction. The main differences from the free version: Ability to predict the probability of a trend reversal using analysis of history data. Plotting statistical charts for analyzi
MACD Signal Pro
Albert Kassina Diatta
MACD 시그널 프로 – 멀티 타임프레임 스캐너 MACD 시그널 프로는 여러 시간대에 걸쳐 명확하고, 필터링되고, 검증된 신호를 원하는 트레이더를 위해 설계된 고급 지표입니다. 기존 MACD의 강력한 기능과 지능형 멀티 타임프레임 스캐너를 결합하여 현대적인 시각적 패널에 표시함으로써, 잘못된 신호를 방지하고 진입 정확도를 향상시켜 줍니다. 외환, 지수, 암호화폐, 금속 거래에 이상적입니다. 주요 기능 정확한 매수/매도 신호 MACD/신호 교차 기반 차트에 바로 표시되는 화살표 통합 다중 시간대 스캐너 M1 → MN1 각 시간대별 추세 실시간 시각화 상승 또는 하락 추세선 신속 감지 전문적이고 직관적인 패널 시간대별 매수/매도 신호 신호 강도 지표(%) 전체 요약: 상승 / 하락 / 혼합 종합적인 알림 시스템 음성 알림 푸시 알림 이메일 캔들별 단일 알림 (스팸 방지) 100% 맞춤 설정 가능 MACD 설정
이 지표는 메타트레이더 5 플랫폼을 위한 스토캐스틱 오실레이터의 변형입니다. 표시기에 대한 정보 이중 확률 적 외환 지표는 과매도 및 과매 수를 평가하기 위해 고정 수준 대신 부동 수준을 사용하여 이중 확률 적 외환 지표에 적용됩니다. 이 경우,당신은 단지 두 배 확률 적입니다. 결과의 추가 스무딩을 사용할 수 있습니다(이를 위해 내장 된 에마가 사용됩니다). 일반적인 22 가지 가격 유형을 사용할 수 있습니다. 이중 확률 적 외환 표시기는 이중 평활 확률 적와 혼동해서는 안된다는 점에 유의하십시오-이들은 다른 지표입니다. 표시기 사용 방법 더블 확률 가능한 한 사용하기 쉽고 당신에게서 일류 거래 기술과 지식을 필요로하지 않습니다. 그것은 당신이 그를보고 표시기에 나타나는 색상을 구별하는 것으로 충분합니다. 그리고 정확하게 말하면 표시기에는 파란색,주황색의 두 가지 색상이 있습니다. 따라서: 오렌지-우리는 판매 블루-우리는 구매 그래서 표시기에 세 가지
Macd Pro System
Magdalena Estefania Colonna
Hello traders, here's the MACD Pro System. This is a MACD indicator for professional technical analysis. Main Components 1. MACD Visual Elements: MACD Histogram (green): Difference between the MACD line and the signal line MACD Line (dodger blue): Difference between the fast EMA (12) and the slow EMA (26) Signal Line (red): 9-period Simple Moving Average of the MACD 2. Configurable Parameters: MACD Settings: Fast EMA: 12 periods (default) Slow EMA: 26 periods (default) SMA Signal: 9 periods
Gekko MACD Plus
Rodrigo Galeote
3 (3)
Type: Oscillator This is Gekko's Cutomized Moving Average Convergence/Divergence (MACD), a customized version of the famous MACD indicator. Use the regular MACD and take advantage of several entry signals calculations and different ways of being alerted whenever there is potential entry point. Inputs Fast MA Period: Period for the MACD's Fast Moving Average (default 12); Slow MA Period: Period for the MACD's Slow Moving Average (default 26); Signal Average Offset Period: Period for the Signal A
이 제품의 구매자들이 또한 구매함
ARICoins
Temirlan Kdyrkhan
ARICoin is a powerful trading companion designed to generate high-probability entry signals with dynamic TP/SL/DP levels based on volatility. Built-in performance tracking shows win/loss stats, PP1/PP2 hits, and success rates all updated live. Key Features: Buy/Sell signals with adaptive volatility bands Real-time TP/SL/DP levels based on ATR Built-in MA Filter with optional ATR/StdDev volatility Performance stats panel (Success, Profit/Loss, PP1/PP2) Alerts via popup, sound, push, or email Cust
SuperScalp Pro
Van Minh Nguyen
5 (9)
SuperScalp Pro – 고급 다중 필터 스캘핑 인디케이터 시스템 SuperScalp Pro는 클래식 Supertrend와 여러 지능형 확인 필터를 결합한 고급 스캘핑 인디케이터 시스템입니다. 해당 인디케이터는 M1부터 H4까지 모든 타임프레임에서 효율적으로 작동하며, 특히 XAUUSD, BTCUSD 및 주요 외환 통화쌍에 적합합니다. 독립형 시스템으로 사용하거나 기존 거래 전략에 유연하게 통합할 수 있습니다. 이 인디케이터는 11개 이상의 필터를 통합하며, 빠른/느린 EMA, 추세 판별용 3개의 EMA, EMA 기울기(EMA slope), RSI, ADX, 거래량(Volume), VWAP, 볼린저 밴드 돌파(Bollinger Bands Breakout) 및 MACD 다이버전스 필터 등을 포함합니다. 스마트 캔들 필터는 캔들 종가를 확인하여 약한 신호를 제거하고, 3 EMA와 MACD 다이버전스 필터를 결합한 추세 인식 메커니즘은 더 높은 승률의 신호를 선별하는 데 도움을 줍니
AriX
Temirlan Kdyrkhan
1 (4)
AriX Indicator for MT5 A powerful trend-following and signal-evaluation tool AriX is a custom MT5 indicator that combines Moving Averages and ATR-based risk/reward logic to generate clear buy/sell signals. It visualizes dynamic SL/TP levels, evaluates past trade outcomes, and displays win/loss statistics in a clean on-chart panel. Key features include: Buy/Sell signals based on MA crossovers ATR-based SL/TP1/TP2/TP3 levels with visual lines and labels Signal outcome tracking with real-time stat
이 지표를 구매하면 제 프로페셔널 트레이드 매니저를 무료로 드립니다. 우선 이 거래 시스템이 리페인팅, 리드로잉 및 레이그 인디케이터가 아니라는 점을 강조하는 것이 중요합니다. 이는 수동 및 로봇 거래 모두에 이상적인 것으로 만듭니다. 온라인 강좌, 설명서 및 프리셋 다운로드. "스마트 트렌드 트레이딩 시스템 MT5"은 새로운 및 경험이 풍부한 트레이더를 위해 맞춤형으로 제작된 종합적인 거래 솔루션입니다. 10개 이상의 프리미엄 인디케이터를 결합하고 7개 이상의 견고한 거래 전략을 특징으로 하여 다양한 시장 조건에 대한 다목적 선택이 가능합니다. 트렌드 추종 전략: 효과적인 트렌드 추이를 타기 위한 정확한 진입 및 손절 관리를 제공합니다. 반전 전략: 잠재적인 트렌드 반전을 식별하여 트레이더가 범위 시장을 활용할 수 있게 합니다. 스캘핑 전략: 빠르고 정확한 데이 트레이딩 및 단기 거래를 위해 설계되었습니다. 안정성: 모든 인디케이터가 리페인팅, 리드로잉 및 레이그가 아니므로 신뢰
FX Trend MT5 NG
Daniel Stein
5 (4)
FX Trend NG: 차세대 멀티 마켓 트렌드 인텔리전스 개요 FX Trend NG 는 다중 시간 프레임 기반의 전문 트렌드 분석 및 시장 모니터링 도구입니다. 몇 초 만에 전체 시장 구조를 파악할 수 있도록 설계되었습니다. 여러 차트를 일일이 전환할 필요 없이, 어떤 종목이 추세에 있는지, 어디에서 모멘텀이 약화되고 있는지, 그리고 어떤 시간 프레임이 서로 정렬되어 있는지 즉시 확인할 수 있습니다. 출시 기념 특별 혜택 – FX Trend NG 를 $30 (6개월) 또는 $80 평생 라이선스 로 이용할 수 있습니다. 이미 Stein Investments 고객이신가요? -> 메시지를 보내 전용 고객 그룹에 참여하세요. 설정이나 사용 방법이 필요하신가요? -> Stein Investments 공식 페이지 를 방문하세요. 1. FX Trend NG가 특별한 이유 3단계 추세 로직 – 단순한 Buy / Sell이 아닙니다 • 대부분의 지표는 Buy 또는 Sell 두 가지 상태만 제
Divergence Bomber
Ihor Otkydach
4.89 (83)
이 지표를 구매하신 분께는 다음과 같은 혜택이 무료로 제공됩니다: 각 거래를 자동으로 관리하고, 손절/익절 수준을 설정하며, 전략 규칙에 따라 거래를 종료하는 전용 도우미 툴 "Bomber Utility" 다양한 자산에 맞게 지표를 설정할 수 있는 셋업 파일(Set Files) "최소 위험", "균형 잡힌 위험", "관망 전략" 모드로 설정 가능한 Bomber Utility의 셋업 파일 이 전략을 빠르게 설치, 설정, 시작할 수 있도록 돕는 단계별 영상 매뉴얼 주의: 위의 모든 보너스를 받기 위해서는 MQL5 개인 메시지 시스템을 통해 판매자에게 연락해 주세요. 독창적인 커스텀 지표인 “Divergence Bomber(다이버전스 봄버)”를 소개합니다. 이 지표는 MACD 다이버전스(괴리) 전략을 기반으로 한 올인원(All-in-One) 거래 시스템입니다. 이 기술 지표의 주요 목적은 가격과 MACD 지표 간의 다이버전스를 감지하고, **향후 가격이 어느 방향으로 움직일지를 알려주는
Market Flow Pro
Gabriele Sabatino
4 (1)
Market Flow Pro Market Flow Pro is an intelligent trading advisor for the MetaTrader 5 platform, designed for automatic trading on financial markets using algorithmic analysis and strict risk management. -Key features: - Fully automatic trading 24/5 - Adaptive trend and momentum entry algorithm -  Built-in risk management - Flexible lot settings (fixed/auto-calculation) - Support for major currency pairs and indices - Optimised for operation on various timeframes  How it works Market
Entry In The Zone and SMC Multi Timeframe is a real-time market analysis tool developed based on Smart Money Concepts (SMC). It is designed to analyze market structure, price direction, reversal points, and key zones across multiple timeframes in a systematic way. The system displays Points of Interest (POI) and real-time No Repaint signals, with instant alerts when price reaches key zones or when signals occur within those zones. It functions as both an Indicator and a Signal System (2-in-1), c
Grabber System MT5
Ihor Otkydach
4.82 (22)
탁월한 기술적 지표인 Grabber를 소개합니다. 이 도구는 즉시 사용 가능한 “올인원(All-Inclusive)” 트레이딩 전략으로 작동합니다. 하나의 코드 안에 강력한 시장 기술 분석 도구, 매매 신호(화살표), 알림 기능, 푸시 알림이 통합되어 있습니다. 이 인디케이터를 구매하신 모든 분들께는 다음의 항목이 무료로 제공됩니다: Grabber 유틸리티: 오픈 포지션을 자동으로 관리하는 도구 단계별 영상 매뉴얼: 설치, 설정, 그리고 실제 거래 방법을 안내 맞춤형 세트 파일: 인디케이터를 빠르게 자동 설정하여 최고의 성과를 낼 수 있도록 도와줍니다 다른 전략은 이제 잊어버리세요! Grabber만이 여러분을 새로운 트레이딩의 정점으로 이끌어 줄 수 있습니다. Grabber 전략의 주요 특징: 거래 시간 프레임: M5부터 H4까지 거래 가능한 자산: 어떤 자산이든 사용 가능하지만, 제가 직접 테스트한 종목들을 추천드립니다 (GBPUSD, GBPCAD, GBPCHF, AUDCAD, AU
Power Candles MT5
Daniel Stein
5 (6)
Power Candles – 모든 시장을 위한 강도 기반 진입 신호 Power Candles 는 Stein Investments의 검증된 강도 분석을 가격 차트에 직접 제공합니다. 가격 움직임에만 반응하는 대신, 각 캔들은 실제 시장 강도를 기준으로 색상화되어 모멘텀 형성, 강도 가속, 명확한 추세 전환을 즉시 파악할 수 있습니다. 모든 시장을 위한 단일 로직 Power Candles는 모든 거래 심볼 에서 자동으로 작동합니다. 현재 심볼이 Forex인지 비-Forex 시장인지 자동으로 감지하여 내부적으로 적절한 강도 모델을 적용합니다. Forex 및 Gold 는 FX Power Delta 값을 사용합니다 (절대값 범위 최대 100) 지수, 크립토 및 CFD 는 IX Power Strength 값을 사용합니다 (절대값 범위 최대 50) 필요한 강도 계산은 Power Candles에 완전히 내장되어 있습니다. 캔들 색상이나 신호 로직을 위해 추가 인디케이터는 필요하지 않습니다. 가격
RFI levels PRO MT5
Roman Podpora
3.67 (3)
이 지표는 추세 반전 지점과 가격 반등 영역을 정확하게 보여줍니다.       주요 투자자들   . 새로운 트렌드가 형성되는 곳을 파악하고 최대한 정확하게 의사결정을 내리며 모든 거래를 완벽하게 통제합니다. TREND LINES PRO   지표와 함께 사용할 때 최대의 잠재력을 발휘합니다.  VERSION MT4 지표가 보여주는 내용: 새로운 추세의 시작 시 활성화되는 반전 구조 및 반전 수준. 최소한의 위험 대비 수익률을 갖는 이익 실현   (TAKE PROFIT)   및   손절매(STOP LOSS)   레벨 표시       RR 1:2   . 지능형 손실 감소 로직이 적용된 손절매 기능. 지정된 지표에서 두 가지 추세 유형에 대한 반전 패턴을 표시합니다. 지표: 트렌드를 따라   트렌드 라인 프로   (글로벌 트렌드 변화) 트렌드 프로   (빠른 트렌드 변화) 간단하고 효과적입니다       스캐너       실시간 추세 (신규). 다중 시간 프레임 도구 필터링. 표시하다  
Game Changer Indicator mt5
Vasiliy Strukov
5 (19)
Game Changer는 모든 금융 상품에 적용 가능한 혁신적인 추세 지표로, MetaTrader를 강력한 추세 분석 도구로 탈바꿈시켜 줍니다. 모든 시간대에서 작동하며 추세 식별, 잠재적 반전 신호 제공, 트레일링 스톱 기능, 그리고 신속한 시장 대응을 위한 실시간 알림 기능을 제공합니다. 숙련된 전문가든 이제 막 시작하는 초보자든, Game Changer는 추세의 역학을 명확하게 이해하고 자신감 있고 규율 있는 거래를 할 수 있도록 도와줍니다. 이 지표는 차트 재구성 기능을 지원합니다. 구매 후 즉시 연락 주시면 특별 보너스를 드립니다. Strong Support 및 Trend Scanner 지표를 무료로 제공해 드립니다. [email protected]으로 메시지를 보내주세요. 참고로, 저는 텔레그램에서 EA나 특별 세트를 판매하지 않습니다. 모든 EA는 MQL5에서만 사용 가능하며, 세트 파일은 제 블로그(여기)에서만 다운로드하실 수 있습니다. 사기꾼을 조심하시고 다른 사
FX Power MT5 NG
Daniel Stein
5 (31)
FX Power: 통화 강세 분석으로 더 스마트한 거래 결정을 개요 FX Power 는 어떤 시장 상황에서도 주요 통화와 금의 실제 강세를 이해하기 위한 필수 도구입니다. 강한 통화를 매수하고 약한 통화를 매도함으로써 FX Power 는 거래 결정을 단순화하고 높은 확률의 기회를 발견합니다. 트렌드를 따르거나 극단적인 델타 값을 사용해 반전을 예측하고자 한다면, 이 도구는 귀하의 거래 스타일에 완벽히 적응합니다. 단순히 거래하지 말고, FX Power 로 더 스마트하게 거래하세요. 1. FX Power가 거래자에게 매우 유용한 이유 통화와 금의 실시간 강세 분석 • FX Power 는 주요 통화와 금의 상대적 강세를 계산하고 표시하여 시장 역학에 대한 명확한 통찰력을 제공합니다. • 어떤 자산이 앞서고 있고 어떤 자산이 뒤처지는지 모니터링하여 보다 현명한 거래 결정을 내릴 수 있습니다. 포괄적인 멀티 타임프레임 뷰 • 단기, 중기 및 장기 타임프레임에서 통화와 금의 강세를
Azimuth Pro
Ottaviano De Cicco
5 (4)
LAUNCH PROMO Azimuth Pro price is initially set at 299$ for the first 100 buyers. Final price will be 499$ . THE DIFFERENCE BETWEEN RETAIL AND INSTITUTIONAL ENTRIES ISN'T THE INDICATOR — IT'S THE LOCATION. Most traders enter at arbitrary price levels, chasing momentum or reacting to lagging signals. Institutions wait for price to reach structured levels where supply and demand actually shift. Azimuth Pro maps these levels automatically: swing-anchored VWAP, multi-timeframe structure lines, an
Smart Stop Indicator – 차트 위에서 직접 작동하는 지능형 스톱로스 시스템 개요 Smart Stop Indicator는 감이나 추측이 아닌 명확하고 체계적인 방식으로 스톱로스를 설정하고 싶은 트레이더를 위한 맞춤형 솔루션입니다. 이 도구는 클래식 프라이스 액션 논리(고점, 저점 구조)와 현대적인 브레이크아웃 인식을 결합하여 실제로 가장 논리적인 다음 스톱 레벨을 정확히 식별합니다. 추세, 박스권, 빠른 브레이크아웃 상황 등 어떤 시장에서도 인디케이터는 최적의 SL 구역과 상태(“new”, “broken”, “valid”)를 차트에 직접 표시합니다. 새로운 기능으로 SL 거리의 %ADR 표시가 추가되었습니다. 핵심 기능 자동 시장구조 기반 스톱 설정 • 시장 구조와 실시간 가격 움직임을 기반으로 의미 있는 스톱로스 레벨을 자동으로 탐지합니다. 스마트 브레이크아웃 감지 • 빠른 방향 변화나 돌파 상황에서도 불필요한 조기 스톱 조정을 강요하지 않으며 유연하게 반응합
Atomic Analyst MT5
Issam Kassas
4.1 (29)
우선적으로 언급할 점은이 거래 지표가 다시 그리지 않고 지연되지 않으며 이를 통해 수동 및 로봇 거래 모두에 이상적이라는 점입니다. 사용자 매뉴얼: 설정, 입력 및 전략. Atomic Analyst는 가격의 강도와 모멘텀을 활용하여 시장에서 더 나은 이점을 찾는 PA Price Action Indicator입니다. 고급 필터를 장착하여 잡음과 거짓 신호를 제거하고 거래 잠재력을 높이는 데 도움이 됩니다. 복잡한 지표의 다중 레이어를 사용하여 Atomic Analyst는 차트를 스캔하고 복잡한 수학적 계산을 간단한 신호와 색상으로 변환하여 초보 트레이더가 이해하고 일관된 거래 결정을 내릴 수 있도록합니다. "Atomic Analyst"는 새로운 및 경험이 풍부한 트레이더를위한 종합적인 거래 솔루션입니다. 프리미엄 지표와 최고 수준의 기능을 하나의 거래 전략에 결합하여 모든 종류의 트레이더에 대한 다재다능한 선택지가되었습니다. 인트라데이 거래 및 스캘핑 전략 : 빠르고 정확한 일일
RelicusRoad Pro MT5
Relicus LLC
5 (24)
RelicusRoad Pro: 퀀트 시장 운영 체제 70% 할인 평생 이용권 (한정 시간) - 2,000명 이상의 트레이더와 함께하세요 왜 대부분의 트레이더는 "완벽한" 지표를 가지고도 실패할까요? 진공 상태에서 단일 개념 만으로 거래하기 때문입니다. 문맥 없는 신호는 도박입니다. 지속적인 승리를 위해서는 컨플루언스(중첩) 가 필요합니다. RelicusRoad Pro는 단순한 화살표 지표가 아닙니다. 완전한 퀀트 시장 생태계 입니다. 독점적인 변동성 모델링을 사용하여 가격이 이동하는 "공정 가치 로드"를 매핑하고, 단순 노이즈와 실제 구조적 돌파를 구분합니다. 추측은 그만두세요. 기관급 로드 로직으로 거래를 시작하세요. 핵심 엔진: "Road" 알고리즘 시스템의 중심에는 시장 상황에 실시간으로 적응하는 동적 변동성 채널인 Road Algo 가 있습니다. 세이프 라인(평형) 과 가격이 수학적으로 반전될 가능성이 높은 확장 레벨 을 투영합니다. Simple Road: 일반적인 시장을 위
Quantum TrendPulse
Bogdan Ion Puscasu
5 (22)
SuperTrend   ,   RSI   ,   Stochastic   의 힘을 하나의 포괄적인 지표로 결합하여 트레이딩 잠재력을 극대화하는 궁극의 트레이딩 도구   인 Quantum TrendPulse를   소개합니다. 정밀성과 효율성을 추구하는 트레이더를 위해 설계된 이 지표는 시장 추세, 모멘텀 변화, 최적의 진입 및 종료 지점을 자신 있게 식별하는 데 도움이 됩니다. 주요 특징: SuperTrend 통합:   주요 시장 추세를 쉽게 따라가고 수익성의 물결을 타세요. RSI 정밀도:   매수 과다 및 매도 과다 수준을 감지하여 시장 반전 시점을 파악하는 데 적합하며 SuperTrend 필터로 사용 가능 확률적 정확도:   변동성이 큰 시장에서 숨겨진 기회를 찾기 위해 확률적 진동   을 활용하고 SuperTrend의 필터로 사용 다중 시간대 분석:   M5부터 H1 또는 H4까지 다양한 시간대에 걸쳐 시장을 최신 상태로 유지하세요. 맞춤형 알림:   맞춤형 거래 조건이 충족되면
Trend Lines PRO MT5
Roman Podpora
5 (1)
트렌드 라인즈 프로       이 지표는 시장이 실제로 어떤 방향으로 전환되는지 파악하는 데 도움이 됩니다. 실제 추세 반전 지점과 주요 시장 참여자들이 다시 진입하는 지점을 보여줍니다. 보시다시피       BOS 라인       복잡한 설정이나 불필요한 노이즈 없이 더 높은 시간대의 추세 변화와 주요 레벨을 확인할 수 있습니다. 신호는 차트에 다시 그려지지 않고 캔들이 마감된 후에도 계속 표시됩니다. MT4 버전   -   RFI LEVELS PRO   표시기   와 결합 시 최대 잠재력을 발휘합니다. 지표가 보여주는 내용: 실제 변화       추세(BOS 라인) 한 번 신호가 나타나면 그 신호는 계속 유효합니다! 이는 신호를 발생시킨 후 변경될 수 있는 리페인팅 방식의 지표와 중요한 차이점입니다. 리페인팅 방식의 지표는 잠재적으로 자금 손실로 이어질 수 있습니다. 이제 더욱 높은 확률과 정확도로 시장에 진입할 수 있습니다. 또한 화살표가 나타난 후 목표가(익절)에 도달하거나
Trend indicator AI mt5
Ramil Minniakhmetov
5 (15)
트렌드 인공 지능 지표는 실행 가능한 진입 점 및 반전 경고와 추세 식별을 결합하여 상인의 시장 분석을 향상시킬 훌륭한 도구입니다. 이 표시기는 사용자가 자신감과 정밀도로 외환 시장의 복잡성을 탐색 할 수 있도록 지원합니다 기본 신호 외에도 트렌드 인공 지능 지표는 풀백 또는 되돌림 중에 발생하는 2 차 진입 점을 식별하여 거래자가 기존 트렌드 내에서 가격 수정을 활용할 수 있도록합니다. 중요한 장점: ·작동 4 및 5 *명확한 구매 또는 판매 신호 *다시 칠하지 않습니다 *모든 자산에서 작동 나는 전보 사기에 개 또는 세트를 판매하지 않도록주의. 모든 설정은 블로그에 여기에 무료.  중요! 지침 및 보너스를 얻기 위해 구입 후 즉시 저에게 연락! 진짜 가동 감시는 뿐 아니라 나의 다른 제품 여기에서 찾아낼 수 있습니다: https://www.mql5.com/en/users/mechanic/seller&nbsp ; 설정 및 입력: 모든 자산에 대해 기본 설정을 권
Trend Screener Pro MT5
STE S.S.COMPANY
4.84 (101)
트렌드 표시기, 트렌드 트레이딩 및 필터링을 위한 획기적인 고유 솔루션, 하나의 도구 안에 내장된 모든 중요한 트렌드 기능! Forex, 상품, 암호 화폐, 지수 및 주식과 같은 모든 기호/도구에 사용할 수 있는 100% 다시 칠하지 않는 다중 시간 프레임 및 다중 통화 표시기입니다. Trend Screener는 차트에 점이 있는 화살표 추세 신호를 제공하는 효율적인 지표 추세 추종 지표입니다. 추세 분석기 표시기에서 사용할 수 있는 기능: 1. 트렌드 스캐너. 2. 최대 이익 분석이 있는 추세선. 3. 추세 통화 강도 측정기. 4. 경고가 있는 추세 반전 점. 5. 경고가 있는 강력한 추세 점. 6. 추세 화살표 Trend Screener Indicator가 있는 일일 분석 예, 일일 신호 성능...등은 여기에서 찾을 수 있습니다. 여기를 클릭하십시오. LIMITED TIME OFFER : Trend Screener Indicator는 50$ 및 평생 동안만 사용할 수 있습니다.
Entry Points Pro for MT5
Yury Orlov
4.48 (138)
다시 색을 칠하지 않고 거래에 진입할 수 있는 정확한 신호를 제공하는 MT5용 지표입니다. 외환, 암호화폐, 금속, 주식, 지수 등 모든 금융 자산에 적용할 수 있습니다. 매우 정확한 추정값을 제공하고 매수와 매도의 가장 좋은 시점을 알려줍니다. 하나의 시그널로 수익을 내는 지표의 예와 함께 비디오 (6:22)시청하십시오! 대부분의 거래자는 Entry Points Pro 지표의 도움으로 첫 거래 주 동안 트레이딩 결과를 개선합니다. 저희의   Telegram Group 을 구독하세요! Entry Points Pro 지표의 좋은점. 재도색이 없는 진입 신호 신호가 나타나고 확인되면(시그널 캔들이 완성된 경우) 신호는 더 이상 사라지지 않습니다. 여타 보조지표의 경우 신호를 표시한 다음 제거되기 때문에 큰 재정적 손실로 이어집니다. 오류 없는 거래 게시 알고리즘을 통해 트레이드(진입 또는 청산)를 할 이상적인 순간을 찾을 수 있으며, 이를 통해 이를 사용하는 모든 거래자의 성공률이
Candle Smart Range
Gianny Alexander Lugo Sanchez
MetaTrader 5용 Candle Smart Range (CSR) Candle Smart Range는 여러 타임프레임에서 가격 범위를 자동으로 식별하도록 설계된 기술 지표입니다. 이 도구는 캔들 형성 및 이전 고점/저점과의 상호작용을 바탕으로 시장 구조를 분석합니다. 주요 기능: 범위 감지: 급격한 변동 전의 횡보 구간을 자동으로 식별합니다. 거짓 돌파 식별: 가격이 이전 수준을 넘어섰으나 캔들 종가 기준으로 범위 내에서 마감된 경우를 표시합니다. 멀티 타임프레임 분석: 사용자 정의 주기를 포함하여 최대 19개의 타임프레임 데이터를 한 차트에 표시합니다. 내부 시각화 (줌): 차트 변경 없이 상위 타임프레임 캔들 내부의 가격 움직임을 확인할 수 있습니다. 시간 필터: 주요 시장 세션 등 특정 시간대에만 작동하도록 설정 가능합니다. 과거 데이터 복기 모드: 과거 데이터를 단계별로 탐색하며 지표의 작동을 분석할 수 있습니다. 알림 시스템: 캔들 마감 및 새로운 범위 감지에 대한 사용
Mirage Trading System — False Breakout (Fakey) Pattern Detector for MetaTrader 5 MANUAL   ,   MQL5 Channel Buy any indicator and get a FREE bonus indicator Phantom trading System, SMC retest Trading system, GOLD SCALP System! Send me a private message for details. Overview   Mirage Trading System detects the Fakey pattern (false breakout reversal) on completed bars and draws entry, stop loss, and take profit levels on the chart. Detection is non-repainting: signal values do not change after bar
ARIPoint
Temirlan Kdyrkhan
ARIPoint is a powerful trading companion designed to generate high-probability entry signals with dynamic TP/SL/DP levels based on volatility. Built-in performance tracking shows win/loss stats, PP1/PP2 hits, and success rates all updated live. Key Features: Buy/Sell signals with adaptive volatility bands Real-time TP/SL/DP levels based on ATR Built-in MA Filter with optional ATR/StdDev volatility Performance stats panel (Success, Profit/Loss, PP1/PP2) Alerts via popup, sound, push, or email Cu
Trend Forecaster
Alexey Minkov
5 (7)
The Trend Forecaster indicator utilizes a unique proprietary algorithm to determine entry points for a breakout trading strategy. The indicator identifies price clusters, analyzes price movement near levels, and provides a signal when the price breaks through a level. The Trend Forecaster indicator is suitable for all financial assets, including currencies (Forex), metals, stocks, indices, and cryptocurrencies. You can also adjust the indicator to work on any time frames, although it is recommen
" Dynamic Scalper System MT5 " 지표는 추세 파동 내에서 스캘핑 방식으로 거래하도록 설계되었습니다. 주요 통화쌍 및 금에서 테스트되었으며, 다른 거래 상품과의 호환성이 가능합니다. 추가적인 가격 변동 지원을 통해 추세에 따라 단기 포지션 진입 신호를 제공합니다. 지표의 원리 큰 화살표는 추세 방향을 결정합니다. 작은 화살표 형태의 스캘핑 신호를 생성하는 알고리즘은 추세 파동 내에서 작동합니다. 빨간색 화살표는 상승 방향을, 파란색 화살표는 하락 방향을 나타냅니다. 민감한 가격 변동선은 추세 방향으로 그려지며, 작은 화살표의 신호와 함께 작용합니다. 신호는 다음과 같이 작동합니다. 적절한 시점에 선이 나타나면 진입 신호가 형성되고, 선이 있는 동안 미결제 포지션을 유지하며, 완료되면 거래를 종료합니다. 권장되는 작업 시간대는 M1~H4입니다. 화살표는 현재 캔들에 형성되며, 다음 캔들이 이미 시작되었더라도 이전 캔들의 화살표는 다시 그려지지 않습니다. 입
소개       Quantum Breakout PRO   , 브레이크아웃 존 거래 방식을 변화시키는 획기적인 MQL5 지표! 13년 이상의 거래 경험을 가진 숙련된 트레이더 팀이 개발한       퀀텀 브레이크아웃 PRO       혁신적이고 역동적인 브레이크아웃 존 전략으로 거래 여정을 새로운 차원으로 끌어올리도록 설계되었습니다. Quantum Breakout Indicator는 5개의 이익 목표 영역이 있는 브레이크아웃 영역의 신호 화살표와 브레이크아웃 상자를 기반으로 한 손절 제안을 제공합니다. 초보자 거래자와 전문 거래자 모두에게 적합합니다. Quantum EA 채널:       여기를 클릭하세요 중요한! 구매 후 설치 매뉴얼을 받으려면 개인 메시지를 보내주십시오. 추천: 기간: M15 통화쌍: GBPJPY, EURJPY, USDJPY,NZDUSD, XAUUSD 계정 유형: 스프레드가 매우 낮은 ECN, Raw 또는 Razor 브로커 시간: GMT +3 중개인 :
Dark Absolute Trend MT5
Marco Solito
4.69 (13)
Dark Absolute Trend   is an Indicator for intraday trading. This Indicator is based on   Trend Following  strategy but use also candlestick patterns and Volatility. We can enter in good price with this Indicator, in order to follow the main trend on the current instrument. It is advised to use low spread ECN brokers. This Indicator does   Not repaint   and   N ot lag . Recommended timeframes are M5, M15 and H1. Recommended working pairs: All. I nstallation and  Update Guide   -  Troubleshooting
TPSproTREND PrO MT5
Roman Podpora
4.74 (19)
TPSproTrend PRO는 시장이 실제로 방향을 바꾸는 순간을 포착하여 움직임의 시작점에서 진입점을 형성합니다. 가격이 움직이기 시작할 때 시장에 진입해야 하며, 이미 가격 변동이 일어난 후에 진입해서는 안 됩니다.   (지표)       신호를 다시 그리지 않고 진입점, 손절매, 이익실현을 자동으로 표시하여 거래를 명확하고 시각적이며 체계적으로 만들어줍니다. 설명서 (러시아어)   -   MT4 버전 주요 장점 신호 재표시 없이 신호가 표시됩니다.   모든 신호는 고정되어 있습니다. 화살표가 나타나면 -       그것은 더 이상 변하거나 사라지지 않을 것입니다. 잘못된 신호의 위험 없이 안정적인 데이터를 기반으로 거래 결정을 내릴 수 있습니다. 바로 사용 가능한 매수/매도 진입점 이 지표는 거래 진입에 가장 적합한 시점을 자동으로 판단하여 차트에 화살표로 표시합니다. 추측이나 주관적인 분석이 아닌, 명확한 신호만 있습니다. 자동 손절매 및 이익실현 영역 신호 직후에 다음
제작자의 제품 더 보기
SuperTrendCCI
Volkan Mustafaoglu
The best quality application of the famous Super Trend indicator that requires no introduction. It is completely faithful to the original algorithm and powered by the CCI indicator. - easy to trade - It implements all kinds of warnings. - It implements a multi-timezone dashboard. - It cannot be repainted or backpainted. Input parameters - ATR Period – This is the average true range period. - ATR Multiplier - The ATR multiplier that defines the trend. - CCI - Makes trend following powerful. - M
TradingwievHeikenAshi
Volkan Mustafaoglu
Heikin Ashi Heikin Ashi is a charting technique that can be used to predict future price movements. It is similar to traditional candlestick charts. However, unlike a regular candlestick chart, the Heikin Ashi chart attempts to filter out some of the market noise by smoothing out strong price swings to better identify trend movements in the market. To create Heiken Ashi, a formula is used in which price data is entered, while ordinary candles are built only on bare numbers, without using any c
MovingAveragePRO
Volkan Mustafaoglu
An invention that will turn your working principles upside down. Especially in horizontal and stagnant markets, annoying losses can occur. Besides, following trend lines, support and resistance can be tiring. To put an end to all this, I decided to create a professional "moving average" indicator. All you have to do is follow the colors. If you need additional support, I recommend the "Heiken-Ashi" candle indicator in my profile. I wish you lots of profit..
OriginalSuperTrend
Volkan Mustafaoglu
Supertrend is a trend following indicator based on   the Average True Range   (ATR)   . Calculating the odd line combines trend detection and volatility. It can be used to detect changes in trend direction and position stops. Basic knowledge Supertrend is a trend following indicator. It takes up space on the main chart and its plots show the current trend. A Supertrend can be used for varying durations (daily, weekly, intraday, etc.) and varying instruments (stocks, futures or forex). Supertr
필터:
리뷰 없음
리뷰 답변