Aroon Oscillator AM

The presented indicator is the author's implementation in the oscillator format of the classic Aroon indicator.

The Aroon indicator was developed in 1995 by the Indian trader Tushar Chande.

Chand's origin played a role in choosing an unusual name for the oscillator.

"Aroon" is translated from Sanskrit as "Light of the morning dawn".

The formula for calculating the classic Aroon indicator:

  • Aroon-Up = ((specified number of periods) – (number of periods since the maximum was formed)) / (specified number of periods) * 100.
  • Aroon-Dn = ((specified number of periods) – (number of periods since the minimum was formed)) / (specified number of periods) * 100.

Thus, with a continuous upward trend, the Aroon-Up value will be 100, and Aroon-Down, respectively, 0.

With a continuous downward trend - vice versa.

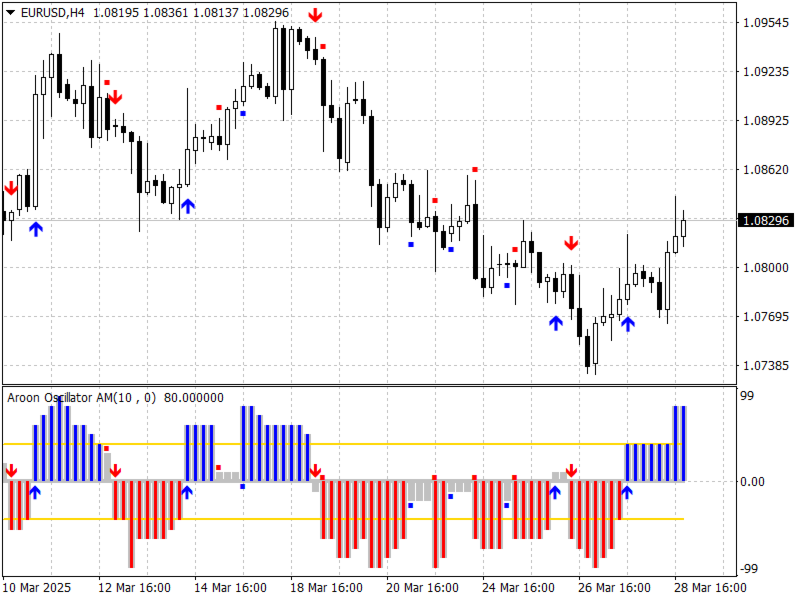
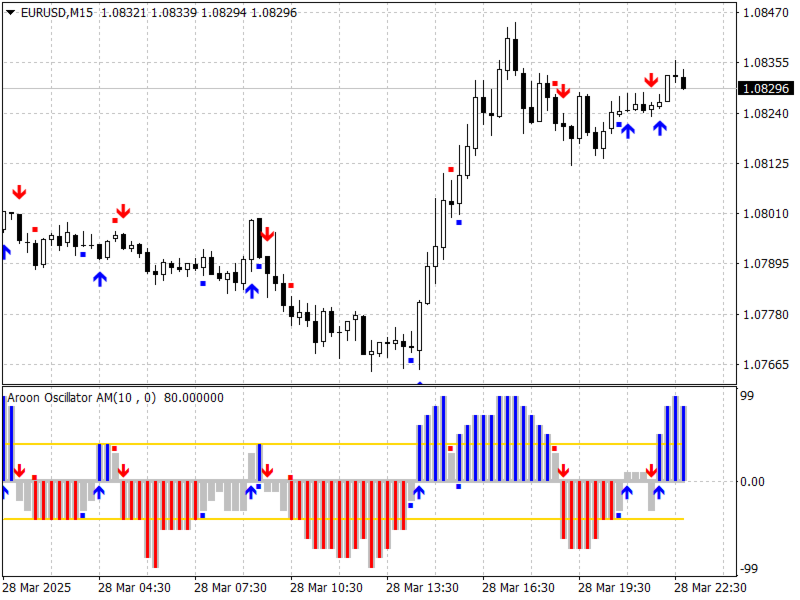
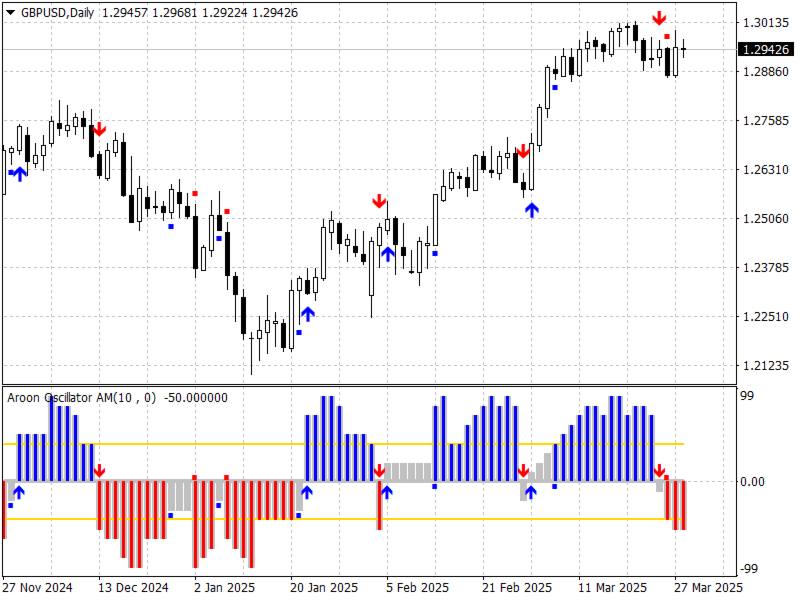
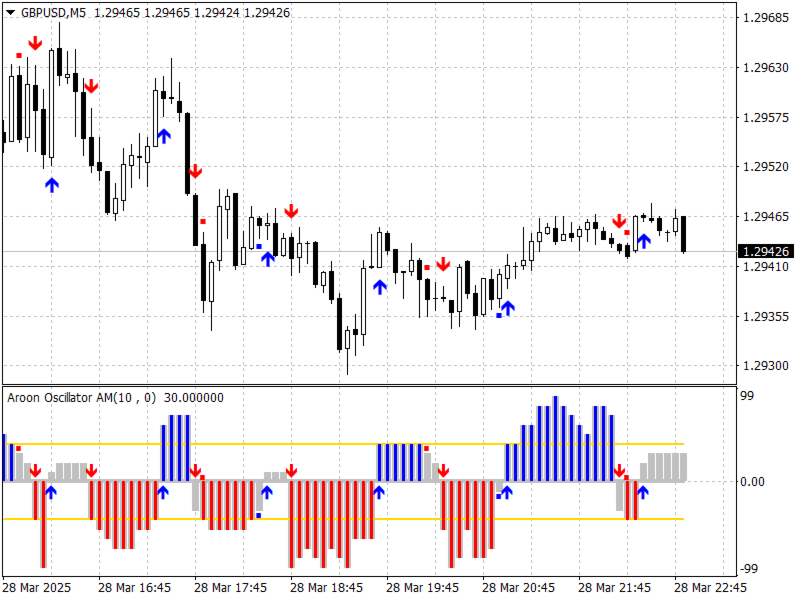
In the proposed version, the indicator is displayed as a familiar oscillator whose values ​​oscillate around zero.

This result is achieved by subtracting the Aroon-Dn values ​​from the Aroon-Up values.

The indicator allows you to select the calculation method (based on the closing price or maximum / minimum price values).

The indicator also allows you to set up a signal line to identify points of strengthening or weakening the current trend.

Thus, the indicator signals both a change in trend direction and local changes in trend strength.

Indicator signals:

  • A signal about a change in trend direction is given after the oscillator crosses its zero value;
  • A signal about strengthening / weakening the current trend is given after the oscillator crosses the signal line.

The indicator does not repaint on fully formed bars.

The indicator signals are sent after the bar on which the signal appeared has finished forming.

The signals are marked both in the oscillator window and on the price chart.

The indicator allows you to set up notifications about your signals to your mobile terminal and email.

Customizable parameters:

  • Aroon_Period - period of data for indicator calculation;
  • Aroon_Factor - a parameter that affects the sensitivity of the indicator (cannot be greater than (Aroon_Period - 2));
  • Aroon_Type - price type for indicator calculation;
  • Threshold_Value - the threshold value, when exceeded by the indicator values, signals the beginning of a trend;
  • Number_of_bars_calculated - number of bars on which the indicator will be calculated and displayed (> 300);
  • M_Signal_on_Oscillator - display of the main signal on the oscillator;
  • A_Signal_on_Oscillator - display of the additional signal on the oscillator;
  • M_Signal_on_Chart - display of the main signal on the price chart;
  • A_Signal_on_Chart - display of the additional signal on the price chart;
  • Alerts - the indicator displays a dialog box containing information about the indicator signal; 
  • Send_Notification - the indicator sends a notification to mobile terminals whose MetaQuotes ID is specified in the settings window on the "Notifications" tab; 
  • Send_Mail - the indicator sends an email to the address specified in the settings window on the "Mail" tab.

Attention:

Please note that any market is constantly changing and there is no guarantee that methods that have been effective in the past will show the same results in the future.

To minimize potential losses, you should regularly optimize the product parameters, study the results of its work and withdraw part of the profit received.

It is recommended that before using the product on a real account, you test its work on a demo account in the same market and with the same broker where you plan to trade.

With respect and best wishes,

Andriy Matviyevs'kyy


P.S.

If you liked this product, I would be grateful for a fair assessment - positive user reviews motivate the author, and reasonable criticism allows us to make products better.

I suggest visiting my page where you will find many unique author's works that are the result of many years of studying exchange trading and FOREX trading.


추천 제품
The indicator detects and displays Shark harmonic pattern (see the screenshot). The pattern is plotted by the extreme values of the ZigZag indicator (included in the resources, no need to install). After detecting the pattern, the indicator notifies of that by a pop-up window, a mobile notification and an email. The indicator highlights the process of the pattern formation and not just the complete pattern. In the former case, it is displayed in the contour triangles. After the pattern is comple
Donchian Trend Histogram
Mariusz Piotr Rodacki
Donchian channels are a tool in technical analysis used to determine the relative volatility of a market and the potential for price breakouts. Can help identify potential breakouts and reversals in price, which are the moments when traders are called on to make strategic decisions. These strategies can help you capitalize on price trends while having pre-defined entry and exit points to secure gains or limit losses. Using the Donchian channel can thus be part of a disciplined approach to managi
FREE
LE Oscillator
Svyatoslav Kucher
LE Oscillator   - индикатор предназначенный для поиска локальных экстремумов, определения текущей тенденции. В расчетах индикатора используется авторская методика. С помощью индикатора можно определять места возможного разворота цены желательно в направлении тенденции, но также с достаточной точностью и против нее. Также с помощью индикатора можно определять текущую тенденцию. Индикатор подходит для любых валютных пар, но для адекватного отображения показания необходимо, чтобы было достаточно ис
Anti Shark Harmonic Pattern Indicator MT4 The Anti Shark Harmonic Pattern indicator on MetaTrader 4 effectively detects sharp changes and price reversals in strong trending markets. This trading tool identifies potential trend reversal zones and provides a precise view of market sentiment. The Anti Shark Harmonic Pattern indicator is based on harmonic pattern principles. It draws bullish patterns in pink and bearish patterns in dark blue. «Indicator Installation & User Guide» MT4 Indicator Insta
FREE
Distinct
Ivan Simonika
Introducing the trend indicator! Ready trading system. The principle of the indicator is to automatically determine the current state of the market when placed on a chart. The indicator analyzes market dynamics for pivot points. Shows the favorable moments of entering the market in stripes. It can be used as a channel indicator or level indicator! This indicator allows you to analyze historical data, and on their basis display instructions to the trader on further actions. To find out how to det
The technical indicator is a more advanced version of the relative strength index (RSI) that applies moving average convergence-divergence (MACD) principles to a double-smoothed RSI (DS RSI) indicator. The indicator is derived by computing the difference between a double-smoothed RSI and a simple moving average (SMA) of the DS RSI. The indicator's intent is to provide more accurate buy and sell signals than the standard RSI calculation.  The MACD is derived by subtracting the 12-period exponen
FREE
Pivot Pro MT4
Samil Bozuyuk
5 (3)
Draws Daily, Weekly and Monthly pivots and the respective supports and resistances levels (S1, S2, S3, R1, R2, R3). Ideal for placing stop losses and/or using as a break-out strategy. Features Unlike other pivot indicators in market you get very clean charts. Pivot levels are plotted irrespective of timeframe, on which you trade, i.e. M1, M5, M15, M30, H1,H4 or Daily timeframes. Pivot levels do not change when you change timeframe. Fully customizable options.    If you are looking at Fibonacci
FREE
The indicator detects and displays М. Gartley's Butterfly pattern. The pattern is plotted by the extreme values of the ZigZag indicator (included in the resources, no need to install). After detecting the pattern, the indicator notifies of that by the pop-up window, a mobile notification and an email. The pattern and wave parameters are displayed on the screenshots. The default parameters are used for demonstration purposes only in order to increase the amount of detected patterns. Parameters z
Expert Advisor designed for trading Engulfing Candle Patterns within a manually input price range the D point of harmonic patterns , gartley , bat cypher butterfly ect.  This is the  full version , word test in the title is an error How Does It Work Step 1 Identify a price range around the end point D of your harmonic pattern. Input two prices into the EA settings   Inp9 Upper Level- type the highest price where an engulfing candle pattern can occur. Inp9 Lower Level - type the lowest price whe
FREE
Parabolic SAR Color Alert Indicator MT4 The Parabolic SAR Color Alert Indicator MT4 applies dynamic-colored dots to visually represent the direction of the market trend. In this indicator, the dots appear either above or beneath the candlesticks to signal momentum shifts. Specifically, blue dots below the candles highlight bullish movement, while pink dots above the candles confirm bearish momentum. «Indicator Installation & User Guide» MT4 Indicator Installation  |  Parabolic SAR Color Alert In
FREE
MACD Max
John Louis Fernando Diamante
A flexible 2-Line MACD indicator The default MACD indicator inside MT4, limits you to using the MACD with a fast-EMA, slow-EMA, and signal-SMA. This MACD indicator allows you to set your own MA-Method choices for these 3 components, separately! You can select from SMA-EMA-SMMA-LWMA-DEMA-TEMA, and can even use a separate method for each 3 fast-slow-signal periods. On-chart colored candles, with drawing condition types is included, with a show/hide button too. Features - MA Methods: SMA, EMA, SMM
Multiple Charts Object Sync
Nguyen Thanh Sang
5 (2)
Synchronize objects from one chart to multiple charts. Synchronize objects from one chart to multiple charts. 1. Allows automatic synchronization of new and edited objects to other charts. 2. Allows synchronization of all objects on the chart to other charts at the current time. 3. Allows setting the charts to synchronize based on the position of the chart in the MT4 window. Version 1.2: Allow set list of object names that you don't want to sync (Separated by commas ",") Allow set 5 types of o
FREE
Wolfe Wave Scanner MT4
Reza Aghajanpour
4.64 (11)
**  All Symbols  x  All Timeframes  scan just by pressing scanner button ** *** Contact me  to send you instruction and add you in "Wolfe Wave Scanner group" for sharing or seeing experiences with other users. Introduction: A Wolfe Wave is created with five-wave patterns in price. It shows supply and demand and a fight towards a balance price. T hese waves of price actions can help traders identify the boundaries of   the trend . Also  It helps forecast how the price will move in the near future
The indicator is designed for intraday trading. Equipped with all notification functions for convenience in manual trading. It is recommended to use timeframes m5, m15, m30. You can also view and select settings for any financial instrument. Settings: Indicator period - Indicator period Alert - The function of enabling alerts. Push notifications - Enabling Push notifications to the mobile terminal e-mail - Sending a signal to e-mail In addition to this product, I recommend looking at my othe
FREE
Overview Harmonic Patterns MT4 is a technical analysis indicator designed for the MetaTrader 5 platform. It identifies and displays harmonic price patterns, such as Butterfly, Cypher, Crab, Bat, Shark, and Gartley, in both bullish and bearish directions. The indicator calculates key price levels, including entry, stop loss, and three take-profit levels, to assist traders in analyzing market movements. Visual elements and customizable alerts enhance usability on the chart. Features Detects six ha
Schaff Trend Cycle Indicator for MetaTrader4 The Schaff Trend Cycle Indicator for MetaTrader4 merges the core functionalities of two widely used indicators—MACD (Moving Average Convergence Divergence) and the Stochastic Oscillator. This tool is engineered to identify trend reversals and momentum extremes with enhanced sensitivity. Readings below 25 often signal an oversold market, while values above 75 highlight overbought conditions. This makes the STC highly reliable for early trend recognitio
FREE
RaysFX Stochastic
Davide Rappa
5 (1)
RaysFX Stochastic  L'indicatore RaysFX Stochastic è un indicatore personalizzato per la piattaforma MetaTrader 4. Caratteristiche principali: -Indicatori separati: L'indicatore viene visualizzato in una finestra separata sotto il grafico principale. -Livelli dell'indicatore: L'indicatore ha due livelli predefiniti, 20 e 80, che possono essere utilizzati come livelli di ipervenduto e ipercomprato. -Buffer dell'indicatore: L'indicatore utilizza quattro buffer per calcolare e memorizzare i suoi
FREE
TrendInChannel
Andriy Sydoruk
This indicator is the undisputed leader among the indicators. And for this statement there is a good reason. The indicator builds a very high quality channel in which it generates signals to enter! What is the ideal strategy for the trader, since the trader always hesitates when choosing a strategy for the job. That is, this indicator will allow you to solve the dilemma of choosing a job by trend or to the channel, since it combines these two basic concepts. Working with the indicator is very
Wise Men Indicator demo
Bohdan Kasyanenko
3 (2)
The indicator displays signals according to the strategy of Bill Williams on the chart. Demo version of the indicator has the same features as the paid, except that it can work only on a demo account . Signal "First Wise Man" is formed when there is a divergent bar with angulation.  Bullish divergent bar - with lower minimum and closing price in the upper half. Bearish divergent bar - higher maximum and the closing price at the bottom half. Angulation is formed when all three lines of Alligator
FREE
MACD divergence Simple edition 原始MACD计算方式,升级为双线MACD,使判断更加直观更加贴合大宗交易平台的研究习惯,同时还会自动用实线标出背离,不用再从0开始苦学钻研。 同时,我还提供了提醒服务,在你忙于家务无暇顾及的时候只需要打开音响,一旦达成背离,第一时间就会让你知晓。 这是一款简单版的看背离指标,MACD的九天均线被称为“信号线”,然后绘制在MACD线的顶部,它可以作为买入和卖出信号的触发器。当MACD越过信号线时,交易员可以买入操作,当MACD穿过信号线以下时,交易者可以卖出或做空操作。移动平均收敛-发散(MACD)指标可以用几种方法解释,但更常见的方法是交叉、散度和快速上升/下降。
FREE
History Pattern Search
Yevhenii Levchenko
표시기는 현재 시세를 작성하여 과거 시세와 비교할 수 있으며 이를 바탕으로 가격 변동을 예측합니다. 표시기에는 원하는 날짜로 빠르게 이동할 수 있는 텍스트 필드가 있습니다. 옵션: 기호 - 표시기가 표시할 기호 선택. SymbolPeriod - 지표가 데이터를 가져올 기간 선택. IndicatorColor - 표시기 색상. HorisontalShift - 지시자가 그린 따옴표를 지정된 막대 수만큼 이동합니다. Inverse - true는 인용 부호를 반대로, false - 원래 보기를 반전합니다. ChartVerticalShiftStep - 차트를 수직으로 이동합니다(키보드의 위/아래 화살표). 다음은 날짜를 입력할 수 있는 텍스트 필드의 설정으로, '엔터'를 누르면 즉시 이동할 수 있습니다.
PZ The Zone
PZ TRADING SLU
4.33 (3)
This indicator displays buy or sell signals according to Bill Williams' definition of the Trading Zone. [ Installation Guide | Update Guide | Troubleshooting | FAQ | All Products ] Easy to use and understand Avoid trading flat markets Deterministic indicator with clear rules The indicator is non-repainting It implements alerts of all kinds It has straightforward trading implications. A blue arrow is a buy signal A red arrow is a sell signal According to Bill Williams trading in the zone helps to
FREE
Anti Crab Harmonic Pattern Indicator for MT4 The Anti-Crab Harmonic Pattern Indicator is a technical analysis tool developed for MetaTrader 4 that identifies potential price reversal points using specific Fibonacci ratios such as 0.618, 1.27, and 2.27. This indicator automatically draws anti-crab patterns on the chart, highlighting bullish patterns in red and bearish patterns in blue. «Indicator Installation & User Guide» MT4 Indicator Installation  | Anti Crab Harmonic Pattern Indicator MT5 | A
FREE
MACD divergence indicator finds divergences between price chart and MACD indicator and informs you with alerts (popup, mobile notification or email). Its main use is to find trend reversals in the chart. Always use the divergence indicators with other technical assets like support resistance zones, candlestick patterns and price action to have a higher possibility to find trend reversals. Three confirmation type for MACD divergences: MACD line cross zero level Price returns to previous H/L Creat
FREE
Auto Fibo Retracement MT4
Nguyen Tuan Son
3.67 (3)
Auto Fibonacci Retracement Indicator — Flexible and Reliable This is not just another Auto Fibonacci Retracement indicator — it’s one of the most flexible and dependable tools available . If you find it useful, please leave a review or comment to support the project. Check out my other helpful tools below: Timeframes Trend Scanner    - Scan the trend of assets in difference timeframes with multiple indicators Market Trend Scanner   - Scan the trend of multiple-assets in with multiple indicators
FREE
Day Pattern
Oleksandr Martsynyshen
Description: - D ay Pattern - an indicator that helps to identify patterns of price changes for the development of trading algorithms and strategies. For whom this tool? - For developers of trading strategies and algorithms. - Medium- and long-term traders. Time frames H1-W1. Features of the indicator: - There is a function of exporting indicator values to a file of the csv format. - Using the information panel, you can conduct an express analysis of trading tool. - The indicator is sui
Alternate Shark Harmonic Pattern Indicator MT4 The Alternate Shark Harmonic Pattern Indicator is a tool designed for detecting trend reversal points on the MetaTrader 4 platform. This pattern falls under the harmonic category in technical analysis. As a refined version of the classic shark, the alternate shark pattern features adjusted Fibonacci ratios and optimized price structures, allowing for improved accuracy in identifying potential reversals. In most cases, once this pattern completes on
FREE
RSI divergence indicator is a multi-timeframe and multi-symbol indicator that help us find divergences between price chart and RSI indicator. Always use the divergence indicators with other technical assets like support resistance zones, candlestick patterns and price action to have a higher possibility to find trend reversals. This indicator will identify the peaks and troughs of both price and the RSI indicator. You can adjust the parameters to adjust the strength and weakness of these peaks a
FREE
PREVIOUS INDICATOR’S DATA MA CROSSOVER https://www.mql5.com/en/users/earobotkk/seller#products P/S: If you like this indicator, please rate it with 5 stars in the review section, this will increase its popularity so that other users will be benefited from using it. This indicator notifies and draws an arrow on the chart whenever    the MA line has crossed over its previous indicator’s data MA filtered by MA Trend.   It also displays total pips gained from all the entry set-ups. Setting ·   You c
FREE
RelicusRoad MACD v2
Relicus LLC
4.6 (5)
이동 평균 수렴 발산(MACD) 거래 전략은 추세와 흐름 방향의 변화를 식별하는 데 사용되는 인기 있는 기술 분석 도구입니다. MACD는 12기간의 지수 이동 평균(EMA)에서 26기간의 EMA를 빼서 계산됩니다. "신호 선"이라고 불리는 9기간의 EMA는 MACD 위에 표시되어 매수 및 매도 신호를 트리거로 작용합니다. MACD 선이 신호 선 위에 있으면 매수 트렌드로 간주되고, 신호 선 아래에 있으면 매도 트렌드로 간주됩니다. 거래자들은 종종 이 정보를 사용하여 잠재적인 매수 및 매도 기회를 파악합니다. MACD는 다양한 방식으로 사용될 수 있는 다재다능한 지표입니다. 일반적으로 사용되는 몇 가지 방법은 다음과 같습니다. 교차: MACD 선이 신호 선 위로 크로스되면 매수 교차가 발생하고, MACD 선이 신호 선 아래로 크로스되면 매도 교차가 발생합니다. 발산: MACD가 새로운 고점을 형성하면서 기초 자산이 그렇지 않은 경우 매수 발산이 발생하고, MACD가 새로운 저점을 형성
FREE
이 제품의 구매자들이 또한 구매함
Trend indicator AI
Ramil Minniakhmetov
5 (58)
트렌드 인공 지능 지표는 실행 가능한 진입 점 및 반전 경고와 추세 식별을 결합하여 상인의 시장 분석을 향상시킬 훌륭한 도구입니다. 이 표시기는 사용자가 자신감과 정밀도로 외환 시장의 복잡성을 탐색 할 수 있도록 지원합니다 기본 신호 외에도 트렌드 인공 지능 지표는 풀백 또는 되돌림 중에 발생하는 2 차 진입 점을 식별하여 거래자가 기존 트렌드 내에서 가격 수정을 활용할 수 있도록합니다. 중요한 장점: ·작동 4 및 5 *명확한 구매 또는 판매 신호 *다시 칠하지 않습니다 *모든 자산에서 작동 나는 전보 사기에 개 또는 세트를 판매하지 않도록주의. 모든 설정은 블로그에 여기에 무료.  중요! 지침 및 보너스를 얻기 위해 구입 후 즉시 저에게 연락! 진짜 가동 감시는 뿐 아니라 나의 다른 제품 여기에서 찾아낼 수 있습니다: https://www.mql5.com/en/users/mechanic/seller&nbsp ; 설정 및 입력: 모든 자산에 대해 기본 설정을 권
M1 Sniper
Oleg Rodin
4.73 (15)
M1 SNIPER 는 사용하기 쉬운 거래 지표 시스템입니다. M1 시간대에 맞춰 설계된 화살표 지표입니다. 이 지표는 M1 시간대 스캘핑을 위한 단독 시스템으로 사용할 수 있으며, 기존 거래 시스템의 일부로도 사용할 수 있습니다. 이 거래 시스템은 M1 시간대 거래용으로 특별히 설계되었지만, 다른 시간대에도 사용할 수 있습니다. 원래는 XAUUSD와 BTCUSD 거래를 위해 이 방법을 설계했지만, 다른 시장 거래에도 유용하다는 것을 알게 되었습니다. 이 지표의 신호는 추세 방향과 반대로 거래될 수 있습니다. 저는 지표의 신호를 활용하여 양방향으로 거래할 수 있도록 돕는 특별한 거래 기법을 알려드립니다. 이 방법은 특별한 동적 지지선과 저항선 가격 영역을 활용하는 것을 기반으로 합니다. 구매하시면 M1 SNIPER 화살표 지표를 바로 다운로드하실 수 있습니다. 또한, 아래 스크린샷에 표시된 Apollo Dynamic SR 지표는 M1 SNIPER 도구를 사용하는 모든 사용자에게 무료로
Scalper Inside PRO
Alexey Minkov
4.7 (69)
An exclusive indicator that utilizes an innovative algorithm to swiftly and accurately determine the market trend. The indicator automatically calculates opening, closing, and profit levels, providing detailed trading statistics. With these features, you can choose the most appropriate trading instrument for the current market conditions. Additionally, you can easily integrate your own arrow indicators into Scalper Inside Pro to quickly evaluate their statistics and profitability. Scalper Inside
SMC Easy Signal
Mohamed Hassan
5 (11)
To celebrate the official release, $65 is the new PROMO price for the first 50 copies (3 left)! After that, the price increases to $120. SMC Easy Signal was built to remove the confusion around the smart money concept by turning structural shifts like BOS (Break of Structure) and CHoCH (Change of Character) into simple buy and sell trading signals. It simplifies market structure trading by automatically identifying breakouts and reversals as they happen, allowing traders to focus on execution
Gann Made Easy
Oleg Rodin
4.81 (140)
Gann Made Easy 는 mr.의 이론을 사용하여 최고의 거래 원칙을 기반으로 하는 전문적이고 사용하기 쉬운 Forex 거래 시스템입니다. W.D. 간. 이 표시기는 Stop Loss 및 Take Profit Levels를 포함하여 정확한 BUY 및 SELL 신호를 제공합니다. PUSH 알림을 사용하여 이동 중에도 거래할 수 있습니다. 구매 후 연락주세요! 내 거래 팁과 훌륭한 보너스 지표를 무료로 공유하겠습니다! 아마도 Gann 거래 방법에 대해 이미 여러 번 들었을 것입니다. 일반적으로 Gann의 이론은 초보자 거래자뿐만 아니라 이미 거래 경험이 있는 사람들에게도 매우 복잡한 것입니다. Gann의 거래 방식은 이론적으로 적용하기 쉽지 않기 때문입니다. 나는 그 지식을 연마하고 Forex 지표에 최고의 원칙을 적용하기 위해 몇 년을 보냈습니다. 표시기는 적용하기가 매우 쉽습니다. 차트에 첨부하고 간단한 거래 권장 사항을 따르기만 하면 됩니다. 지표는 지속적으로 시장 분석 작업
GOLD Impulse with Alert
Bernhard Schweigert
4.64 (11)
이 지표는 Advanced Currency IMPULSE with ALERT  +   Currency Strength Exotics  의 2가지 제품의 슈퍼 조합입니다. 그것은 모든 시간 프레임에 대해 작동하며 8개의 주요 통화와 하나의 기호에 대한 강약의 충동을 그래픽으로 보여줍니다! 이 표시기는 금, 이국적인 쌍, 상품, 지수 또는 선물과 같은 기호에 대한 통화 강도 가속을 표시하는 데 특화되어 있습니다. 금, 은, 오일, DAX, US30, MXN, TRY, CNH 등의 진정한 통화 강도 가속(충동 또는 속도)을 표시하기 위해 9번째 줄에 모든 기호를 추가할 수 있습니다. 새로운 기본 알고리즘을 기반으로 구축되어 잠재적인 거래를 훨씬 더 쉽게 식별하고 확인할 수 있습니다. 이는 통화의 강세 또는 약세가 가속되는지 여부를 그래픽으로 표시하고 가속 속도를 측정하기 때문입니다. 자동차의 속도계처럼 생각하면 됩니다. 가속화할 때 Forex 시장에서 동일한 일이 분명히 더 빠르
Advanced Supply Demand
Bernhard Schweigert
4.91 (296)
현재 33% 할인! 초보자나 전문 트레이더를 위한 최고의 솔루션! 이 보조지표는 우리가 다수의 독창적 기능과 새로운 공식을 통합한 독특하고 고품질이며 저렴한 거래 도구입니다. 이 업데이트를 통해 이중 시간대를 표시할 수 있습니다. 더 높은 TF를 표시할 수 있을 뿐만 아니라 차트 TF와 더 높은 TF 모두를 표시할 수 있습니다: 중첩 영역 표시. 모든 Supply Demand 트레이더들이 좋아할 것입니다. :) 중요한 정보 공개 Advanced Supply Demand의 잠재력을 극대화하려면 다음을 방문하십시오. https://www.mql5.com/ko/blogs/post/720245   진입 또는 목표의 명확한 트리거 포인트를 정확히 찾아냄으로 해서 거래가 어떻게 개선될지 상상해 보십시오. 새로운 알고리즘을 기반으로 매수자와 매도자 간의 잠재적인 불균형을 훨씬 더 쉽게 분간할 수 있습니다. 왜냐하면 가장 강한 공급영역과 가장 강한 수요 영역과 과거에 어떻게 진행 되었는지를(이전
Dynamic Forex28 Navigator
Bernhard Schweigert
5 (6)
Dynamic Forex28 Navigator - 차세대 외환 거래 도구. 현재 49% 할인. Dynamic Forex28 Navigator는 오랫동안 인기 있는 지표의 진화형으로, 세 가지의 힘을 하나로 결합했습니다. 고급 통화 Strength28 지표(695개 리뷰) + 고급 통화 IMPULSE with ALERT(520개 리뷰) + CS28 콤보 신호(보너스). 지표에 대한 자세한 정보 https://www.mql5.com/en/blogs/post/758844 차세대 Strength 지표는 무엇을 제공합니까?  원래 지표에서 좋아했던 모든 것이 새로운 기능과 더 높은 정확도로 강화되었습니다. 주요 기능: 독점적인 통화 Strength 공식.  모든 시간대에 걸쳐 부드럽고 정확한 강도선. 추세와 정확한 진입을 식별하는 데 이상적입니다. 역동적인 시장 피보나치 수준(시장 피보나치).  이 지표에만 있는 고유한 기능. 가격 차트가 아닌 통화 강도에 피보나치가 적용됩니다.
현재 20% 할인 ! 초보자 또는 전문가 트레이더를 위한 최고의 솔루션! 이 대시보드 소프트웨어는 28개의 통화 쌍에서 작동합니다. 2가지 주요 지표(Advanced Currency Strength 28 및 Advanced Currency Impulse)를 기반으로 합니다. 전체 Forex 시장에 대한 훌륭한 개요를 제공합니다. 고급 통화 강도 값, 통화 이동 속도 및 모든(9) 시간대의 28 Forex 쌍에 대한 신호를 보여줍니다. 추세 및/또는 스캘핑 기회를 정확히 파악하기 위해 차트의 단일 지표를 사용하여 전체 시장을 볼 수 있을 때 거래가 어떻게 개선될지 상상해 보십시오! 잠재적인 거래를 식별하고 확인하면서 강력한 통화와 약한 통화를 더욱 쉽게 식별할 수 있도록 이 지표에 기능을 내장했습니다. 이 표시기는 통화의 강세 또는 약세가 증가 또는 감소하는지 여부와 모든 시간대에서 수행되는 방식을 그래픽으로 보여줍니다. 추가된 새로운 기능은 현재 시장 조건 변화에 적응하는
Day Trader Master
Oleg Rodin
5 (14)
Day Trader Master 는 데이 트레이더를 위한 완벽한 거래 시스템입니다. 시스템은 두 개의 지표로 구성됩니다. 하나의 지표는 매수 및 매도를 위한 화살표 신호입니다. 얻을 수 있는 화살표 표시기입니다. 2차 지표를 무료로 드립니다. 두 번째 지표는 이러한 화살표와 함께 사용하도록 특별히 설계된 추세 지표입니다. 표시기는 반복하지 않고 늦지 않습니다! 이 시스템을 사용하는 것은 매우 간단합니다. 2색 선으로 표시되는 현재 추세 방향의 화살표 신호를 따라가기만 하면 됩니다. 파란색은 구매 추세입니다. 빨간색은 판매 추세입니다. 파란색 화살표는 매수 신호입니다. 빨간색 화살표는 매도 신호입니다. 추세선의 색상과 일치하려면 화살표의 색상과 신호의 방향이 필요합니다. 화살표 표시기는 주로 시간 간격 M5 및 M15에서 일중 거래를 위해 만들어졌습니다. 그러나 기술적으로 시스템은 다른 시간 간격으로 사용할 수 있습니다. 표시기에는 PUSH 메시지 기능이 있는 팝업 경고가 장착되어 있
Italo Arrows Indicator
Italo Santana Gomes
5 (2)
BUY INDICATOR AND GET NEW EXCLUSIVE EA FOR FREE AS A BONUS! ITALO ARROWS INDICATOR  is the best reversal indicator ever created, and why is that? Using extreme reversal zones on the market to show the arrows and Fibonacci numbers for the Take Profit, also with a panel showing all the information about the signals on the chart, the Indicator works on all time-frames and assets, indicator built after 8 years of experience on forex and many other markets. You know many reversal indicators around t
Currency Strength Exotics
Bernhard Schweigert
4.88 (33)
현재 20% 할인! 초보자 또는 전문가 트레이더를 위한 최고의 솔루션! 이 표시기는 Exotic Pairs Commodities, Indexes 또는 Futures와 같은 기호에 대한 통화 강도를 표시하는 데 특화되어 있습니다. 금, 은, 석유, DAX, US30, MXN, TRY, CNH 등의 진정한 통화 강도를 보여주기 위해 9번째 줄에 모든 기호를 추가할 수 있습니다. 이것은 독특하고 고품질이며 저렴한 거래 도구입니다. 우리는 많은 독점 기능과 새로운 공식을 통합했습니다. 새로운 추세 또는 스캘핑 기회의 정확한 트리거 포인트를 정확히 찾아낼 수 있기 때문에 거래가 어떻게 개선될지 상상해 보십시오. 사용 설명서: 여기를 클릭 https://www.mql5.com/en/blogs/post/708876 모든 시간대에 작동합니다. TREND를 빠르게 확인할 수 있습니다! 새로운 기본 알고리즘을 기반으로 설계되어 잠재적인 거래를 더욱 쉽게 식별하고 확인할 수 있습니다. 8개의
Gold Stuff
Vasiliy Strukov
4.85 (263)
Gold Stuff는 금을 위해 특별히 설계된 추세 지표이며 모든 금융 상품에서도 사용할 수 있습니다. 표시기가 다시 그려지지 않고 지연되지 않습니다. 권장 기간 H1. 표시기에서 완전 자동 Expert Advisor EA Gold Stuff를 작동합니다. 내 프로필에서 찾을 수 있습니다. 설정 및 개인 보너스를 받으려면 구매 후 즉시 저에게 연락하십시오!   강력한 지원 및 트렌드 스캐너 표시기의 무료 사본을 받으실 수 있습니다. 메시지를 보내주세요. 나!   설정 화살표 그리기 - 켜기 끄기. 차트에 화살표 그리기. 경고 - 가청 경고를 끕니다. 이메일 알림 - 켜기 끄기. 이메일 알림. Puch-notification - 켜기 끄기. 푸시 알림. 다음으로 색 영역을 조정합니다. Gold Stuff는 금을 위해 특별히 설계된 추세 지표이며 모든 금융 상품에서도 사용할 수 있습니다. 표시기가 다시 그려지지 않고 지연되지 않습니다. 권장 기간 H1. 표시기에서 완전 자동
Trend Screener
STE S.S.COMPANY
4.79 (95)
트렌드 표시기, 트렌드 트레이딩 및 필터링을 위한 획기적인 고유 솔루션, 하나의 도구 안에 내장된 모든 중요한 트렌드 기능! Forex, 상품, 암호 화폐, 지수 및 주식과 같은 모든 기호/도구에 사용할 수 있는 100% 다시 칠하지 않는 다중 시간 프레임 및 다중 통화 표시기입니다. 기간 한정 특가: 지원 및 저항 스크리너 지표는 단 100달러에 평생 제공됩니다. (원래 가격 50 달러) (제안 연장) Trend Screener는 차트에 점이 있는 화살표 추세 신호를 제공하는 효율적인 지표 추세 추종 지표입니다. 추세 분석기 표시기에서 사용할 수 있는 기능: 1. 트렌드 스캐너. 2. 최대 이익 분석이 있는 추세선. 3. 추세 통화 강도 측정기. 4. 경고가 있는 추세 반전 점. 5. 경고가 있는 강력한 추세 점. 6. 추세 화살표 Trend Screener Indicator가 있는 일일 분석 예, 일일 신호 성능...등은 여기에서 찾을 수 있습니다.   여기를 클릭하십시오. L
FX Power MT4 NG
Daniel Stein
4.95 (19)
FX Power: 통화 강세 분석으로 더 스마트한 거래 결정을 개요 FX Power 는 어떤 시장 상황에서도 주요 통화와 금의 실제 강세를 이해하기 위한 필수 도구입니다. 강한 통화를 매수하고 약한 통화를 매도함으로써 FX Power 는 거래 결정을 단순화하고 높은 확률의 기회를 발견합니다. 트렌드를 따르거나 극단적인 델타 값을 사용해 반전을 예측하고자 한다면, 이 도구는 귀하의 거래 스타일에 완벽히 적응합니다. 단순히 거래하지 말고, FX Power 로 더 스마트하게 거래하세요. 1. FX Power가 거래자에게 매우 유용한 이유 통화와 금의 실시간 강세 분석 • FX Power 는 주요 통화와 금의 상대적 강세를 계산하고 표시하여 시장 역학에 대한 명확한 통찰력을 제공합니다. • 어떤 자산이 앞서고 있고 어떤 자산이 뒤처지는지 모니터링하여 보다 현명한 거래 결정을 내릴 수 있습니다. 포괄적인 멀티 타임프레임 뷰 • 단기, 중기 및 장기 타임프레임에서 통화와 금의 강세를
Currency Strength Wizard
Oleg Rodin
4.84 (55)
통화 강도 마법사는 성공적인 거래를 위한 올인원 솔루션을 제공하는 매우 강력한 지표입니다. 표시기는 여러 시간 프레임의 모든 통화 데이터를 사용하여 이 또는 해당 외환 쌍의 힘을 계산합니다. 이 데이터는 특정 통화의 힘을 확인하는 데 사용할 수 있는 사용하기 쉬운 통화 지수 및 통화 전력선의 형태로 표시됩니다. 필요한 것은 거래하려는 차트에 표시기를 부착하는 것뿐입니다. 표시기는 거래하는 통화의 실제 강세를 보여줍니다. 지표는 또한 추세와 거래할 때 유리하게 사용할 수 있는 구매 및 판매 거래량 압력의 극한값을 보여줍니다. 지표는 또한 피보나치에 기반한 가능한 대상을 보여줍니다. 표시기는 PUSH 알림을 포함한 모든 유형의 알림을 제공합니다. 구매 후 연락주세요. 나는 당신과 거래 팁을 공유하고 당신에게 무료로 훌륭한 보너스 지표를 줄 것입니다! 나는 당신에게 행복하고 유익한 거래를 기원합니다!
M1 Arrow
Oleg Rodin
5 (19)
시장의 두 가지 기본 원칙에 기반한 일중 전략. 알고리즘은 추가 필터를 사용하여 거래량 및 가격 파동 분석을 기반으로 합니다. 지표의 지능형 알고리즘은 두 가지 시장 요인이 하나로 결합될 때만 신호를 제공합니다. 지표는 더 높은 시간 프레임의 데이터를 사용하여 M1 차트에서 특정 범위의 파도를 계산합니다. 그리고 파동을 확인하기 위해 지표는 볼륨 분석을 사용합니다. 이 표시기는 준비된 거래 시스템입니다. 트레이더가 필요로 하는 모든 것은 신호를 따르는 것입니다. 또한 지표는 자신의 거래 시스템의 기초가 될 수 있습니다. 거래는 분 차트에서만 수행됩니다. 지표가 MTF 원리를 사용한다는 사실에도 불구하고 지표 알고리즘은 가능한 한 안정적입니다. 구매 후 반드시 저에게 편지를 보내주세요! 내 거래 설정 및 권장 사항을 공유하겠습니다!
Support Resistance screnner
STE S.S.COMPANY
4.95 (37)
Support And Resistance Screener는 하나의 지표 안에 여러 도구를 제공하는 MetaTrader에 대한 하나의 레벨 지표입니다. 사용 가능한 도구는 다음과 같습니다. 1. 시장 구조 스크리너. 2. 완고한 후퇴 영역. 3. 약세 후퇴 영역. 4. 일일 피벗 포인트 5. 주간 피벗 포인트 6. 월간 피벗 포인트 7. 고조파 패턴과 볼륨에 기반한 강력한 지지와 저항. 8. 은행 수준 구역. LIMITED TIME OFFER : HV 지원 및 저항 표시기는 50 $ 및 평생 동안만 사용할 수 있습니다. ( 원래 가격 125$ ) 메타트레이더 백테스터 제한 없이 인디케이터를 사용하시겠습니까? 데모 버전을 다운로드하려면 여기를 클릭하십시오. 주요 특징들 고조파 및 볼륨 알고리즘을 기반으로 하는 강력한 지원 및 저항 영역. Harmonic 및 Volume 알고리즘을 기반으로 한 강세 및 약세 풀백 영역. 시장 구조 스크리너 일간, 주간 및 월간 피벗 포인트. 문서 모
Entry Points Pro
Yury Orlov
4.61 (170)
다시 색을 칠하지 않고 거래에 진입할 수 있는 정확한 신호를 제공하는 MT4용 지표입니다. 외환, 암호화폐, 금속, 주식, 지수 등 모든 금융 자산에 적용할 수 있습니다. 매우 정확한 추정값을 제공하고 매수와 매도의 가장 좋은 시점을 알려줍니다. 하나의 시그널로 수익을 내는 지표의 예와 함께 비디오 (6:22)시청하십시오! 대부분의 거래자는 Entry Points Pro 지표의 도움으로 첫 거래 주 동안 트레이딩 결과를 개선합니다. 저희의   Telegram Group 을 구독하세요! Entry Points Pro 지표의 좋은점. 재도색이 없는 진입 신호 신호가 나타나고 확인되면(시그널 캔들이 완성된 경우) 신호는 더 이상 사라지지 않습니다. 여타 보조지표의 경우 신호를 표시한 다음 제거되기 때문에 큰 재정적 손실로 이어집니다. 오류 없는 거래 게시 알고리즘을 통해 트레이드(진입 또는 청산)를 할 이상적인 순간을 찾을 수 있으며, 이를 통해 이를 사용하는 모든 거래자의 성공률이
Gold Channel XAUUSD
Paulo Rocha
5 (4)
Gold Channel is a volatility-based indicator, developed with a specific timing algorithm for the XAUUSD pair, which consists of finding possible corrections in the market. This indicator shows two outer lines, an inner line (retracement line) and an arrow sign, where the theory of the channel is to help identify overbought and oversold conditions in the market. The market price will generally fall between the boundaries of the channel. If prices touch or move outside the channel it is a tradi
AW Trend Predictor
AW Trading Software Limited
4.62 (34)
하나의 시스템에서 추세와 고장 수준의 조합입니다. 고급 지표 알고리즘은 시장 노이즈를 필터링하고 추세, 진입점 및 가능한 출구 수준을 결정합니다. 표시기 신호는 통계 모듈에 기록되어 가장 적합한 도구를 선택하여 신호 기록의 효율성을 보여줍니다. 이 표시기는 이익 실현 및 손절매 표시를 계산합니다. 매뉴얼 및 설명 ->   여기   / MT5 버전 ->   여기 지표로 거래하는 방법: Trend Predictor로 거래하는 것은 3단계로 간단합니다. 1단계 - 포지션 열기 70% 이상의 성공률로 매수 신호를 받았습니다. 2단계 - StopLoss 결정 반대 신호로 트렁크 선택 3단계 - 이익 실현 전략 정의 전략 1: TP1 도달 시 전체 포지션 청산 전략 2: TP1 도달 시 포지션의 50% 청산 및 TP2 도달 시 나머지 50% 청산 전략 3: 추세 반전 시 전체 포지션 청산 이익: 결과를 다시 그리지 않음, 신호는 엄격하게 양초가 닫힐 때 어드바이저에서 사용할 수 있습니다. 이
The Super Arrow Indicator provides non-repainting buy and sell signals with exceptional accuracy. Key Features No repainting – confirmed signals remain fixed Clear visual arrows: green for buy, red for sell Real-time alerts via pop-up, sound, and optional email Clean chart view with no unnecessary clutter Works on all markets: Forex, gold, oil, indices, crypto Adjustable Parameters TimeFrame Default: "current time frame" Function: Sets the time frame for indicator calculation Options: Can be set
Hydra Trend Rider
INTRAQUOTES
5 (4)
Hydra Trend Rider is a non-repainting, multi-timeframe trend indicator that delivers precise buy/sell signals and real-time alerts for high-probability trade setups. With its color-coded trend line, customizable dashboard, and mobile notifications, it's perfect for traders seeking clarity, confidence, and consistency in trend trading. Download the Metatrader 5 Version Read the User Manual here. HURRY!  Price  increasing soon! Read the product description carefully before purchasing the product. 
Note : The slow loading of the indicator issue has been addressed . This new version loads fast and does not slow the platform. Version 1.3 : We have updated the indicator to include an historical bar scanning option . So instead of scanning all bars in the history (which can make the indicator slow sometimes ) , you can select the maximum number of bars it can scan which can increase the performance and make the indicator faster. This indicator scans the 1-3 Trendline pattern . The indicato
"The Squeeze indicator attempts to identify periods of consolidation in a market. In general the market is either in a period of quiet consolidation or vertical price discovery. By identifying these calm periods, we have a better opportunity of getting into trades with the potential for larger moves. Once a market enters into a "squeeze," we watch the overall market momentum to help forecast the market direction and await a release of market energy." Modified TTM Squeeze Indicator is a modifica
Gann Square of 9
Olga Borovskaia
5 (1)
The only one of its kind square 9 indicator that corresponds to the real situation on Gannzilla! The indicator calculates price levels by Square 9 and dates by Square 9.  All price and time levels are 100% consistent with the location on Square 9 (Gannzila). This tool will be a great solution for determining the price and time levels using the methods of the legendary trader William Delbert Gann.
Dark Support Resistance  is an Indicator for intraday trading. This Indicator is programmed to identify  Support and Resistance Lines , providing a high level of accuracy and reliability. Key benefits Easily visible lines Only the most important levels will be displayed Automated adjustment for each timeframe and instrument Easy to use even for beginners Never repaints, never backpaints, Not Lag 100% compatible with Expert Advisor development All types of alerts available: Pop-up, Email, Push
RelicusRoad Pro
Relicus LLC
4.63 (106)
훌륭한 백테스트 , 환상적인 숫자로 증명된 실계좌 성능 , 그리고 온갖 통계 를 가진 트레이딩 지표를 얼마나 많이 구매했지만, 사용 후에 결국 계좌를 날려버린 적이 있나요? 신호 자체만으로는 신뢰할 수 없습니다. 애초에 그 신호가 왜 나타났는지 알아야 하며, 이것이 바로 RelicusRoad Pro가 가장 잘하는 일입니다! 사용자 설명서 + 전략 + 교육 비디오 + VIP 접근 권한이 있는 비공개 그룹 + 모바일 버전 사용 가능 시장을 바라보는 새로운 방법 RelicusRoad는 외환, 선물, 암호화폐, 주식 및 지수를 위한 세계에서 가장 강력하고 최고의 트레이딩 지표 이며, 트레이더가 계좌를 성장 시키는 데 필요한 모든 정보와 도구를 제공합니다. 저희는 초보자 부터 고급 트레이더까지 모든 트레이더가 성공 할 수 있도록 기술적 분석 과 트레이딩 계획 을 제공합니다. 이것은 미래 시장을 예측 하기에 충분한 정보를 제공하는 핵심 트레이딩 지표 입니다. 저희는 차트에 여러 다른 지표
Apollo Secret Trend
Oleg Rodin
5 (6)
Apollo Secret Trend는 모든 쌍과 시간대의 추세를 찾는 데 사용할 수 있는 전문적인 추세 지표입니다. 지표는 거래를 선호하는 쌍이나 기간에 관계없이 시장 동향을 감지하는 데 사용할 수 있는 주요 거래 지표가 될 수 있습니다. 표시기의 특수 매개변수를 사용하여 개인 거래 스타일에 맞게 신호를 조정할 수 있습니다. 표시기는 PUSH 알림을 포함한 모든 유형의 경고를 제공합니다. 표시기의 신호는 다시 칠하지 마십시오! 제공된 스크린샷에서 과매수/과매도 오실레이터 표시기와 함께 Apollo Secret Trend 표시기를 볼 수 있습니다. 이 표시기는 제가 절대적으로 무료로 제공합니다. 구매 후 두 번째 과매수 및 과매도 오실레이터 표시기를 무료로 받으려면 저에게 연락하십시오! 또한 시스템 사용 방법에 대한 지침도 제공합니다. 나는 또한 당신에게 큰 보너스를 공유 할 것입니다!
The 1 2 3 Pattern Scanner
Reza Aghajanpour
4.77 (60)
** All Symbols x All Timeframes scan just by pressing scanner button ** After 18 years of experience in the markets and programming, Winner indicator is ready. I would like to share with you! *** Contact me  to send you instruction  and add you in "123 scanner group" for sharing or seeing experiences with other users. Introduction The 123 Pattern Scanner indicator with a special enhanced algorithm is a very repetitive common pattern finder with a high success rate . Interestingly, this Winner in
제작자의 제품 더 보기
FraMA Trend AM
Andriy Matviyevs'kyy
The presented indicator is essentially a separate trading system. The indicator independently determines entry points and points for setting protective stop orders. This product can be useful for both beginners and experienced traders, since it is developed on the basis of solutions proven by time and by professional traders. On fully formed bars the indicator is not redrawn. The indicator has the ability to send notifications to the terminal and email. Technically, the indicator is a system of
Fractal Levels AM
Andriy Matviyevs'kyy
The presented indicator is an original development based on the idea embedded in the classic technical analysis indicator - Fractals. The Fractals indicator allows you to determine a significant trough or peak for analysis on the price chart of the financial instrument in question. The fractal itself on the price chart consists of candles, the middle of which is either the highest (up fractal) or the lowest (down fractal) of all the candles taken for analysis. The original indicator uses five ca
FREE
Fine Trade AM
Andriy Matviyevs'kyy
5 (1)
제시된 지표는 금융 상품의 변동성을 평가하고, 가격 움직임 방향에서 큰 변화가 발생하는 순간에 대한 신호를 높은 효율성으로 제공합니다. 이 지표는 직관적이고 사용하기 쉽습니다. 지표 신호는 막대 형성이 완료된 후에 생성되며, 막대 형성이 완료되면 지표가 0을 기준으로 위치가 변경됩니다. 지표는 결코 신호를 다시 그리지 않습니다. 지표 신호는 지표가 0에 대한 상대적 위치가 변경되는 막대의 최대값/최소값을 초과하는 가격으로 확인되어야 합니다. 이 표시기를 사용하면 모바일 단말기로 이메일과 메시지를 보낼 수 있습니다. 구성 가능한 지표 매개변수: Sensitivity  - 금융 상품의 변동성에 대한 지표 민감도 Signal_on_Chart - 해당 지표는 지표 창뿐만 아니라 가격 차트에도 신호를 표시합니다. UP_Symbol_Type - 가격 차트에 표시되는 "상승" 신호에 대한 심볼 유형입니다. DN_Symbol_Type - 가격 차트에 표시되는 "하락" 신호에 대한 심볼 유형입니다.
FREE
Double PSAR AM
Andriy Matviyevs'kyy
5 (1)
This indicator is the author's implementation of the classic indicator Parabolic Support and Resist (PSAR). A time-tested product that allows you to not only determine entry/exit points but also reasonable levels for setting protective stop orders. The indicator has two customizable ranges, which allows you to identify long-term and short-term trends. The indicator does not repaint on the data history. The indicator has the ability to give signals and send notifications about them to e-mail and
FREE
AlphaTrend AM
Andriy Matviyevs'kyy
The presented indicator, based on the volatility readings of a financial instrument plots dynamic S/R levels on the price chart. The indicator determines the trend and points to possible entry points formed by local highs/lows. The indicator allows you to notify the user of its signals by sending messages to the terminal and e-mail. The indicator does not repaint or recalculate. Signals when working with the indicator: The appearance of a red arrow above the price chart is a possible start of a
FREE
EPMA Momentum AM
Andriy Matviyevs'kyy
The presented indicator is an original development based on the Predictive Moving Average indicator, which, in turn, was created by John Ehlers. The presented indicator in the form of an oscillator displays the rate of change of the Predictive Moving Average in a separate window. The indicator does not have customizable parameters, at the same time, in most cases, its signals are accurate. The indicator does not repaint on already formed bars, but its readings on the current bar (which continues
FREE
SuperTrend AM
Andriy Matviyevs'kyy
5 (2)
The presented product is a trend indicator of technical analysis that builds dynamic support/resistance levels based on the volatility of a financial instrument. The indicator allows you to determine the entry points into the market at the moment the price overcomes dynamic support/resistance level and to set a reasonable level for fixing a loss/profit. The indicator is a simple and effective tool that (depending on the parameter settings) can be used in almost any market and for any trading st
FREE
ELI Trigger AM
Andriy Matviyevs'kyy
The presented indicator is the author's implementation of the leading indicator Ehlers, created by John Ehlers. As the name suggests, this indicator should have high sensitivity and give early signals. The user can independently change the parameter for the sensitivity of the indicator. The indicator gives two types of signal: a signal of the beginning of a new trend; a signal of weakening of the current trend. Namely: when the histogram crosses the zero value - this is a signal of the beginning
FREE
ASC Signal AM
Andriy Matviyevs'kyy
A signal indicator marking buy/sell points. In this version, it is supplemented with optimal SL points. Recommended for use in conjunction with a trend indicator to filter signals. The indicator has only one adjustable parameter that determines its sensitivity, which greatly simplifies setting the indicator to the current market and the user's trading style. Indicator signals are given only after the full formation of the bar. The indicator can be used to trade any market. Its basic parameters p
FREE
ADX Signal AM
Andriy Matviyevs'kyy
4.67 (3)
This indicator is an interpretation of the Average Directional Movement Index (ADX), which helps to determine the presence of a price trend. It was developed and described in detail in the book "New Concepts in Technical Trading Systems" by Welles Wilder. The presented indicator displays signals on the price chart when +DI and -DI cross and signals when the ADX value falls or rises in relation to the mutual arrangement of +DI and -DI. The indicator's buy signals also work as a support level, whi
FREE
ADX Trigger AM
Andriy Matviyevs'kyy
5 (1)
This indicator is an interpretation of the Average Directional Movement Index (ADX), which helps to determine the presence of a price trend. It was developed and described in detail in the book "New Concepts in Technical Trading Systems" by Welles Wilder. The indicator determines entry points into the market, using the intersection of the +/- lines of the ADX indicator as a signal, as well as the rise or fall of the main line of the ADX indicator. Crossing the zero line by the indicator indicate
FREE
DSS Oscillator AM
Andriy Matviyevs'kyy
The presented indicator is the author's implementation of the Double Smoothed Stochastic oscillator developed by William Blau and Walter Bressert. The calculation of values ​​is in many ways similar to the calculation of the classic stochastic oscillator. The indicator takes into account the location of the current price relative to local highs/lows. The indicator gives signals about changing its direction and/or about entering/exiting the overbought/oversold zone. The signal is given after the
FREE
Simple Trend AM
Andriy Matviyevs'kyy
The trend is your friend. A simple truth known to every trader. The presented indicator allows you to visualize the current trend. The indicator identifies the trend using the following definition as an algorithm: A trend is a situation when each subsequent maximum price rise is higher/lower than the previous one, and similarly each subsequent maximum price fall is higher/lower than the previous one; The beginning of a new trend is considered to be when the current maximum/minimum overcomes all
FREE
EasyTrend AM
Andriy Matviyevs'kyy
5 (1)
The presented product is a trend indicator of technical analysis that allows you to open a position at the very beginning of a significant price movement. The most important qualities of the presented indicator are: The ability to follow the trend for as long as possible to get all the potential profit; Minimization of potential losses in case of a trend reversal or significant correction. The indicator has a wide range of customizable parameters allowing it to be used effectively in any market
FREE
ADX Line AM
Andriy Matviyevs'kyy
4.75 (4)
This indicator, interpreting ADX and ATR data, clearly and accurately identifies the current trend, allowing the trader to get the most out of strong price movements. The indicator is intuitive to use: a change in line direction means a change in trend direction; a change in line color warns of an imminent change in direction. The indicator does not repaint and allows you to send notifications about its signals to a mobile terminal and email. Configurable parameters: ADX_Medium_Coefficient - the
FREE
Step RSI AM
Andriy Matviyevs'kyy
5 (2)
제시된 지표는 고전적인 기술적 분석 지표인 RSI를 기반으로 독창적으로 개발된 것입니다. 지표 값의 급격한 변동을 완화하기 위해 약한 변화를 차단하고 트레이더의 주의를 값의 강한 변동에 집중시키는 필터가 사용됩니다. 이 표시기는 형성된 막대에 다시 칠해지지 않습니다. 이 지표의 효과를 높이려면 추세 방향과 지지/저항 수준을 파악하는 지표와 함께 사용해야 합니다. 지표 신호는 지표 히스토그램이 지표 신호선을 교차하는 지점에서 제공됩니다. 신호가 확인된다는 것은 가격이 신호가 주어진 막대의 최대/최소값을 돌파할 때를 말합니다. 이 표시기를 사용하면 모바일 단말기와 이메일로 신호 알림을 보낼 수 있습니다. 구성 가능한 매개변수: Style - 지표 신호의 스타일(지표의 주요 신호는 오실레이터가 신호선을 교차하거나 오실레이터가 0선을 교차하는 것임) Number_of_bars_calculated - 지표가 계산되어 표시될 막대의 수입니다.   RSI_Price - 지표를 계산하는 데 사용되
FREE
MFI Signal AM
Andriy Matviyevs'kyy
5 (1)
This indicator displays signals on the price chart based on the data of the classic indicator - the Money Flow Index (MFI). The volume is taken into account when calculating the MFI values. MFI can be used to determine overbought or oversold zones in the market. This indicator allows you to display three types of signals on the price chart: MFI exit from the overbought or oversold zone; MFI entry into the overbought or oversold zone; MFI crossing the middle between the overbought and oversold zo
FREE
RSI Cross Signal AM
Andriy Matviyevs'kyy
The indicator gives signals to open/close a position and marks them on the price chart of the financial instrument. The signals differ in their potential, which allows you to decide on the amount of risk in each transaction. The principle of operation is to compare the current RSI value with the RSI value whose period is multiplied by the Cross_Factor value. The signal is confirmed when the price overcomes the maximum/minimum of the bar on which the indicator gave the signal. The open position i
FREE
Limit Levels AM
Andriy Matviyevs'kyy
5 (1)
The presented indicator sets dynamic support/resistance levels on the price chart. The indicator is easy to use and can be useful for both beginners and professional traders. The middle line of the indicator (Central level) helps to identify the current trend: If the closing price is above the central line - the trend is ascending. If the closing price is below the central line - the trend is descending. The presented indicator allows implementing another version of the trading strategy, which w
FREE
Simple Aroon AM
Andriy Matviyevs'kyy
The presented indicator is the author's implementation of the classic Aroon indicator. The Aroon indicator was developed in 1995 by the Indian trader Tushar Chand. Chand's origin played a role in choosing an unusual name for the indicator. "Aroon" is translated from Sanskrit as "Light of the morning dawn". The formula for calculating the classic Aroon indicator: Aroon-Up = ((specified number of periods) - (number of periods since the formation of the maximum)) / (specified number of periods) * 1
FREE
REI Oscillator AM
Andriy Matviyevs'kyy
The presented product is the author's implementation of the REI (Range Expansion Index) indicator developed by Thomas DeMark. REI Oscillator AM is an indicator that measures the rate of price change and signals overbought/oversold conditions if the price shows weakness or strength. The indicator value changes within the range from -100 to +100. Thomas DeMark suggests using the default period of 8 and the following algorithm for using the indicator: When the price rises above level 60 and then fa
FREE
DSS Candles AM
Andriy Matviyevs'kyy
5 (1)
This indicator colors the price chart candles according to the data of the DSS Oscillator AM indicator. DSS Oscillator AM is the author's implementation of the Double Smoothed Stochastic oscillator developed by William Blau and Walter Bressert. The calculation of values ​​is largely similar to the calculation of the classic stochastic oscillator. The indicator takes into account the location of the current price relative to local highs/lows. The signal about the change in the direction of price
FREE
TTF Candles AM
Andriy Matviyevs'kyy
The presented indicator is an original development based on the TTF (Trend Trigger Factors) indicator. The indicator colors the price chart candles according to the TTF indicator data and its smoothed value (Signal line). The indicator does not repaint. The following thesis is used: The intersection of the TTF oscillator with the zero value is a buy/sell signal. The intersection of the TTF oscillator with its smoothed value is a signal of a change in trend. Thus: If the TTF indicator is greater
FREE
RSI 4x Candles AM
Andriy Matviyevs'kyy
The presented indicator displays in the form of colored candles the signals of the intersections of four RSI indicators of different periods. The candle turns red when the values ​​of the first indicator are less than the values ​​of the second indicator and the values ​​of the third indicator are less than the values ​​of the fourth indicator. The candle turns blue when the values ​​of the first indicator are greater than the values ​​of the second indicator and the values ​​of the third indica
FREE
TTF Line AM
Andriy Matviyevs'kyy
The presented indicator draws a trend line and points of change in its direction on the price chart based on the TTF (Trend Trigger Factors) and ATR indicators. The indicator advantageously combines ease of use, speed of reaction to a change in trend direction and reliability of signals. The indicator is intuitive to use: Change in line direction - change in trend direction; Change in line color warns of an imminent change in direction. The indicator does not repaint and allows you to send notif
FREE
Deep River AM
Andriy Matviyevs'kyy
The presented indicator is the author's implementation of the classic trading idea: Moving averages of different periods diverge over time on a strengthening trend and converge on a weakening trend. The proposed product allows you to clearly demonstrate: The direction of price movement; Temporary price rollbacks; Zones of multidirectional price movement. Namely: The indicator lines go up and diverge from each other - a strong bullish trend; The indicator lines go down and diverge from each othe
FREE
HyperSignal AM
Andriy Matviyevs'kyy
The presented indicator is an original development. The indicator is designed for high-frequency short-term trading with maximum reinvestment of funds. The indicator gives signals to open/close a position. The indicator sensitivity can be adjusted in a literally infinite range, which allows it to be used for trading in any market. The indicator signals vary in strength depending on their consistency with the trend over three different time periods. The above indicator feature allows you to esti
Bulls or Bears AM
Andriy Matviyevs'kyy
5 (1)
The presented indicator implements the idea embedded in the classic technical analysis indicators - "Bulls" / "Bears" at a new level. The "Bulls or Bears AM" indicator displays the difference between the maximum and minimum prices for the current period of time and the values ​​of the channel built on the maximum and minimum prices for a longer period. The growth of the indicator values ​​above zero indicates that the maximum price for the current period is greater than the average value of maxi
Market Pulse AM
Andriy Matviyevs'kyy
5 (1)
The presented indicator analyzes the direction of the short-term and long-term trend for specified periods, taking into account the volatility of the market. This approach allows combining high sensitivity of the indicator with a high probability of execution of its signals. The principle of use is extremely simple: the indicator histogram is greater than 0 - a buy signal / the indicator histogram is less than 0 - a sell signal. The indicator allows you to configure two types of parameters: fast
Digital Arrows AM
Andriy Matviyevs'kyy
The presented technical analysis indicator marks the points on the price chart of a financial instrument at which the short-term/long-term trend has changed its direction. The indicator identifies the trend direction by analyzing the divergence of the price series with the data of the digital filter selected by the user. The ability of the applied digital filters to adapt to sharp price fluctuations allows achieving high efficiency of the indicator signals in most markets. The indicator signals
필터:
리뷰 없음
리뷰 답변