Sinus wave mt5
- 지표
- 버전: 1.0
- 활성화: 10
Sinus wave indicator is a extra ordinary oscillator.to find divergency.for mt5
it works all pairs and all timeframes.
suitable for experienced and beginner traders..
indicator works on toward of the prices...
while sinus wave go up side that means prices will up.
and while sinus wave go down that means prices is going down.
it gives divegency when trend reversals.
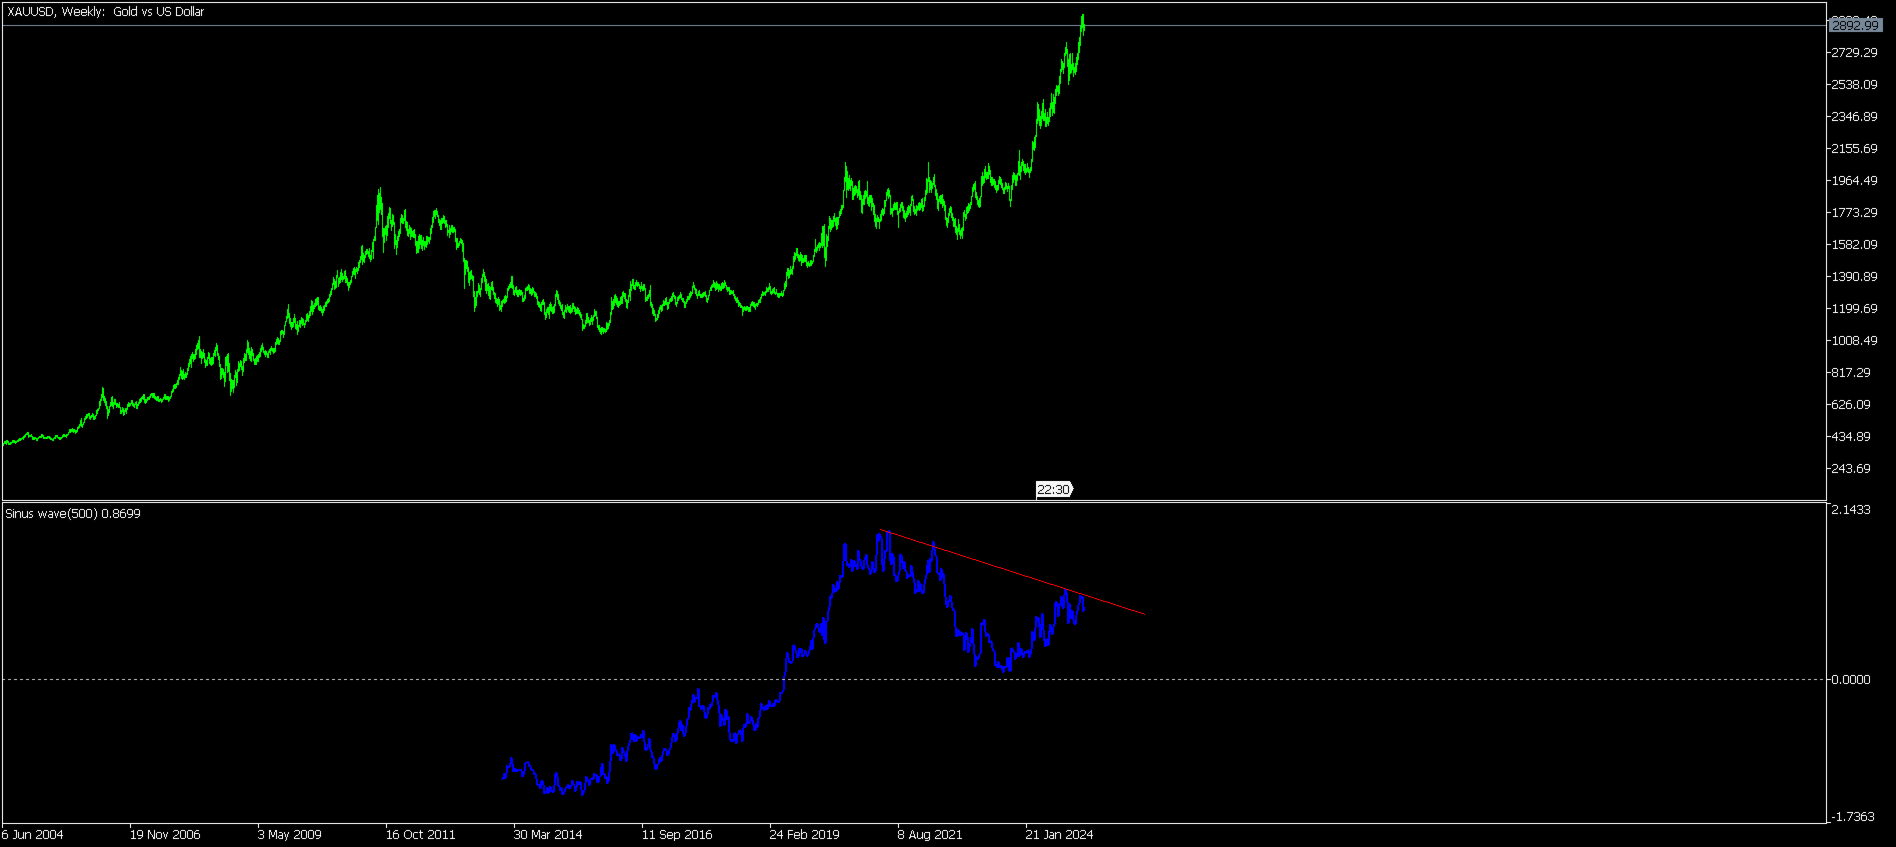
there is wave to set default 500.
on pictures divergency lines and letters has been drawn by hand.to explain how it works.