TMA Channel
- 지표
- 버전: 1.0
- 활성화: 5

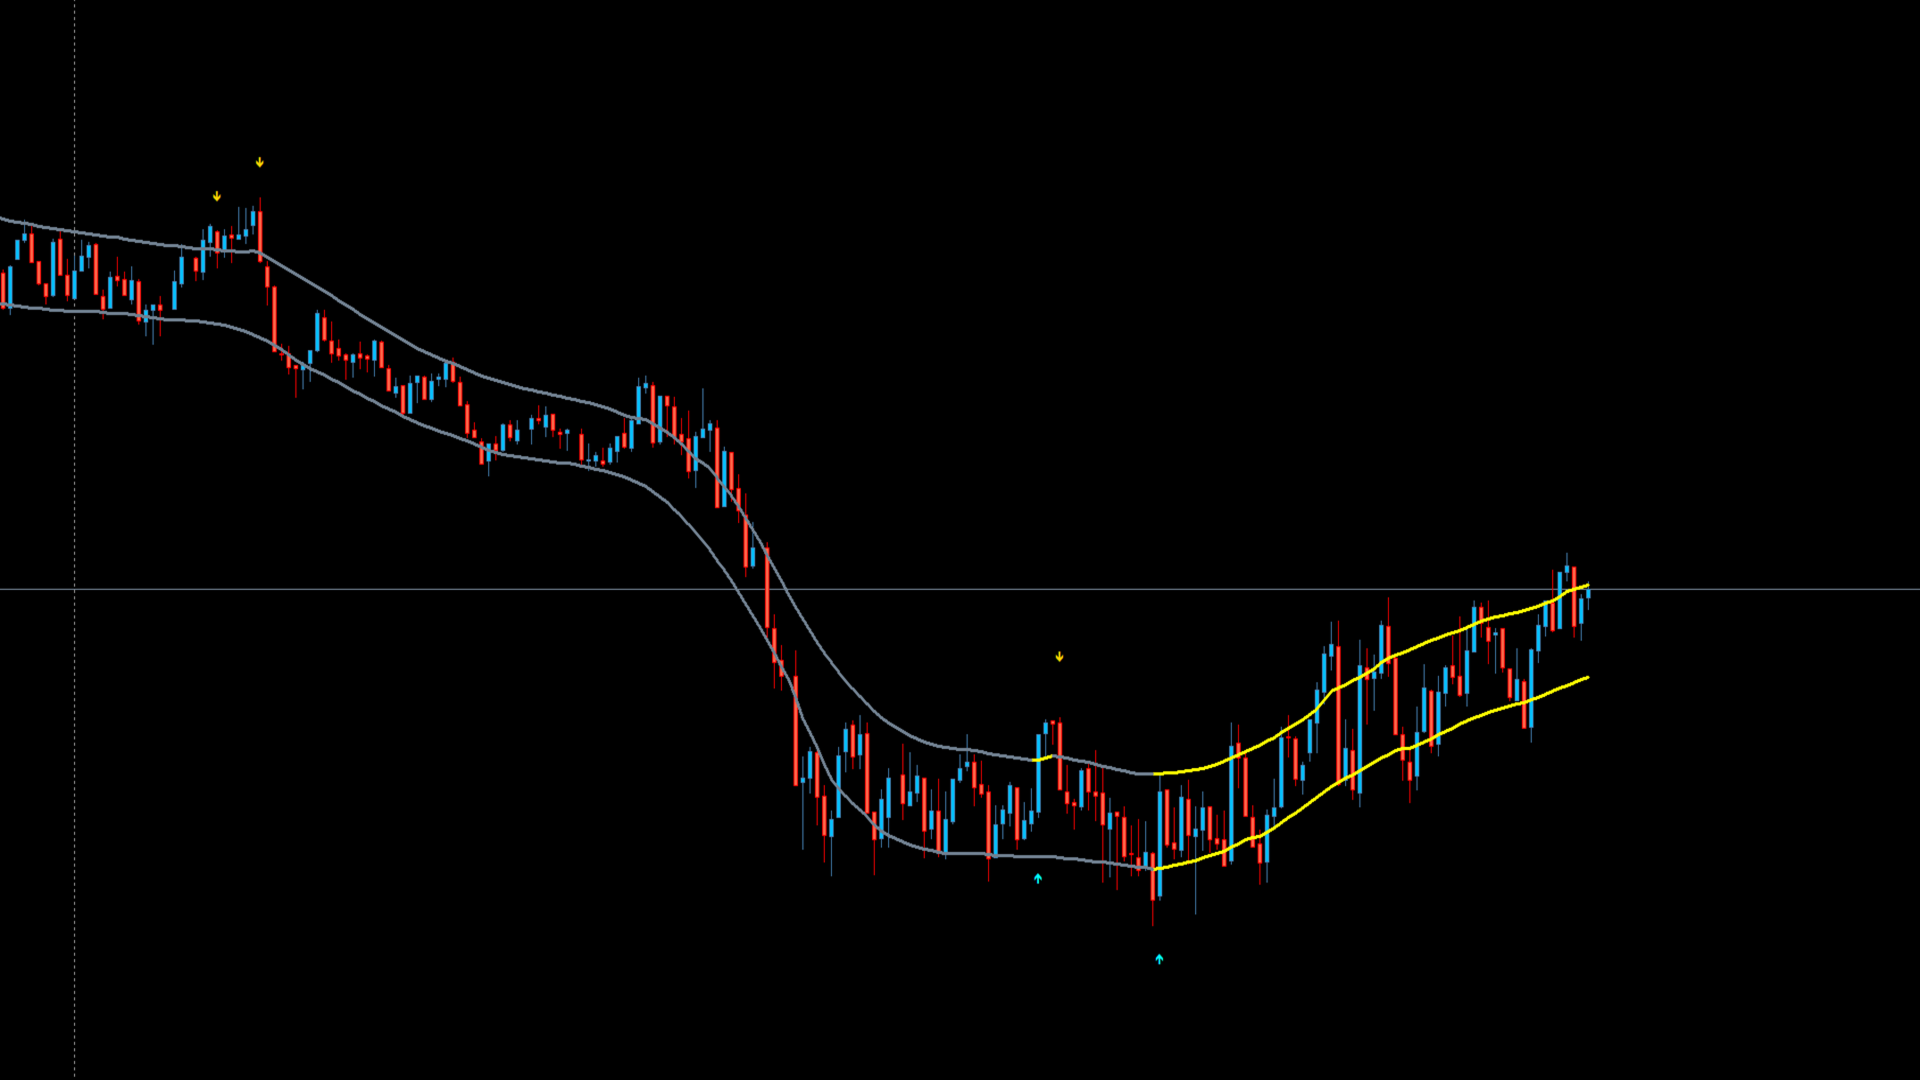
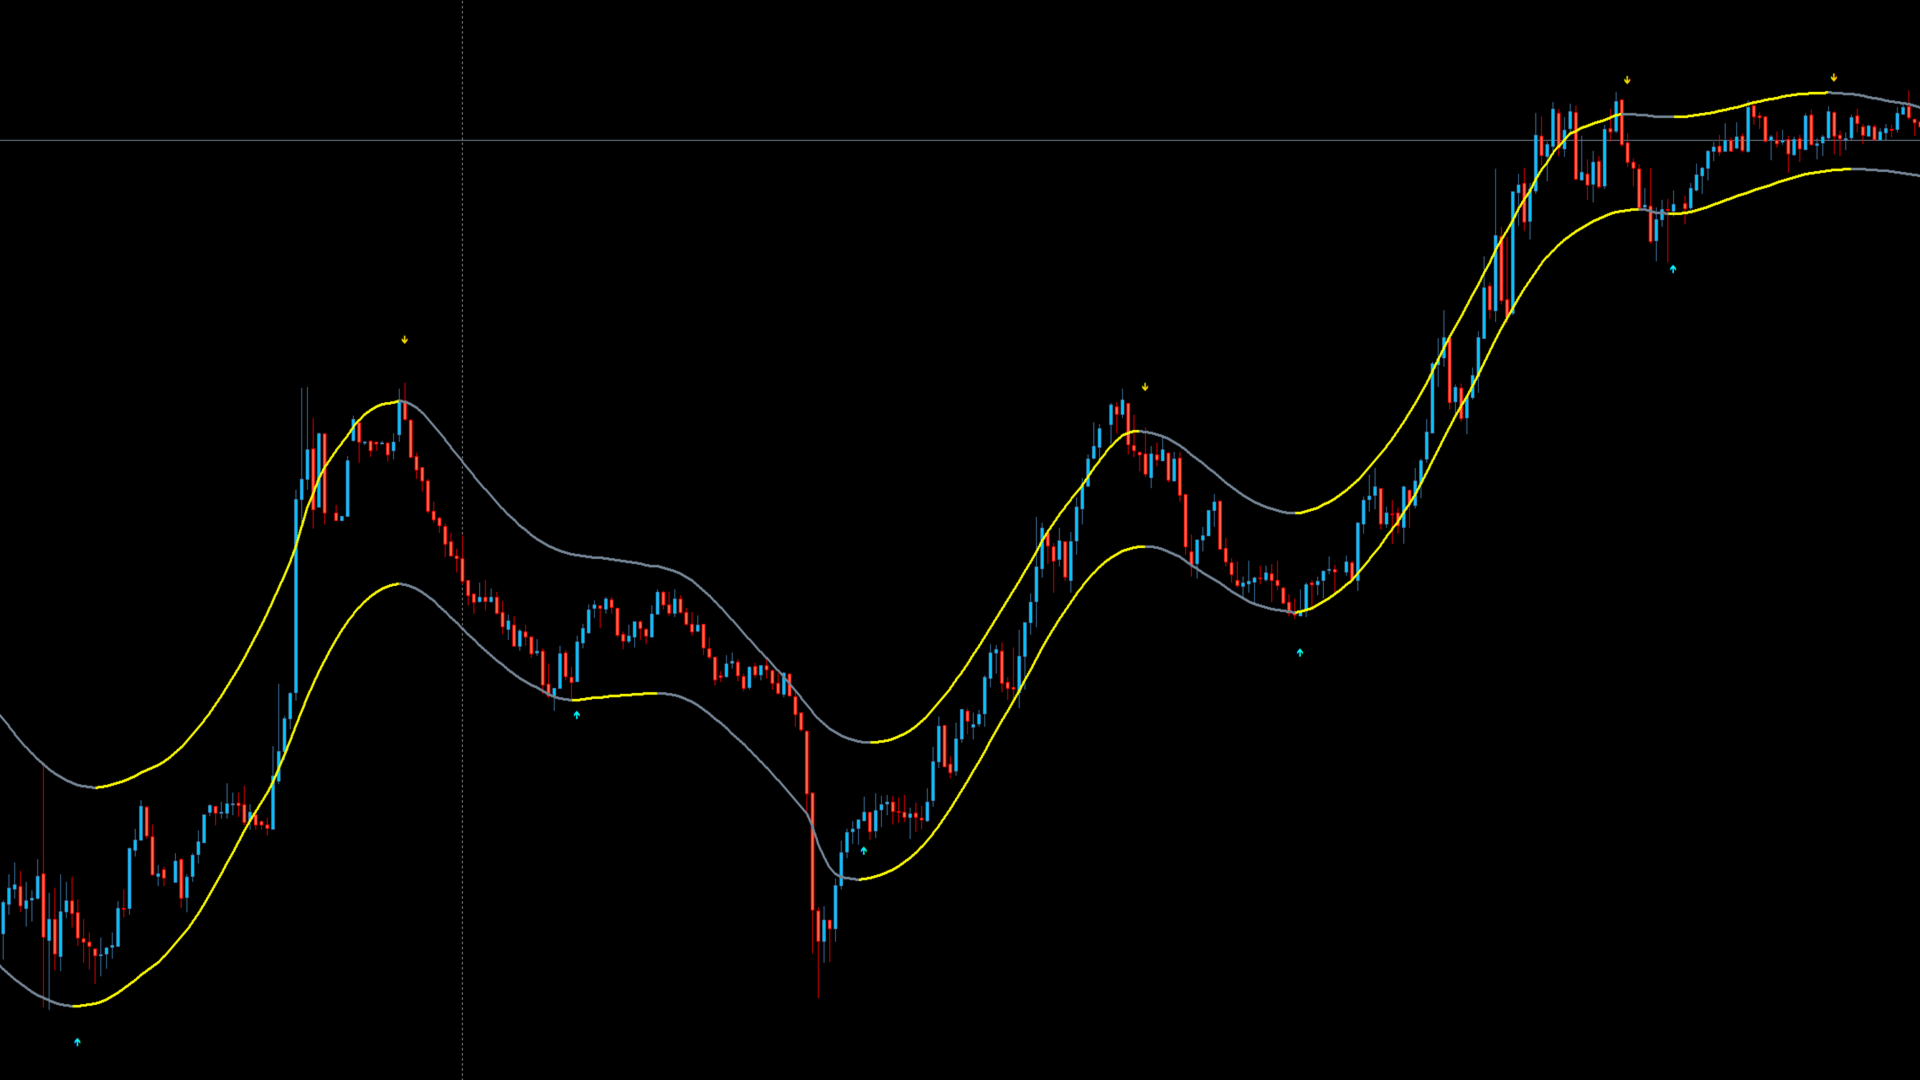
Two modified triangular MA as upper and lower bands that show the trend by changing color.
If both MAs show the same color, a confirmed trend is present.
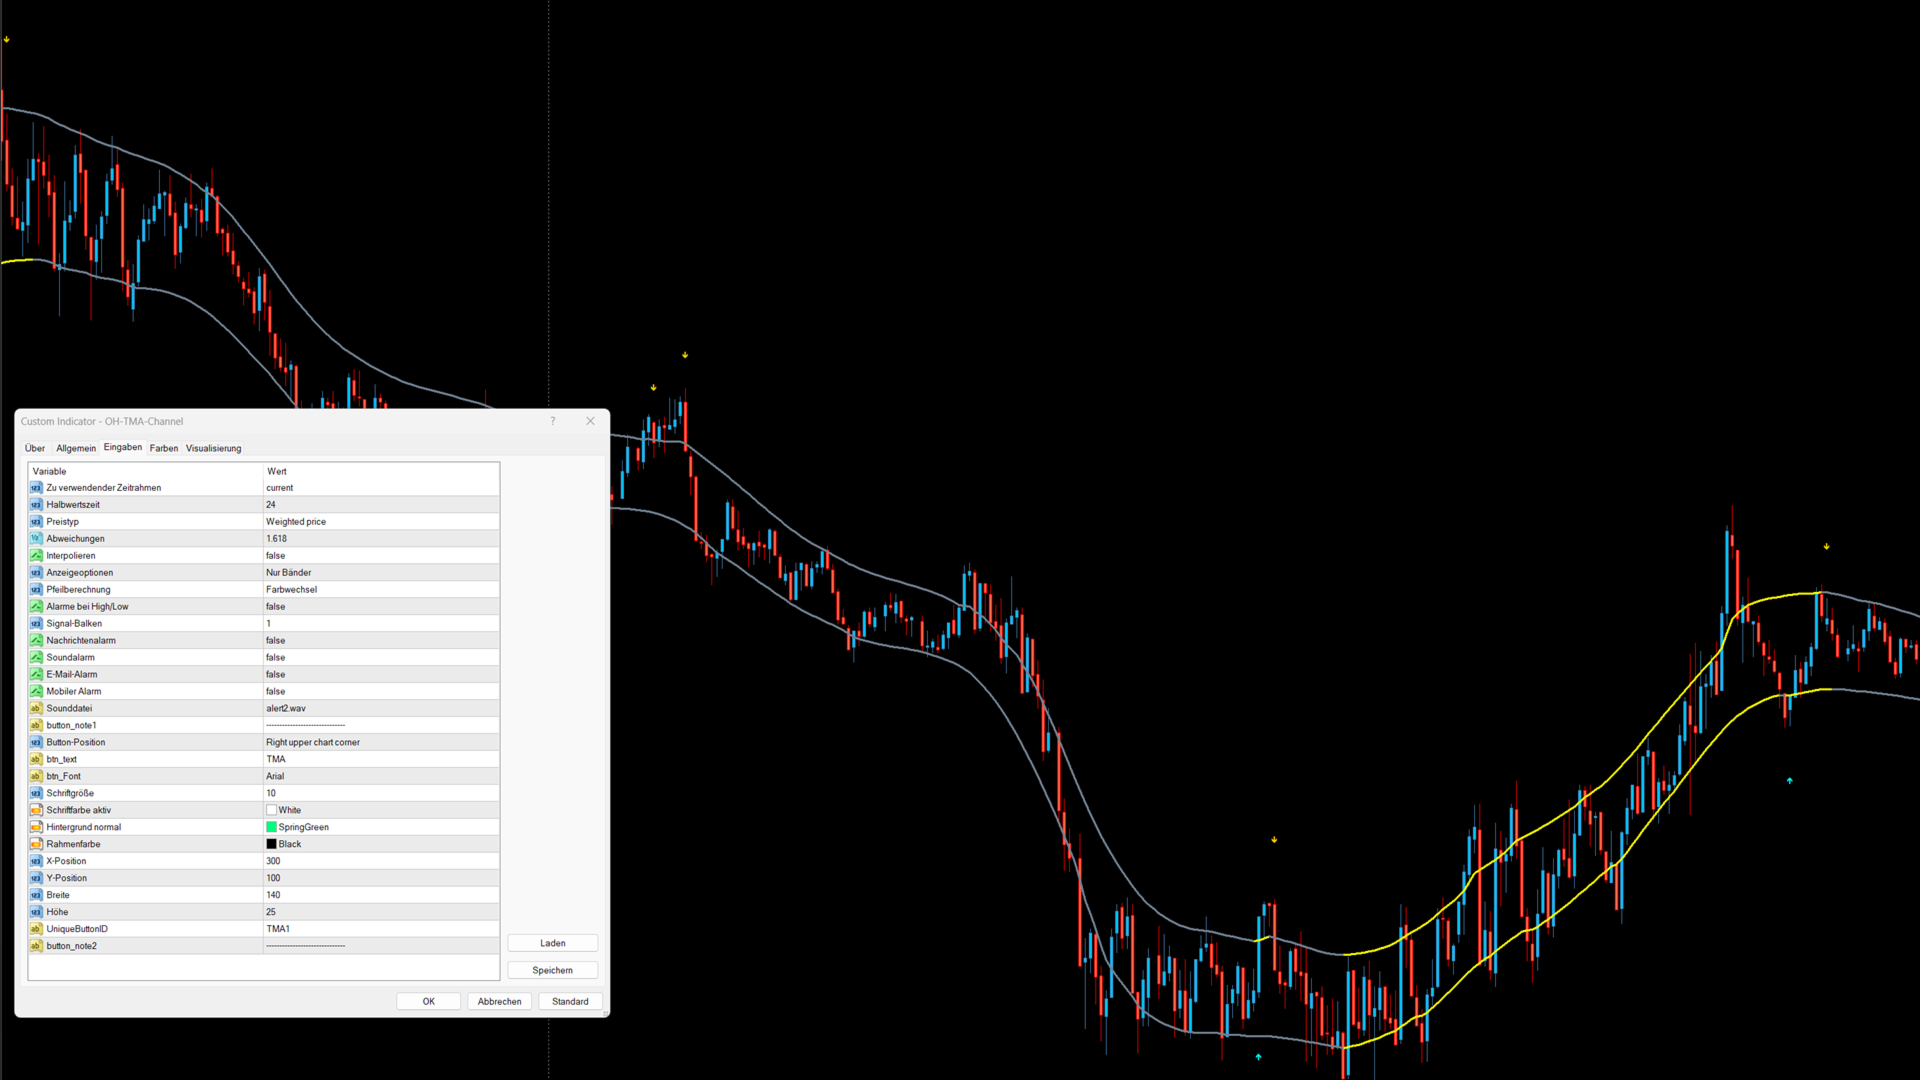
The indicator can be switched on and off using a button on the chart.
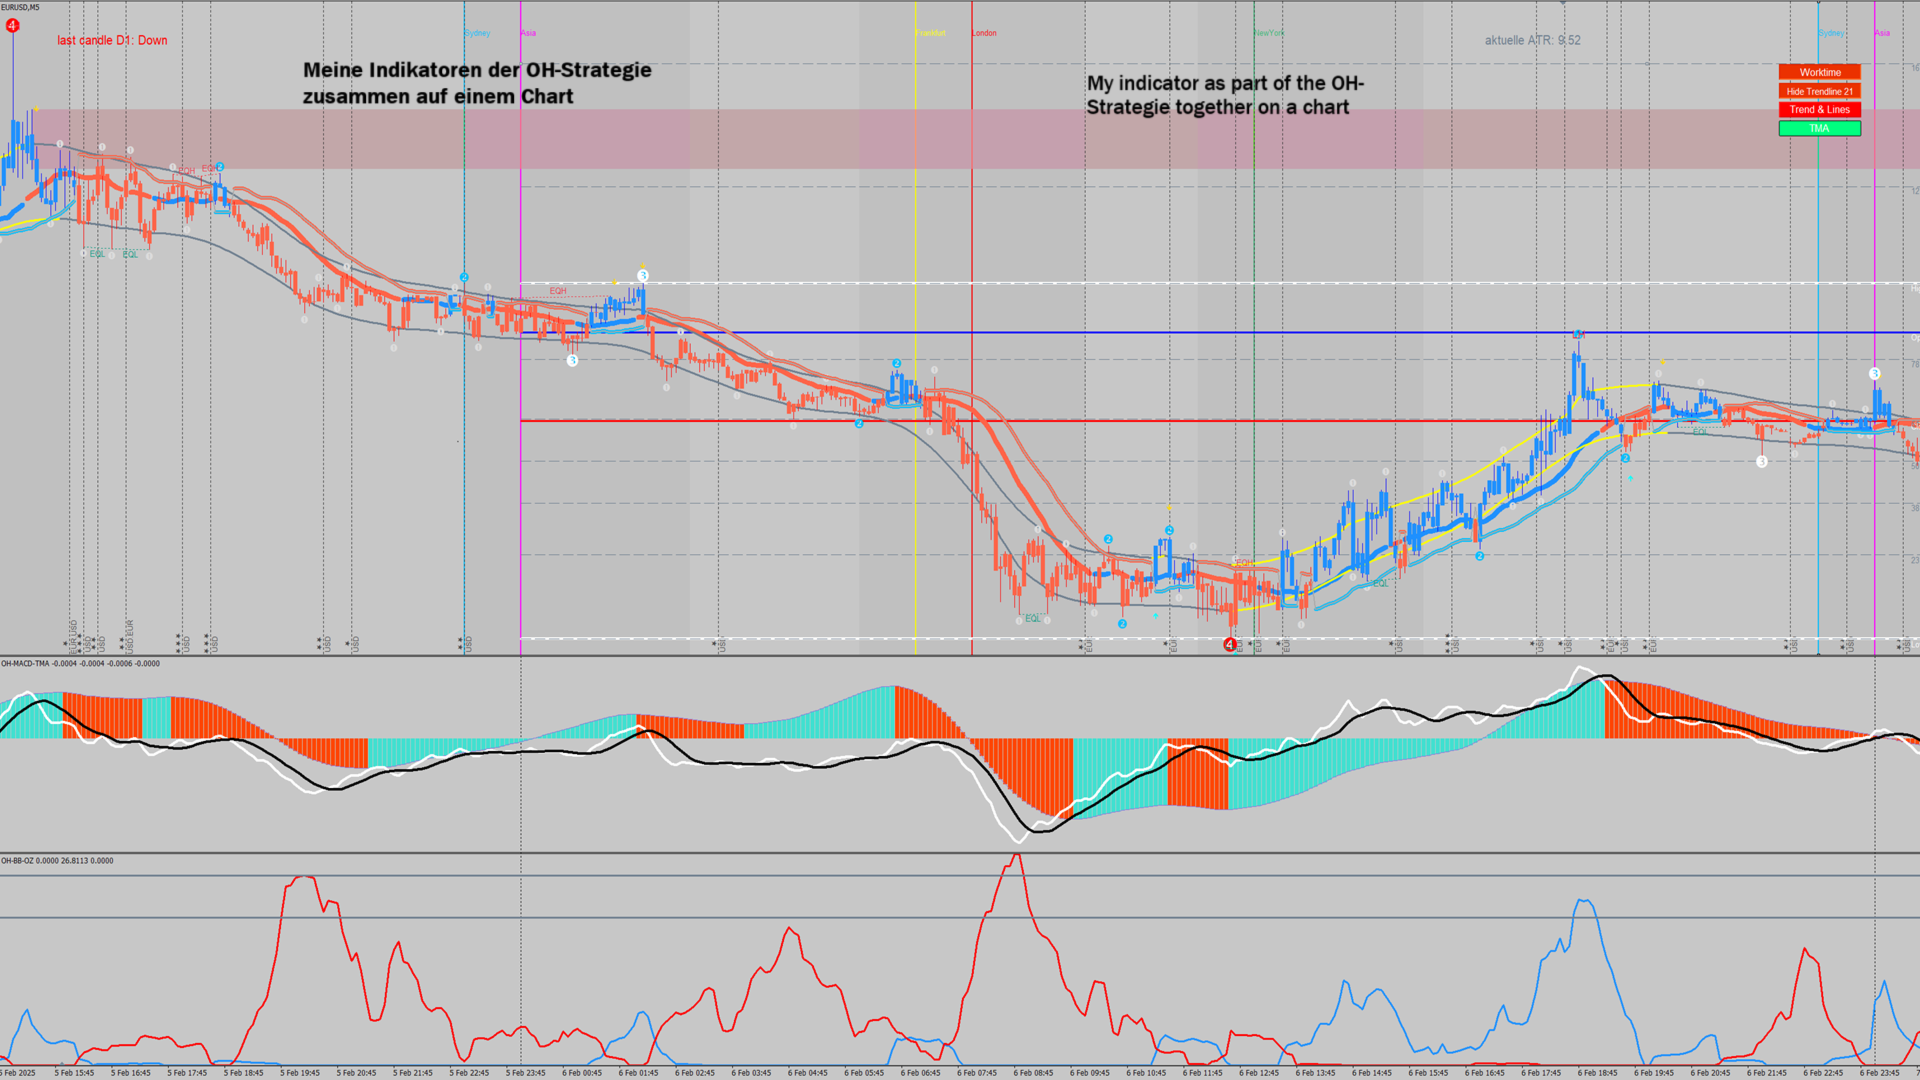
This indicator is part of the OH strategy. You can view other indicators of this strategy if you click on my name as a seller.
Take a look to my other indicator....
Take a look to my other indicator....