Fibonacci Oscillator

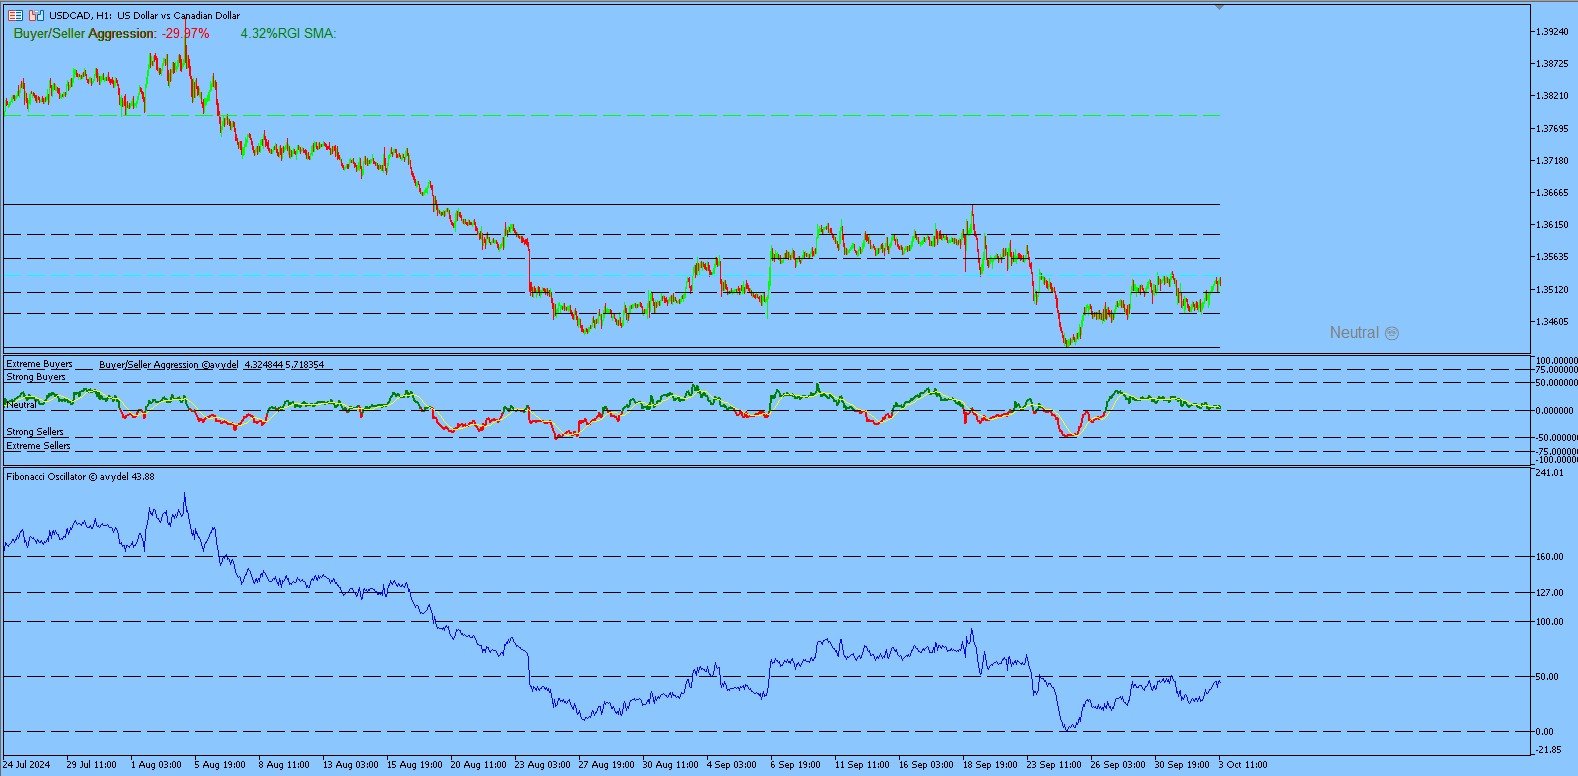
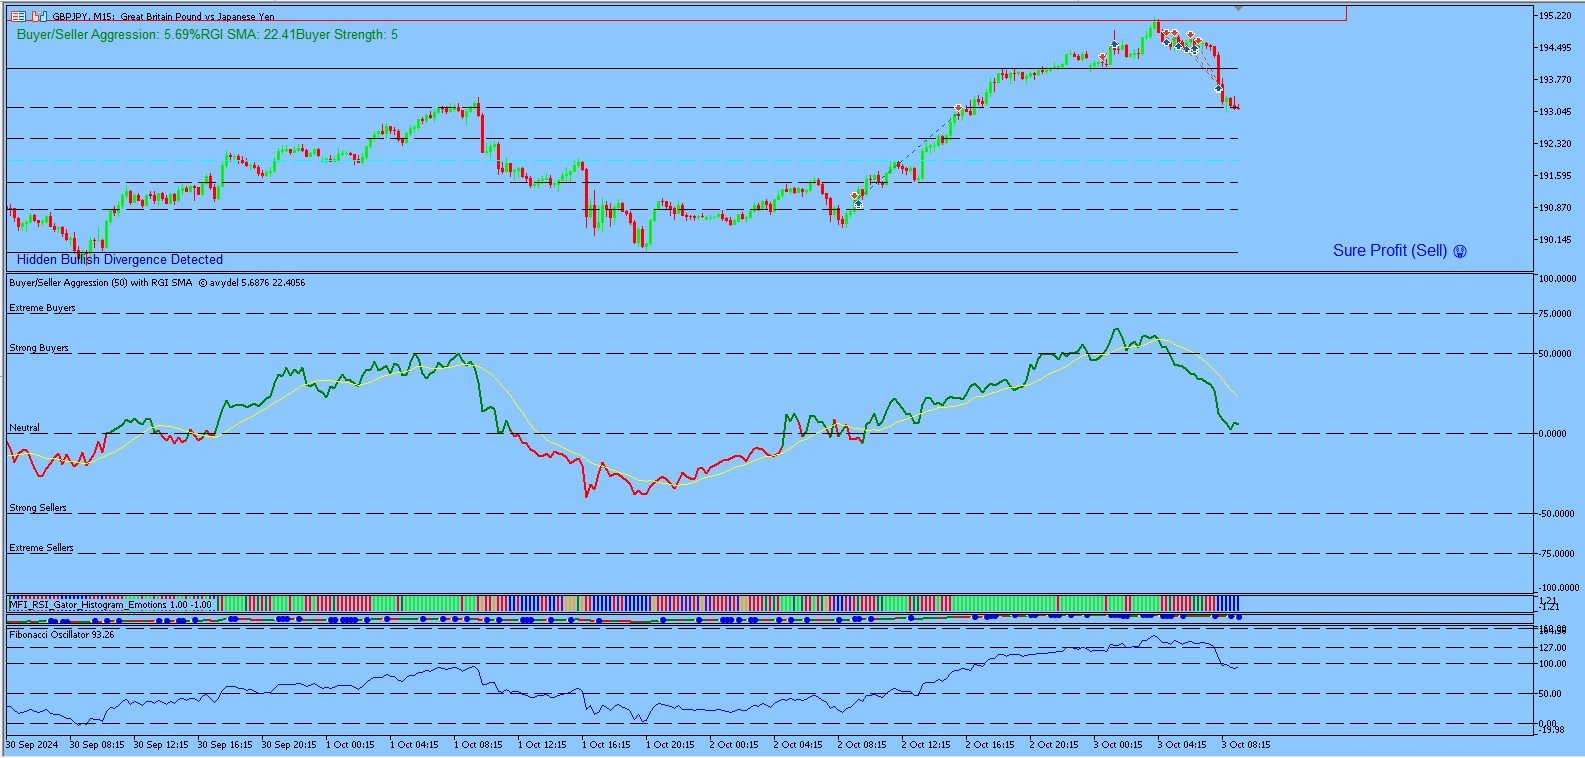
Introducing the Fibonacci Oscillator © avydel

Your Gateway to Precision Trading 

Unlock the hidden rhythms of the market with our groundbreaking Fibonacci Oscillator.

This innovative indicator harnesses the power of the golden ratio to reveal market trends and reversals with unprecedented accuracy.

Key Features:

  1. Dynamic Fibonacci Levels: Experience the market like never before with our unique oscillator that adapts to price action in real-time.
  2. Customizable Fibonacci Ranges: Tailor your analysis with a full spectrum of Fibonacci levels, including:
    • Extended levels: -61.8%, -50%, -38.2%, -23.6%
    • Classic levels: 0%, 23.6%, 38.2%, 50%, 61.8%
    • Advanced levels: 78.6%, 100%, 127.2%, 161.8%
  3. Swing High/Low Detection: Our smart algorithm identifies key market pivots, providing you with crucial support and resistance levels.
  4. Adjustable Lookback Period: Fine-tune your analysis by customizing the historical data range, allowing for both short-term and long-term perspectives.
  5. User-Friendly Interface: Designed with both novice and experienced traders in mind, our intuitive display makes complex Fibonacci analysis accessible to all.
  6. Multi-Timeframe Analysis: Seamlessly switch between timeframes to confirm trends and identify high-probability trade setups.
  7. Alert System: Never miss a trading opportunity with customizable alerts for when price reaches critical Fibonacci levels.
  8. Compatibility: Works flawlessly across all major currency pairs and financial instruments.
Elevate your trading strategy with the Fibonacci Oscillator. Whether you're a day trader looking for quick scalps or a swing trader aiming for larger moves, this indicator adapts to your preferred Fibonacci levels, giving you a personalized edge in the market.Don't let this opportunity slip through your fingers! The Fibonacci Oscillator is available for free for a limited time only. Download now and experience the transformative power of Fibonacci analysis before this offer expires. Act fast – this game-changing tool won't be free forever, and you won't want to miss out on the competitive advantage it provides.Upgrade your trading arsenal today and join the ranks of successful traders who have already discovered the Fibonacci Oscillator's potential. Your journey to more profitable trades starts here


추천 제품
Free automatic Fibonacci is an indicator that automatically plots a Fibonacci retracement based on the number of bars you select on the BarsToScan setting in the indicator. The Fibonacci is automatically updated in real time as new highest and lowest values appears amongst the selected bars. You can select which level values to be displayed in the indicator settings. You can also select the color of the levels thus enabling the trader to be able to attach the indicator several times with differe
FREE
PZ Penta O MT5
PZ TRADING SLU
3.5 (4)
The Penta-O is a 6-point retracement harmonacci pattern which usually precedes big market movements. Penta-O patterns can expand and repaint quite a bit. To make things easier this indicator implements a twist: it waits for a donchian breakout in the right direction before signaling the trade. The end result is an otherwise repainting indicator with a very reliable trading signal. The donchian breakout period is entered as an input. [ Installation Guide | Update Guide | Troubleshooting | FAQ | A
FREE
Fibonacci Bollinger Bands MT5
Diego Arribas Lopez
5 (1)
MT4 Version Most indicators draw lines. This one draws the battlefield. If you ever bought an EA or indicator based on a perfect equity curve — and then watched it bleed out live — you’re not alone. The problem? Static logic in a dynamic market. Fibonacci Bollinger Bands   adapts. It combines Bollinger structure with customizable Fibonacci levels to mark   zones of control   — where price reacts, pauses, or reverses. No magic. Just logic that follows volatility. Why this tool matters   It
FREE
FlatBreakout MT5
Aleksei Vorontsov
FlatBreakout MT5 (Free Version) Flat Range Detector and Breakout Panel for MT5 — GBPUSD Only FlatBreakout MT5   is the free version of the professional FlatBreakoutPro MT5 indicator, specially designed for flat (range) detection and breakout signals on the   GBPUSD   pair only. Perfect for traders who want to experience the unique fractal logic of FlatBreakout MT5 and test breakout signals on a live market without limitations. Who Is This Product For? For traders who prefer to trade breakout of
FREE
Haven Key Levels PDH PDL
Maksim Tarutin
5 (7)
"Haven Key Levels PDH PDL"   인디케이터는 트레이더가 차트에서 핵심 레벨을 시각화하는 데 도움을 줍니다. 다음 레벨을 자동으로 표시합니다: DO (Daily Open)   — 일일 시가. NYM (New York Midnight)   — 뉴욕 자정 레벨. PDH (Previous Day High)   — 전일 고가. PDL (Previous Day Low)   — 전일 저가. WO (Weekly Open)   — 주간 시가. MO (Monthly Open)   — 월간 시가. PWH (Previous Week High)   — 전주 고가. PWL (Previous Week Low)   — 전주 저가. CMH (Current Month High)   — 당월 고가. CML (Current Month Low)   — 당월 저가. PMH (Previous Month High)   — 전월 고가. PML (Previous Month Low)   — 전월 저가. 다른
FREE
이전 버전의 인디케이터 개발 ZigZag WaveSize MT4 ZigZag WaveSize - 표준 ZigZag 인디케이터를 수정하여 포인트, 레벨 및 다양한 경고 로직에 대한 정보 추가 일반적인 개선 사항: MetaTrader 5 코드 적응 그래픽 객체 작업 최적화 새로운 기능: 극점에서의 수평 수준 수준 유형 선택: 수평/광선/세그먼트 유동성 수준 필터 (가격에 의해 돌파되지 않음) 돌파 버퍼: 거짓 돌파에 대한 민감도 설정 레이블 및 기능 설정: 수량, 외관, 오래된 레이블 삭제 구조 돌파 알림 (BoS) 움직임 성격 변경 알림 (ChoCH) 최적화: 극값 업데이트 로직 수정 새로운 객체의 동적 업데이트 바 출현 시 하중 감소 레이블의 중앙 집중 시스템 수정 사항: 배열 범위 초과 수정 레이블의 정확한 위치 지정 중복 파라미터 제거 ZigZag WaveSize 인디케이터를 귀하의 트레이딩 시스템의 보완재로 사용하세요   또한 시장에서의 나의 다른 제품도 시도해 보세요 
FREE
Important Lines
Terence Gronowski
4.87 (23)
This indicator displays Pivot-Lines, preday high and low, preday close and the minimum and maximum of the previous hour. You just have to put this single indicator to the chart to have all these important lines, no need to setup many single indicators. Why certain lines are important Preday high and low : These are watched by traders who trade in a daily chart. Very often, if price climbs over or falls under a preday low/high there is an acceleration in buying/selling. It is a breakout out of a
FREE
Follow The Line MT5
Oliver Gideon Amofa Appiah
4.6 (35)
This indicator obeys the popular maxim that: "THE TREND IS YOUR FRIEND" It paints a GREEN line for BUY and also paints a RED line for SELL. (you can change the colors). It gives alarms and alerts of all kinds. IT DOES NOT REPAINT and can be used for all currency pairs and timeframes. Yes, as easy and simple as that. Even a newbie can use it to make great and reliable trades. NB: For best results, get my other premium indicators for more powerful and reliable signals. Get them here: https://www.m
FREE
개요 이 지표는 클래식 돈치안 채널(Donchian Channel) 의 향상된 버전으로, 실전 트레이딩을 위한 다양한 기능이 추가되었습니다. 표준 세 개의 선(상단, 하단, 중앙선) 외에도 브레이크아웃 을 감지하여 차트에 화살표로 시각적으로 표시하며, 차트를 깔끔하게 보기 위해 현재 추세 방향의 반대 라인만 표시 합니다. 지표 기능: 시각적 신호 : 브레이크아웃 시 컬러 화살표 표시 자동 알림 : 팝업, 푸시 알림, 이메일 RSI 필터 : 시장의 상대 강도를 기반으로 신호 검증 사용자 맞춤 설정 : 색상, 선 두께, 화살표 코드, RSI 임계값 등 동작 원리 돈치안 채널은 다음을 계산합니다: 상단선 : 최근 N개의 종가 완료 캔들에서 가장 높은 고가 하단선 : 최근 N개의 종가 완료 캔들에서 가장 낮은 저가 중앙선 : 고가와 저가의 평균값 상방 브레이크아웃 은 종가가 상단선을 돌파할 때 발생하며, 하방 브레이크아웃 은 종가가 하단선 아래로 내려갈 때 발생합니다. 이 지표는: 세 개의
FREE
Statistical Arbitrage Spread Generator for Cointegration [MT5] What is Pair Trading? Pair trading is a market-neutral strategy that looks to exploit the relative price movement between two correlated assets — instead of betting on the direction of the market. The idea? When two assets that usually move together diverge beyond a statistically significant threshold, one is likely mispriced. You sell the expensive one, buy the cheap one , and profit when they converge again. It’s a statistica
FREE
Easy Correlations Indicator The Easy Correlations Indicator is designed to help traders analyze the relationship between two correlated instruments. By monitoring the distance between their Relative Strength Index (RSI) values, the indicator highlights situations where one instrument has moved significantly further than the other. This creates potential trading opportunities: Sell the stronger instrument (overstretched RSI) Buy the weaker instrument (lagging RSI) Because the positions are opened
FREE
Zigzag Price Arrows
Aiman Saeed Salem Dahbag
The Zigzag Price Arrow indicator is an enhanced version of the classic Zigzag indicator, combining the traditional zigzag pattern with advanced visual features. It not only identifies major market turning points but also provides clear trading signals through: • Directional arrows: Displays colored arrows (green for buy, magenta for sell) indicating potential trend directions. • Price labels: Shows the exact price values at each pivot point directly on the chart. • Improved visual clarity: Make
FREE
MACD Enhanced
Nikita Berdnikov
5 (2)
Introducing the MACD  Enhanced – an advanced MACD (Moving Average Convergence Divergence) indicator that provides traders with extended capabilities for trend and momentum analysis in financial markets. The indicator uses the difference between the fast and slow exponential moving averages to determine momentum, direction, and strength of the trend, creating clear visual signals for potential entry and exit points. Attention! To achieve the best results, it is recommended to adapt the indicator
FREE
This indicator is an automated version of the Fibonacci retracement (Fib) indicator. Deciding the best areas to use when drawing the fib can be tricky and this  indicator was made with that in mind. When you drop it on the chart it will automatically choose the best points to draw the fib with, but in case you aren't satisfied with those regions, you can adjust it as you wish.
FREE
PZ Pivot Points MT5
PZ TRADING SLU
4.91 (22)
This indicator displays pivot points in the chart, including historical vales, and supports many calculation modes for Pivot Points and S/R levels. [ Installation Guide | Update Guide | Troubleshooting | FAQ | All Products ] It plots historical levels for backtesting purposes It allows you to select the reference timeframe It implements different Pivot Point calculation modes It implements different SR calculation modes It implements customizable colors and sizes Calculation Modes The indicato
FREE
High Low Open Close
Alexandre Borela
4.98 (42)
이 프로젝트를 좋아한다면 5 스타 리뷰를 남겨주세요. 이 지표는 열리고, 높은, 낮은 및 마감 가격을 지정합니다. 기간과 그것은 특정한 시간대를 위해 조정될 수 있습니다. 이들은 많은 기관 및 전문가에 의해 보는 중요한 수준입니다 상인은 당신이 더 많은 것일 수있는 장소를 알고 도움이 될 수 있습니다 이름 * 사용 가능한 기간: 이전 날. 이전 주. 지난 달. 이전 분기. 이전 연도. 또는: 현재 날. 현재 주. 현재 달. 현재 분기. 현재 년.
FREE
Dynamic Zones
Kee Huang Tan
Dynamic Supply and Demand indicator automatically identifies and displays Supply and Demand Zones on your chart based on price action patterns and market structure.  These zones represent areas where institutional buying or selling pressure has historically occurred, making them key levels for potential price reactions. This form of indicator takes inspiration from ICT as well as traditional Support & Resistance formation. **For the first 50 candles (number depends on LookBackCandles) when indic
FREE
LT Donchian Channel
Thiago Duarte
4.83 (6)
Donchian Channel is an indicator created by Richard Donchian. It is formed by taking the highest high and the lowest low of the last specified period in candles. The area between high and low is the channel for the chosen period. Its configuration is simple. It is possible to have the average between the upper and lower lines, plus you have alerts when price hits one side. If you have any questions or find any bugs, please contact me. Enjoy!
FREE
Indicator and Expert Adviser  EA Available in the comments section of this product. Download with Indicator must have indicator installed for EA to work. Mt5 indicator alerts for bollinger band and envelope extremes occurring at the same time. Buy signal alerts occur when A bullish candle has formed below both the lower bollinger band and the lower envelope  Bar must open and close below both these indicators. Sell signal occur when A bear bar is formed above the upper bollinger band and upper
FREE
Pivot Point Fibo RSJ
JETINVEST
4.4 (20)
피봇 포인트 Fibo RSJ는 피보나치 비율을 사용하여 당일의 지지선과 저항선을 추적하는 지표입니다. 이 멋진 지표는 피보나치 비율을 사용하여 피벗 포인트를 통해 최대 7단계의 지지와 저항을 생성합니다. 가격이 작업의 가능한 진입/종료 지점을 인식할 수 있는 이 지원 및 저항의 각 수준을 어떻게 존중하는지 환상적입니다. 특징 최대 7단계 지원 및 7단계 저항 레벨의 색상을 개별적으로 설정 입력 피벗 유형 피벗 피보 RSJ1 = 피보 비율 1 계산 피벗 피보 RSJ2 = 피보 비율 2 계산 피벗 Fibo RSJ3 = Fibo 비율 3 계산 피벗 피보 클래식 = 클래식 피벗 계산 최소 피벗 수준 피벗 3 레벨 피벗 4 레벨 피벗 5 레벨 6단계 피벗 피벗 7 레벨 여전히 질문이 있는 경우 다이렉트 메시지로 저에게 연락하십시오: https://www.mql5.com/ko/users/robsjunqueira/
FREE
VisualVol EURUSD
Maxim Kuznetsov
The indicator highlights the points that a professional trader sees in ordinary indicators. VisualVol visually displays different volatility indicators on a single scale and a common align. Highlights the excess of volume indicators in color. At the same time, Tick and Real Volume, Actual range, ATR, candle size and return (open-close difference) can be displayed. Thanks to VisualVol, you will see the market periods and the right time for different trading operations. This version is intended f
FREE
Trendline mt5 indicator
David Muriithi
3 (1)
Are you tired of drawing trendlines every time you're analyzing charts? Or perhaps you would like more consistency in your technical analysis. Then this is for you. This indicator will draw trend lines automatically when dropped on a chart. How it works Works similar to standard deviation channel found on mt4 and mt5. It has 2 parameters: 1. Starting Bar 2. Number of bars for calculation The   starting bar   is the bar which drawing of the trend lines will begin, while the   number of bars for c
FREE
Haven FVG Indicator
Maksim Tarutin
5 (7)
인디케이터   Haven FVG   는 시장을 분석하는 도구로, 차트에서 비효율성 영역(Fair Value Gaps, FVG)을 식별하여 트레이더에게 가격 분석 및 거래 결정을 위한 주요 수준을 제공합니다. 다른 제품 ->  여기 주요 특징: 개별 색상 설정: 상승 FVG 색상   (Bullish FVG Color). 하락 FVG 색상   (Bearish FVG Color). 유연한 FVG 시각화: FVG를 검색할 최대 캔들 수. FVG 영역을 특정 바 수만큼 추가로 연장. FVG에 대한 채우기를 활성화할 수 있습니다. 중앙선(Middle Line): 색상 및 선 스타일 선택(예: 점선). 더 정확한 선 두께 조정. 일반 설정: FVG를 현재 바까지 확장. 채우기가 있는 역사적 FVG 제외하여 최신 데이터에 집중. 차트에서 비효율성 영역을 분석하고 근거 있는 거래 결정을 내리는 간단하고 효과적인 방법.
FREE
TradeQL
Abdiel Aviles Jimenez
The TradeQL Indicator is a customizable tool that highlights specific trading patterns on candlestick charts. Users can define patterns through TradeQL queries, which the indicator then applies to the chart, visually representing matches and captured groups. Ideal for identifying complex trade setups in real-time. TradeQL queries are specified using the TradeQL Language. See https://github.com/abdielou/tradeql for more details. This language is expressed as a regular expression. The language al
FREE
Heiken Ashi fxam
Ely Alsedy
5 (1)
헤이킨 아시 MT5 인디케이터 헤이킨 아시 MT5 인디케이터는 표준 가격 데이터를 더 부드럽고 추세 중심의 캔들스틱으로 변환하여 시장 트렌드와 잠재적인 역전 지점을 더 쉽게 식별할 수 있도록 하는 강력한 도구입니다. 주요 특징: 명확한 트렌드 식별: 다른 캔들 색상으로 상승 추세와 하락 추세를 시각적으로 구분합니다. 노이즈 감소: 가격 변동을 필터링하여 시장의 주요 움직임을 더 명확하게 표시합니다. 조기 트렌드 감지: 표준 차트에서 트렌드 변화가 명확해지기 전에 잠재적인 트렌드 변화를 예측합니다. 다용도성: 독립적으로 사용하거나 다른 기술적 지표와 함께 종합적인 분석에 사용할 수 있습니다. 사용자 정의 설정: 인디케이터를 특정 거래 선호도와 전략에 맞게 조정할 수 있습니다. 장점: 트렌드를 식별하고 잠재적인 진입 및 청산 지점을 파악하는 능력을 향상시킵니다. 시장 노이즈의 영향을 줄이고 중요한 가격 변동에 집중합니다. 시장 역학에 대한 더 명확한 이해를 바탕으로 더 나은 거래 결정
FREE
DALA Forecast
Grigorii Matsnev
About the indicator: DALA Forecast is a universal tool for predicting the dynamics of time series of any nature. For prediction, modified methods of nonlinear dynamics analysis are used, on the basis of which a predictive model is built using machine learning methods.  To get the trial version of the indicator, you can contact me in private messages. How to use the indicator: Apply the indicator to your chosen financial instrument or indicator with the settings you need. The prediction will be
FREE
Swing Point BoS CHoCH Con Exp Alerts
Usiola Oluwadamilol Olagundoye
NOTE: Turn Pattern Scan ON This indicator identifies Swing Points, Break of Structure (BoS), Change of Character (CHoCH), Contraction and Expansion patterns which are plotted on the charts It also comes with Alerts & Mobile notifications so that you do not miss any trades. It can be used on all trading instruments and on all timeframes. The non-repaint feature makes it particularly useful in backtesting and developing profitable trading models. The depth can be adjusted to filter swing points.
FREE
Magic 7 Indicator
Marek Pawel Szczesny
Overview Magic 7 Indicator is a comprehensive MetaTrader 5 (MQL5) indicator that identifies seven different trading scenarios based on candlestick patterns and technical analysis. The indicator combines traditional price action patterns with modern concepts like Fair Value Gaps (FVG) to provide trading signals with precise entry points and stop loss levels. Features 7 Trading Scenarios : Each scenario identifies specific market conditions and trading opportunities Visual Signals : Clear buy/sell
FREE
Daily Support and Resistance Levels 는 클래식 피벗 포인트 방식으로 일중 거래 핵심 가격 레벨을 자동 계산/표시하는 전문 지표입니다. 주요 기능: 피벗 포인트(PP) 자동 계산 3개의 저항 레벨(R1, R2, R3) 3개의 지지 레벨(S1, S2, S3) 전일 고가/저가 표시 실시간 정보 패널 상승/하락 바이어스 표시 최근 레벨까지 거리 표시 색상/표시 완전 사용자 설정 매일 자동 업데이트 모든 타임프레임 지원 계산 방식: 전일 고가/저가/종가 기반 클래식 피벗 포인트. 트레이딩 활용: 지지/저항 반등 매매 돌파 전략 레인지 거래 방향성 판단 목표가 설정 사용 방법: 차트에 인디케이터 적용 레벨 자동 생성 가격 > PP = 상승 바이어스 가격 < PP = 하락 바이어스 S1-S3 = 지지 구간 R1-R3 = 저항 구간 설정 옵션: 피벗/지지/저항 색상 라인 굵기/스타일 가격 라벨 표시/숨기기 정보 패널 ON/OFF 패널 위치/폰트 크기 전일 고가/저가 표
FREE
The indicator identifies when a divergence occurs between price and an indicator or oscillator. It identifies both regular and hidden divergences. Combined with your own rules and techniques, this indicator will allow you to create (or enhance) your own powerful system. For higher probability setups I can recommend you to use my Supply Demand indicator and trade only if the divergence occurs inside a zone. Supply zone for bearish div and demand zone for bullish div. The optimal scenario is if it
FREE
이 제품의 구매자들이 또한 구매함
이 지표를 구매하면 제 프로페셔널 트레이드 매니저를 무료로 드립니다. 우선 이 거래 시스템이 리페인팅, 리드로잉 및 레이그 인디케이터가 아니라는 점을 강조하는 것이 중요합니다. 이는 수동 및 로봇 거래 모두에 이상적인 것으로 만듭니다. 온라인 강좌, 설명서 및 프리셋 다운로드. "스마트 트렌드 트레이딩 시스템 MT5"은 새로운 및 경험이 풍부한 트레이더를 위해 맞춤형으로 제작된 종합적인 거래 솔루션입니다. 10개 이상의 프리미엄 인디케이터를 결합하고 7개 이상의 견고한 거래 전략을 특징으로 하여 다양한 시장 조건에 대한 다목적 선택이 가능합니다. 트렌드 추종 전략: 효과적인 트렌드 추이를 타기 위한 정확한 진입 및 손절 관리를 제공합니다. 반전 전략: 잠재적인 트렌드 반전을 식별하여 트레이더가 범위 시장을 활용할 수 있게 합니다. 스캘핑 전략: 빠르고 정확한 데이 트레이딩 및 단기 거래를 위해 설계되었습니다. 안정성: 모든 인디케이터가 리페인팅, 리드로잉 및 레이그가 아니므로 신뢰
Power Candles MT5
Daniel Stein
5 (2)
Power Candles – 모든 시장을 위한 강도 기반 진입 신호 Power Candles 는 Stein Investments의 검증된 강도 분석을 가격 차트에 직접 제공합니다. 가격 움직임에만 반응하는 대신, 각 캔들은 실제 시장 강도를 기준으로 색상화되어 모멘텀 형성, 강도 가속, 명확한 추세 전환을 즉시 파악할 수 있습니다. 모든 시장을 위한 단일 로직 Power Candles는 모든 거래 심볼 에서 자동으로 작동합니다. 현재 심볼이 Forex인지 비-Forex 시장인지 자동으로 감지하여 내부적으로 적절한 강도 모델을 적용합니다. Forex 및 Gold 는 FX Power Delta 값을 사용합니다 (절대값 범위 최대 100) 지수, 크립토 및 CFD 는 IX Power Strength 값을 사용합니다 (절대값 범위 최대 50) 필요한 강도 계산은 Power Candles에 완전히 내장되어 있습니다. 캔들 색상이나 신호 로직을 위해 추가 인디케이터는 필요하지 않습니다. 가격
Divergence Bomber
Ihor Otkydach
4.96 (76)
이 지표를 구매하신 분께는 다음과 같은 혜택이 무료로 제공됩니다: 각 거래를 자동으로 관리하고, 손절/익절 수준을 설정하며, 전략 규칙에 따라 거래를 종료하는 전용 도우미 툴 "Bomber Utility" 다양한 자산에 맞게 지표를 설정할 수 있는 셋업 파일(Set Files) "최소 위험", "균형 잡힌 위험", "관망 전략" 모드로 설정 가능한 Bomber Utility의 셋업 파일 이 전략을 빠르게 설치, 설정, 시작할 수 있도록 돕는 단계별 영상 매뉴얼 주의: 위의 모든 보너스를 받기 위해서는 MQL5 개인 메시지 시스템을 통해 판매자에게 연락해 주세요. 독창적인 커스텀 지표인 “Divergence Bomber(다이버전스 봄버)”를 소개합니다. 이 지표는 MACD 다이버전스(괴리) 전략을 기반으로 한 올인원(All-in-One) 거래 시스템입니다. 이 기술 지표의 주요 목적은 가격과 MACD 지표 간의 다이버전스를 감지하고, **향후 가격이 어느 방향으로 움직일지를 알려주는
Entry In The Zone and SMC Multi Timeframe 은 Smart Money Concepts(SMC)를 기반으로 개발된 실시간 시장 분석 도구입니다. 이 시스템은 트레이더가 시장 구조를 체계적으로 분석하고 전체적인 시장 방향을 더욱 명확하게 파악할 수 있도록 설계되었습니다. 시스템은 여러 시간대에서 반전 포인트(Reversal Points), 핵심 구역(Key Zones), 그리고 시장 구조(Market Structure)를 자동으로 분석하며, POI(Point of Interest), 노 리페인트(No Repaint) 신호, 자동 피보나치 레벨(Auto Fibonacci Levels)을 표시하여 되돌림(Pullback)과 반전 포인트를 정확하게 탐지할 수 있도록 돕습니다. 또한 실시간 신호와 알림을 통해 가격이 핵심 구역에 진입하거나 해당 구역에서 반전 신호가 발생하는 순간을 놓치지 않도록 보조합니다. 더불어 이 시스템은 인디케이터와 신호 시스템을 하나로
FX Power MT5 NG
Daniel Stein
5 (28)
FX Power: 통화 강세 분석으로 더 스마트한 거래 결정을 개요 FX Power 는 어떤 시장 상황에서도 주요 통화와 금의 실제 강세를 이해하기 위한 필수 도구입니다. 강한 통화를 매수하고 약한 통화를 매도함으로써 FX Power 는 거래 결정을 단순화하고 높은 확률의 기회를 발견합니다. 트렌드를 따르거나 극단적인 델타 값을 사용해 반전을 예측하고자 한다면, 이 도구는 귀하의 거래 스타일에 완벽히 적응합니다. 단순히 거래하지 말고, FX Power 로 더 스마트하게 거래하세요. 1. FX Power가 거래자에게 매우 유용한 이유 통화와 금의 실시간 강세 분석 • FX Power 는 주요 통화와 금의 상대적 강세를 계산하고 표시하여 시장 역학에 대한 명확한 통찰력을 제공합니다. • 어떤 자산이 앞서고 있고 어떤 자산이 뒤처지는지 모니터링하여 보다 현명한 거래 결정을 내릴 수 있습니다. 포괄적인 멀티 타임프레임 뷰 • 단기, 중기 및 장기 타임프레임에서 통화와 금의 강세를
Atomic Analyst MT5
Issam Kassas
4.19 (27)
우선적으로 언급할 점은이 거래 지표가 다시 그리지 않고 지연되지 않으며 이를 통해 수동 및 로봇 거래 모두에 이상적이라는 점입니다. 사용자 매뉴얼: 설정, 입력 및 전략. Atomic Analyst는 가격의 강도와 모멘텀을 활용하여 시장에서 더 나은 이점을 찾는 PA Price Action Indicator입니다. 고급 필터를 장착하여 잡음과 거짓 신호를 제거하고 거래 잠재력을 높이는 데 도움이 됩니다. 복잡한 지표의 다중 레이어를 사용하여 Atomic Analyst는 차트를 스캔하고 복잡한 수학적 계산을 간단한 신호와 색상으로 변환하여 초보 트레이더가 이해하고 일관된 거래 결정을 내릴 수 있도록합니다. "Atomic Analyst"는 새로운 및 경험이 풍부한 트레이더를위한 종합적인 거래 솔루션입니다. 프리미엄 지표와 최고 수준의 기능을 하나의 거래 전략에 결합하여 모든 종류의 트레이더에 대한 다재다능한 선택지가되었습니다. 인트라데이 거래 및 스캘핑 전략 : 빠르고 정확한 일일
Game Changer Indicator mt5
Vasiliy Strukov
5 (6)
Game Changer는 모든 금융 상품에 사용하도록 설계된 혁신적인 추세 지표로, 메타트레이더를 강력한 추세 분석기로 탈바꿈시켜 줍니다. 이 지표는 재작성이나 지연 현상이 발생하지 않습니다. 모든 시간대에서 작동하며 추세 파악을 지원하고, 잠재적 반전 신호를 제공하며, 트레일링 스톱 메커니즘으로 활용되고, 신속한 시장 반응을 위한 실시간 알림을 제공합니다. 숙련된 투자자, 전문가, 또는 우위를 점하려는 초보자 등 누구나 이 도구를 통해 자신감과 원칙을 바탕으로, 그리고 근본적인 추세 역학에 대한 명확한 이해를 바탕으로 거래할 수 있습니다. 구매 후 바로 연락 주시면 개인 보너스를 드립니다! 강력한 지지선과 추세 스캐너 지표를 무료로 받으실 수 있습니다. 개인 메시지로 알려주세요 저는 텔레그램에서 EA나 특별 세트를 판매하지 않습니다. Mql5에서만 사용 가능하며, 세트 파일은 제 블로그에서만 볼 수 있습니다 . 사기꾼을 조심하시고 다른 사람에게서 세트를 구매하지 마세요 설정 추세
Gold Sniper Scalper Pro
Ich Khiem Nguyen
3.29 (7)
Gold Sniper Scalper Pro - MetaTrader 5 용 골드 (XAU/USD) 트레이딩 시스템 진지한 트레이더를 위한: 여러 시장 분석 요소를 결합한 구조화되고 데이터 중심적인 방법론으로 골드 거래에 접근하세요. 이 도구는 귀하의 골드 거래 분석을 지원하도록 제작되었습니다. 한정 가격 기회 이것은 가격이 오르기 전에 Gold Sniper Scalper Pro를 소유할 기회입니다. 제품 가격은 이후 10회 구매마다 $50씩 인상됩니다. 최종 가격: $498 분석적 우위를 정의하는 기능 Gold Sniper Scalper Pro는 깊은 통찰력과 명확한 통계적 이점을 제공하도록 설계된 포괄적인 도구 키트입니다: 시스템, 입력 사용자 지정 및 지표 사용 시 주의사항을 포함한 상세 지표 사용 가이드는 아래 MQL 게시물에 제시되어 있습니다. 해당 문서를 참조하십시오. Gold Sniper Scalper Pro - Gold (XAU/USD) Trading System on
Trend Screener Pro MT5
STE S.S.COMPANY
4.84 (99)
트렌드 표시기, 트렌드 트레이딩 및 필터링을 위한 획기적인 고유 솔루션, 하나의 도구 안에 내장된 모든 중요한 트렌드 기능! Forex, 상품, 암호 화폐, 지수 및 주식과 같은 모든 기호/도구에 사용할 수 있는 100% 다시 칠하지 않는 다중 시간 프레임 및 다중 통화 표시기입니다. Trend Screener는 차트에 점이 있는 화살표 추세 신호를 제공하는 효율적인 지표 추세 추종 지표입니다. 추세 분석기 표시기에서 사용할 수 있는 기능: 1. 트렌드 스캐너. 2. 최대 이익 분석이 있는 추세선. 3. 추세 통화 강도 측정기. 4. 경고가 있는 추세 반전 점. 5. 경고가 있는 강력한 추세 점. 6. 추세 화살표 Trend Screener Indicator가 있는 일일 분석 예, 일일 신호 성능...등은 여기에서 찾을 수 있습니다. 여기를 클릭하십시오. LIMITED TIME OFFER : Trend Screener Indicator는 50$ 및 평생 동안만 사용할 수 있습니다.
Smart Stop Indicator – 차트 위에서 직접 작동하는 지능형 스톱로스 시스템 개요 Smart Stop Indicator는 감이나 추측이 아닌 명확하고 체계적인 방식으로 스톱로스를 설정하고 싶은 트레이더를 위한 맞춤형 솔루션입니다. 이 도구는 클래식 프라이스 액션 논리(고점, 저점 구조)와 현대적인 브레이크아웃 인식을 결합하여 실제로 가장 논리적인 다음 스톱 레벨을 정확히 식별합니다. 추세, 박스권, 빠른 브레이크아웃 상황 등 어떤 시장에서도 인디케이터는 최적의 SL 구역과 상태(“new”, “broken”, “valid”)를 차트에 직접 표시합니다. 새로운 기능으로 SL 거리의 %ADR 표시가 추가되었습니다. 핵심 기능 자동 시장구조 기반 스톱 설정 • 시장 구조와 실시간 가격 움직임을 기반으로 의미 있는 스톱로스 레벨을 자동으로 탐지합니다. 스마트 브레이크아웃 감지 • 빠른 방향 변화나 돌파 상황에서도 불필요한 조기 스톱 조정을 강요하지 않으며 유연하게 반응합
Azimuth Pro
Ottaviano De Cicco
5 (1)
LAUNCH PROMO Azimuth Pro price is initially set at 299 $ for the first 100 buyers. Final price will be 499 $ . THE DIFFERENCE BETWEEN RETAIL AND INSTITUTIONAL ENTRIES ISN'T THE INDICATOR — IT'S THE LOCATION. Most traders enter at arbitrary price levels, chasing momentum or reacting to lagging signals. Institutions wait for price to reach structured levels where supply and demand actually shift. Azimuth Pro maps these levels automatically: swing-anchored VWAP, multi-timeframe structure lines,
FX Levels MT5
Daniel Stein
5 (12)
FX Levels: 모든 시장을 위한 뛰어난 정확도의 지지와 저항 간단 요약 통화쌍, 지수, 주식, 원자재 등 어떤 시장이든 믿을 만한 지지·저항 레벨을 찾고 싶나요? FX Levels 는 전통적인 “Lighthouse” 기법과 첨단 동적 접근을 결합해, 거의 보편적인 정확성을 제공합니다. 실제 브로커 경험을 반영하고, 자동화된 일별 업데이트와 실시간 업데이트를 결합함으로써 FX Levels 는 가격 반전 포인트를 파악하고, 수익 목표를 설정하며, 자신 있게 트레이드를 관리할 수 있게 돕습니다. 지금 바로 시도해 보세요—정교한 지지/저항 분석이 어떻게 여러분의 트레이딩을 한 단계 끌어올릴 수 있는지 직접 확인하세요! 1. FX Levels가 트레이더에게 매우 유용한 이유 뛰어난 정확도의 지지·저항 존 • FX Levels 는 다양한 브로커 환경에서도 거의 동일한 존을 생성하도록 설계되어, 데이터 피드나 시간 설정 차이로 인한 불일치를 해소합니다. • 즉, 어떤 브로커를 사용하
Trend indicator AI mt5
Ramil Minniakhmetov
5 (13)
트렌드 인공 지능 지표는 실행 가능한 진입 점 및 반전 경고와 추세 식별을 결합하여 상인의 시장 분석을 향상시킬 훌륭한 도구입니다. 이 표시기는 사용자가 자신감과 정밀도로 외환 시장의 복잡성을 탐색 할 수 있도록 지원합니다 기본 신호 외에도 트렌드 인공 지능 지표는 풀백 또는 되돌림 중에 발생하는 2 차 진입 점을 식별하여 거래자가 기존 트렌드 내에서 가격 수정을 활용할 수 있도록합니다. 중요한 장점: ·작동 4 및 5 *명확한 구매 또는 판매 신호 *다시 칠하지 않습니다 *모든 자산에서 작동 나는 전보 사기에 개 또는 세트를 판매하지 않도록주의. 모든 설정은 블로그에 여기에 무료.  중요! 지침 및 보너스를 얻기 위해 구입 후 즉시 저에게 연락! 진짜 가동 감시는 뿐 아니라 나의 다른 제품 여기에서 찾아낼 수 있습니다: https://www.mql5.com/en/users/mechanic/seller&nbsp ; 설정 및 입력: 모든 자산에 대해 기본 설정을 권
Quantum TrendPulse
Bogdan Ion Puscasu
5 (20)
SuperTrend   ,   RSI   ,   Stochastic   의 힘을 하나의 포괄적인 지표로 결합하여 트레이딩 잠재력을 극대화하는 궁극의 트레이딩 도구   인 Quantum TrendPulse를   소개합니다. 정밀성과 효율성을 추구하는 트레이더를 위해 설계된 이 지표는 시장 추세, 모멘텀 변화, 최적의 진입 및 종료 지점을 자신 있게 식별하는 데 도움이 됩니다. 주요 특징: SuperTrend 통합:   주요 시장 추세를 쉽게 따라가고 수익성의 물결을 타세요. RSI 정밀도:   매수 과다 및 매도 과다 수준을 감지하여 시장 반전 시점을 파악하는 데 적합하며 SuperTrend 필터로 사용 가능 확률적 정확도:   변동성이 큰 시장에서 숨겨진 기회를 찾기 위해 확률적 진동   을 활용하고 SuperTrend의 필터로 사용 다중 시간대 분석:   M5부터 H1 또는 H4까지 다양한 시간대에 걸쳐 시장을 최신 상태로 유지하세요. 맞춤형 알림:   맞춤형 거래 조건이 충족되면
IX Power MT5
Daniel Stein
4.92 (12)
IX Power: 지수, 원자재, 암호화폐 및 외환 시장 통찰력을 발견하세요 개요 IX Power 는 지수, 원자재, 암호화폐 및 외환 시장의 강도를 분석할 수 있는 다목적 도구입니다. FX Power 는 모든 가용 통화 쌍 데이터를 사용하여 외환 쌍에 대해 가장 높은 정확도를 제공하는 반면, IX Power 는 기초 자산 시장 데이터에만 초점을 맞춥니다. 이로 인해 IX Power 는 비외환 시장에 이상적이며, 다중 쌍 분석이 필요하지 않은 간단한 외환 분석에도 신뢰할 수 있는 도구입니다. 모든 차트에서 매끄럽게 작동하며, 거래 결정을 향상시키기 위한 명확하고 실행 가능한 통찰력을 제공합니다. 1. IX Power가 트레이더에게 유용한 이유 다양한 시장 강도 분석 • IX Power 는 지수, 원자재, 암호화폐 및 외환 심볼의 강도를 계산하여 각 시장에 맞는 통찰력을 제공합니다. • US30, WTI, 금, 비트코인 또는 통화 쌍과 같은 자산을 모니터링하여 거래 기회를 발견
우선적으로, 이 거래 도구는 전문적인 거래에 이상적인 비-다시 그리기 및 지연되지 않는 지표입니다.  온라인 강좌, 사용자 매뉴얼 및 데모. 스마트 가격 액션 컨셉트 인디케이터는 신규 및 경험 많은 트레이더 모두에게 매우 강력한 도구입니다. Inner Circle Trader Analysis 및 Smart Money Concepts Trading Strategies와 같은 고급 거래 아이디어를 결합하여 20가지 이상의 유용한 지표를 하나로 결합합니다. 이 인디케이터는 스마트 머니 컨셉트에 중점을 두어 대형 기관의 거래 방식을 제공하고 이동을 예측하는 데 도움을 줍니다.  특히 유동성 분석에 뛰어나 기관이 어떻게 거래하는지 이해하는 데 도움을 줍니다. 시장 트렌드를 예측하고 가격 변동을 신중하게 분석하는 데 탁월합니다. 귀하의 거래를 기관 전략에 맞추어 시장의 동향에 대해 더 정확한 예측을 할 수 있습니다. 이 인디케이터는 시장 구조를 분석하고 중요한 주문 블록을 식별하고 다양
Grabber System MT5
Ihor Otkydach
4.81 (21)
탁월한 기술적 지표인 Grabber를 소개합니다. 이 도구는 즉시 사용 가능한 “올인원(All-Inclusive)” 트레이딩 전략으로 작동합니다. 하나의 코드 안에 강력한 시장 기술 분석 도구, 매매 신호(화살표), 알림 기능, 푸시 알림이 통합되어 있습니다. 이 인디케이터를 구매하신 모든 분들께는 다음의 항목이 무료로 제공됩니다: Grabber 유틸리티: 오픈 포지션을 자동으로 관리하는 도구 단계별 영상 매뉴얼: 설치, 설정, 그리고 실제 거래 방법을 안내 맞춤형 세트 파일: 인디케이터를 빠르게 자동 설정하여 최고의 성과를 낼 수 있도록 도와줍니다 다른 전략은 이제 잊어버리세요! Grabber만이 여러분을 새로운 트레이딩의 정점으로 이끌어 줄 수 있습니다. Grabber 전략의 주요 특징: 거래 시간 프레임: M5부터 H4까지 거래 가능한 자산: 어떤 자산이든 사용 가능하지만, 제가 직접 테스트한 종목들을 추천드립니다 (GBPUSD, GBPCAD, GBPCHF, AUDCAD, AU
SynaptixQuant Dominance Matrix
Devie Arevalo Montemayor
5 (1)
SynaptixQuant Dominance Matrix: Institutional-Grade Market State Extraction Engineered for traders who require a data-driven view of market behaviour beyond surface-level indicators. The Synaptix Quant (SQ) Dominance Matrix is not a conventional currency strength display. Behind its intentionally streamlined interface runs a sophisticated analytical architecture designed to quantify market conditions with precision. Every output is generated through layered signal processing built to identify d
- Real price is 80$ - 45% Discount (It is 45$ now) Contact me for extra bonus   indicator, instruction or any questions! - Lifetime update free - Non-repaint - Related product: Gann Gold EA - I just sell my products in Elif Kaya Profile, any other websites are stolen old versions, So no any new updates or support. Advantages of  M1 Scalper Pro  Profitability: M1 Scalper Pro is highly profitable with a strict exit strategy. Frequent Opportunities: M1 Scalper Pro  takes advantage of numerous smal
Meravith AUTO
Ivan Stefanov
5 (1)
Meravith Auto는 Meravith 거래 시스템의 자동화 버전입니다. 이 지표는 색상이 변하는 추세선으로 구성되어 있습니다. 상승 추세일 때는 녹색, 하락 추세일 때는 빨간색입니다. 이것이 추세 지지선입니다. 상승 거래량과 하락 거래량이 같은 유동성 라인. 세 배 상승 편차 라인. 세 배 하락 편차 라인. 높은 거래량을 나타내는 보라색 및 파란색 점. 보라색 점은 평균 거래량보다 2편차 큰 거래량을 나타내며, 파란색 점은 2편차를 나타냅니다. 사용 방법은? 상승 추세선과 추세선 위의 유동성은 상승 추세를 나타냅니다. 시장이 상승할 것으로 예상됩니다. 롱 포지션을 엽니다. 하락 추세선과 추세선 아래의 유동성은 하락 추세를 나타냅니다. 시장이 하락할 것으로 예상됩니다. 숏 포지션을 엽니다. 다른 지표와 자유롭게 조합하여 사용할 수 있습니다. 모든 통화쌍과 모든 시간대에서 사용할 수 있습니다. 브로커마다 표시하는 거래량이 다르기 때문에 결과가 다를 수 있습니다. 거래량이 많은 대형
ARIPoint
Temirlan Kdyrkhan
1 (1)
ARIPoint is a powerful trading companion designed to generate high-probability entry signals with dynamic TP/SL/DP levels based on volatility. Built-in performance tracking shows win/loss stats, PP1/PP2 hits, and success rates all updated live. Key Features: Buy/Sell signals with adaptive volatility bands Real-time TP/SL/DP levels based on ATR Built-in MA Filter with optional ATR/StdDev volatility Performance stats panel (Success, Profit/Loss, PP1/PP2) Alerts via popup, sound, push, or email Cu
Trend Forecaster
Alexey Minkov
5 (7)
The Trend Forecaster indicator utilizes a unique proprietary algorithm to determine entry points for a breakout trading strategy. The indicator identifies price clusters, analyzes price movement near levels, and provides a signal when the price breaks through a level. The Trend Forecaster indicator is suitable for all financial assets, including currencies (Forex), metals, stocks, indices, and cryptocurrencies. You can also adjust the indicator to work on any time frames, although it is recommen
Gartley Hunter Multi
Siarhei Vashchylka
5 (11)
Gartley Hunter Multi - An indicator for searching for harmonic patterns simultaneously on dozens of trading instruments and on all possible timeframes. Manual (Be sure to read before purchasing) | Version for MT4 Advantages 1. Patterns: Gartley, Butterfly, Shark, Crab. Bat, Alternate Bat, Deep Crab, Cypher 2. Simultaneous search for patterns on dozens of trading instruments and on all possible timeframes 3. Search for patterns of all possible sizes. From the smallest to the largest 4. All fou
FX Volume MT5
Daniel Stein
4.79 (24)
FX Volume: 브로커 시각에서 바라보는 진짜 시장 심리 간단 요약 트레이딩 접근 방식을 한층 더 향상시키고 싶으신가요? FX Volume 는 소매 트레이더와 브로커의 포지션을 실시간으로 파악할 수 있게 해 줍니다. 이는 COT 같은 지연된 보고서보다 훨씬 빠릅니다. 꾸준한 수익을 추구하는 분이든, 시장에서 더 깊은 우위를 원하시는 분이든, FX Volume 을 통해 대규모 불균형을 찾아내고, 돌파 여부를 확인하며 리스크 관리를 정교화할 수 있습니다. 지금 시작해 보세요! 실제 거래량 데이터가 의사결정을 어떻게 혁신할 수 있는지 직접 경험해 보시기 바랍니다. 1. 트레이더에게 FX Volume이 매우 유익한 이유 탁월한 정확도를 지닌 조기 경보 신호 • 다른 사람들보다 훨씬 앞서, 각 통화쌍을 매수·매도하는 트레이더 수를 거의 실시간으로 파악할 수 있습니다. • FX Volume 은 여러 리테일 브로커에서 추출한 실제 거래량 데이터를 종합해 명확하고 편리한 형태로 제공하는
Trend Flow PRO
Aliaksandr Alferchyk
TREND FLOW PRO 는 시장이 실제로 방향을 전환하는 지점을 식별하는 데 도움을 줍니다. 이 인디케이터는 추세 반전과 주요 시장 참여자들이 재진입하는 구간을 표시합니다. 차트의 BOS 표시는 실제 추세 전환과 상위 타임프레임의 핵심 레벨을 나타냅니다. 인디케이터 데이터는 리페인트되지 않으며, 각 봉이 마감된 후에도 차트에 그대로 유지됩니다. 인디케이터 주요 요소: BOS FLOW – 추세 파동과 실제 추세 변화. 주요 시장 참여자의 진입과 그 존재에 대한 확인을 의미합니다(숫자로 표시). BOS FILL – 추세 방향에 따라 캔들을 색칠합니다. ‘큰손’의 진입 구간과 추세가 전환되는 지점을 표시합니다. 신호 레벨: BOS – 강도가 명확하지 않은 참여자의 진입(주 추세 내 조정인 경우가 많음). Move SL – 주요 참여자가 포지션을 이동시키는 과정을 시각적으로 표현합니다. 트레이더가 손절선을 조정할 때 참고 지표로 사용할 수 있습니다. Super BOS – 일반 BOS보다
ACB Breakout Arrows MT5
KEENBASE SOFTWARE SOLUTIONS
5 (1)
ACB Breakout Arrows 지표는 특별한 돌파 패턴을 감지하여 시장에서 중요한 진입 신호를 제공합니다. 이 지표는 차트를 지속적으로 스캔하면서 한 방향으로 움직임이 자리 잡을 때를 포착하여 큰 움직임 직전에 정확한 진입 신호를 제공합니다. 다중 종목 및 다중 시간대 스캐너는 여기에서 확인하세요 - ACB Breakout Arrows MT5용 스캐너 핵심 기능 지표가 자동으로 손절(Stop Loss) 및 익절(Take Profit) 수준을 제공합니다. 모든 시간대의 돌파 신호를 추적하는 MTF 스캐너 대시보드 포함. 데이 트레이더, 스윙 트레이더 및 스캘퍼에게 적합합니다. 신호 정확도를 높이기 위해 최적화된 알고리즘 사용. 손익분기점 또는 빠른 수익 목표를 위한 특별한 라인 (Quick Profit Line) 제공. 승률, 성공 비율, 평균 수익 등의 성과 분석 지표 제공. 재도색 없음. 신호는 고정되어 신뢰할 수 있습니다. 거래 확인 - ACB Trade Filter 지
Matrix Arrow Indicator MT5
Juvenille Emperor Limited
5 (17)
매트릭스 화살표 표시기 MT5 는 외환, 상품, 암호 화폐, 지수, 주식과 같은 모든 기호/도구에 사용할 수 있는 100% 다시 칠하지 않는 다중 기간 표시기를 따르는 고유한 10 in 1 추세입니다.  Matrix Arrow Indicator MT5 는 다음과 같은 최대 10개의 표준 지표에서 정보와 데이터를 수집하여 초기 단계에서 현재 추세를 결정합니다. 평균 방향 이동 지수(ADX) 상품 채널 지수(CCI) 클래식 하이켄 아시 캔들 이동 평균 이동 평균 수렴 발산(MACD) 상대 활력 지수(RVI) 상대 강도 지수(RSI) 포물선 SAR 스토캐스틱 오실레이터 윌리엄스의 백분율 범위 모든 지표가 유효한 매수 또는 매도 신호를 제공하면 강력한 상승/하락 추세를 나타내는 다음 캔들/막대가 시작될 때 해당 화살표가 차트에 인쇄됩니다. 사용자는 사용할 표시기를 선택하고 각 표시기의 매개변수를 개별적으로 조정할 수 있습니다. 매트릭스 화살표 표시기 MT5는 선택한 표시기에서만 정보를 수
Gold Entry Sniper
Tahir Mehmood
5 (1)
Gold Entry Sniper – 골드 스캘핑 & 스윙 트레이딩을 위한 전문 다중 시간 프레임 ATR 대시보드 Gold Entry Sniper 는 XAUUSD 및 기타 종목에 대해 정확한 매수/매도 신호 를 제공하는 고급 MetaTrader 5 지표입니다. ATR 트레일링 스톱 로직 과 다중 시간 프레임 분석 을 기반으로 설계되어 스캘핑과 스윙 트레이딩 모두에 적합합니다. 주요 기능 및 장점 다중 시간 프레임 분석 – M1, M5, M15 추세를 한눈에 확인. ATR 기반 트레일링 스톱 – 변동성에 따라 자동 조정. 전문 차트 대시보드 – 신호 상태, ATR 레벨, 회귀선, 매매 방향 표시. 명확한 매수/매도 마커 – 자동 화살표와 텍스트 라벨. 종료 알림 & 거래 관리 – 수익 보호를 위한 자동 종료 감지. 완전 사용자 설정 가능 – 대시보드 위치, 색상, ATR/회귀선 파라미터 조정. 골드(XAUUSD) 최적화 – M1~M15 스캘핑에 완벽, 외환/지수/암호화폐에도 적용 가능.
TrendLine PRO MT5
Evgenii Aksenov
4.67 (33)
The Trend Line PRO indicator is an independent trading strategy. It shows the trend change, the entry point to the transaction, as well as automatically calculates three levels of Take Profit and Stop Loss protection. Trend Line PRO is perfect for all Meta Trader symbols: currencies, metals, cryptocurrencies, stocks and indices. The indicator is used in trading on real accounts, which confirms the reliability of the strategy. Robots using   Trend Line PRO   and real Signals can be found here: 
Market Structure Order Block Dashboard MT5 Market Structure Order Block Dashboard MT5 는 MetaTrader 5용 인디케이터로, 시장 구조 및 ICT / Smart Money 개념 분석을 자동화합니다. 이 제품은 포지션을 열지 않으며 주문을 관리하지도 않습니다. 즉, 자동매매 로봇이 아니라 시각적 분석 도구 입니다. 인디케이터가 표시하는 내용 인디케이터는 차트를 스캔하여 다음 정보를 강조 표시합니다 : 시장 구조 : 주요 스윙, HH, HL, LH, LL 구조 돌파 : Break of Structure (BOS) 및 Change of Character (ChoCH) 상승(demand) / 하락(supply) Order Blocks, 강도 표시 포함 유효한 Fair Value Gaps (FVG) 유동성 구간(equal highs / equal lows) 및 스윕(sweeps) 아시아, 런던, 뉴욕 세션 및 Kill
필터:
리뷰 없음
리뷰 답변