Session Controll

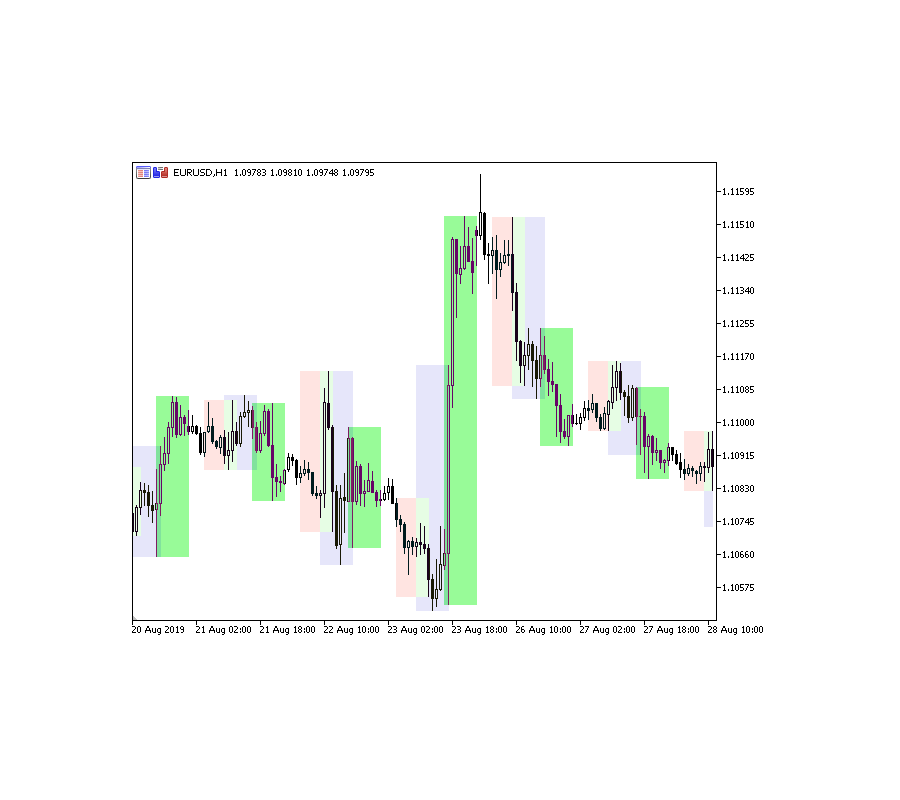
The "Session Control" indicator is designed to display trading sessions on a price chart. This allows the trader to see at what points of activity the most important trading sessions occur: Pacific, European, American and Asian. Each of these sessions is characterized by a certain volatility and activity in the market, which is important for making trading decisions.

Peculiarities:
  1. Displaying sessions: The indicator shows time periods on the price chart corresponding to different trading sessions. This helps the trader navigate time and see when key sessions begin and end.
  2. Time Setting: You can easily set the start and end time of each trading session according to your time zone and preferences. This allows you to personalize the indicator to suit your trading schedule.
  3. Four main sessions: The indicator displays four main trading sessions: Pacific, European, American and Asian. Each of them has its own characteristics and influence on market activity.
Usage:
Session visualization:
  • Pacific session: Often characterized by quieter trading and less volatility.
  • European session: Begins after the end of the Asian session and is accompanied by active movements in the market.
  • American session: One of the most volatile periods when significant price changes occur.
  • Asian session: Often characterized by more moderate trading, sideways movement is common.
Time setting:
You can set the start and end time of each trading session in the indicator settings. For example:
  • Pacific: 00:00 - 07:00
  • European: 07:00 - 15:00
  • American: 15:00 - 22:00
  • Asian: 22:00 - 00:00
Options to configure:
  • Pacific session: beginning and end.
  • European session: beginning and end.
  • American session: beginning and end.
  • Asian session: beginning and end.

Recommendations for use:

Use the "Session Control" indicator to navigate in time and select the most active periods for trading.
When analyzing a price chart, pay attention to volatility and activity during various trading sessions.
Adjust the time parameters of the indicator according to your preferences and time zone.
The "Session Control" indicator will help you plan and carry out trading on the Forex market more effectively, taking into account the characteristics of various trading sessions.


추천 제품
VR Grid Mt5
Vladimir Pastushak
3.25 (8)
VR 그리드 표시기는 사용자 정의 설정으로 그래픽 그리드를 생성하도록 설계 되었습니다. 표준 그리드 와 달리 VR 그리드는 원형 레벨 을 구축하는 데 사용됩니다. 사용자의 선택에 따라 라운드 수준 사이의 단계는 임의적일 수 있습니다. 또한 VR Grid는 다른 인디케이터나 유틸리티와는 달리 기간이 바뀌거나 단말기를 재부팅해도 그리드의 위치 를 유지합니다. 설정, 세트 파일, 데모 버전, 지침, 문제 해결 등은 다음에서 얻을 수 있습니다. [블로그] 다음에서 리뷰를 읽거나 작성할 수 있습니다. [링크] 버전 [MetaTrader 4] 수직 수준 은 실제 시간 간격을 기준으로 하며 누락 또는 존재하지 않는 기간은 무시 합니다. 따라서 레벨 사이의 단계는 사용자가 선택한 값과 엄격하게 일치합니다. VR 그리드 표시기를 사용할 때 트레이더는 모든 수준에서 스타일 , 수직선 및 수평선의 색상 및 두께를 변경할 수 있습니다. 이를 통해 금융 상품의 라운드 수준 을 제어할 수 있습니다. 라운
FREE
표시기는 현재 시세를 작성하여 과거 시세와 비교할 수 있으며 이를 바탕으로 가격 변동을 예측합니다. 표시기에는 원하는 날짜로 빠르게 이동할 수 있는 텍스트 필드가 있습니다. 옵션: 기호 - 표시기가 표시할 기호 선택. SymbolPeriod - 지표가 데이터를 가져올 기간 선택. IndicatorColor - 표시기 색상. HorisontalShift - 지시자가 그린 따옴표를 지정된 막대 수만큼 이동합니다. Inverse - true는 인용 부호를 반대로, false - 원래 보기를 반전합니다. ChartVerticalShiftStep - 차트를 수직으로 이동합니다(키보드의 위/아래 화살표). 다음은 날짜를 입력할 수 있는 텍스트 필드의 설정으로, '엔터'를 누르면 즉시 이동할 수 있습니다.
Order Book, known also as Market Book, market depth, Level 2, - is a dynamically updated table with current volumes of orders to buy and to sell specific financial instument at price levels near Bid and Ask. MetaTrader 5 provides the means for receiving market book from your broker, but in real time only, without access to its history. The indicator OrderBook Cumulative Indicator accumulates market book data online and visualizes them on the chart. In addition, the indicator can show the market
Blahtech Market Profile MT5
Blahtech Limited
5 (10)
Was: $249  Now: $99   Market Profile defines a number of day types that can help the trader to determine market behaviour. A key feature is the Value Area, representing the range of price action where 70% of trading took place. Understanding the Value Area can give traders valuable insight into market direction and establish the higher odds trade. It is an excellent addition to any system you may be using. Inspired by Jim Dalton’s book “Mind Over Markets”, this indicator is designed to suit the
Haven Volume Profile
Maksim Tarutin
4.63 (8)
Haven Volume Profile은 거래량 분포를 기반으로 중요한 가격 수준을 식별하는 데 도움이 되는 다기능 볼륨 프로파일 분석 지표입니다. 시장을 더 잘 이해하고 중요한 진입 및 퇴장 지점을 식별하려는 전문 트레이더를 위해 설계되었습니다. 기타 제품 ->  여기 주요 기능: Point of Control (POC) 계산 - 최대 거래 활동 수준으로, 가장 유동성이 높은 수준을 식별하는 데 도움이 됩니다 Value Area 정의 (높은 활동 영역) 및 사용자 지정 가능한 거래량 비율로 거래 범위를 보다 정확하게 평가할 수 있습니다 틱 거래량과 실제 거래량 모두 지원, 다양한 시장 유형과 거래 전략에 적합 계산 기간(일 수)의 유연한 설정으로 모든 시간 프레임에 도구를 적용할 수 있습니다 터미널의 밝은 테마와 어두운 테마에 자동 적응하여 사용자 인터페이스의 시각적 경험을 향상시킵니다 레벨 시각화가 명확하고 스타일과 색상을 사용자 지정할 수 있어 빠른 의사 결정을 돕습니다 이 지표
FREE
개요 멀티 레벨 ATR 및 이동 평균 밴드 지표는 거래자들이 시장 트렌드, 지지 및 저항 수준, 변동성을 명확히 식별할 수 있도록 도와주는 강력한 도구입니다. 이 지표는 여러 이동 평균을 ATR(평균 진폭 범위) 배수와 결합하여 가격 움직임 주위에 시각적으로 구별되는 밴드를 생성합니다. 이를 통해 거래자는 잠재적인 반전 지점, 트렌드 상태 및 시장 통합 영역을 식별할 수 있습니다. 기능 다중 밴드 표시: 가격의 최고, 중간, 최저 이동 평균 및 ATR 계산에서 파생된 6개의 동적 밴드를 색상으로 구분하여 트렌드를 쉽게 식별할 수 있도록 합니다 (빨간색, 주황색, 노란색, 녹색, 파란색, 보라색). ATR 변동성 밴드: ATR 배수를 사용하여 변동성에 따라 밴드를 조정하고, 잠재적인 가격 반전 또는 지속을 명확히 시각화합니다. 조정 가능한 매개변수: 다양한 시장 조건 및 거래 전략에 맞게 ATR 배수와 이동 평균 기간을 완전히 조정할 수 있습니다. 트렌드 식별의 명확성: 밴드는 변동성
FREE
FDP Strong Point new
Yauheni Dashevich
This indicator shows a candle combination based on dodge, dodge and pin bar. The logic of the pattern is to stand on the side of strength, after uncertainty. The indicator is universal and is useful for trading binary options, forex, ETFs, cryptocurrency, stocks. The indicator supports timeframes from M5 to MN, including non-standard TF presented in MT5. (М5,М6,М10,M12, M15, M20, M30, H1, H2, H3, H4, H6, H8, H12, D1, W1, MN). The ability to enable and disable TF is implemented. Sound alerts and
##   ONLY GOLD ##   Тiльки Золото ## **Mercaria Professional Trading Zones - Complete Guide** ## **Mercaria Professional Trading Zones - Повний посібник** ### **How Mercaria Zones Work / Як працюють зони Mercaria** **English:** Mercaria Zones is an advanced trading indicator that identifies high-probability support and resistance areas using ZigZag extremes combined with mathematical zone calculations. The indicator works on multiple timeframes simultaneously, providing a comprehensive view
Supply Demand areas
Makarii Gubaydullin
공급/수요 구역: 과거에 가격이 여러 번 접근한 관찰 가능한 영역. 다기능 유틸리티:  66+ 기능 , 이 인디케이터 포함  |   문의 사항이 있으면 저에게 연락  하세요  |  MT4 버전 이 인디케이터는 가격이 다시 반전될 수 있는 위치를 보여줍니다. 일반적으로 가격이 해당 수준에서 거부된 횟수가 많을수록 그 수준은 더 중요합니다. 입력 설정에서   다음 사항을 조정할 수 있습니다: 약한 구역 을 활성화 또는 비활성화합니다; 구역 설명 을 표시하거나 숨깁니다; 글꼴 크기;   기본 색상 설정:   서포트와 저항 각각에 대해 별도로: 선택한 색상은 약한 구역에서 덜 강렬하게 표시되어 차트를 시각적으로 분석하는 데 도움이 됩니다; 수요와 공급 지대 는 가격 차트에서 이전에 상당한 매수(수요) 또는 매도(공급)가 발생한 주요 영역입니다. 이러한 지대는 트레이더가 가격 움직임의 잠재적 반전 또는 지속 을 예측하는 데 도움이 됩니다. 수요와 공급 트레이딩은 추세선, 이동 평균 또는 오
Nova AC Trader is a modern automation of the Accelerator Oscillator (AC) — a Bill Williams momentum tool designed to detect shifts in market acceleration before trends fully form. This EA transforms the indicator’s early-warning nature into a structured trading system that reacts only when momentum changes are clear and consistent. Instead of waiting for the trend to be obvious, Nova AC Trader identifies when market acceleration starts to turn — offering opportunities at the earliest stage of mo
Volume Profile V6
Andrey Kolesnik
4.67 (3)
시장 매물대 지표(Volume Profile) + 스마트 오실레이터. 통화 쌍, 주식, 선물, 암호화폐 등 거의 모든 종목에서 작동하며, 실제 거래량(Real Volume)과 틱 거래량(Tick Volume)을 모두 지원합니다. 프로파일 생성 범위를 일주일이나 한 달 등으로 자동 설정할 수 있을 뿐만 아니라, 두 개의 수직선(빨간색과 파란색)을 이동하여 수동으로 범위를 설정할 수도 있습니다. 히스트그램 형태로 표시되며, 특정 가격 수준의 히스토그램 너비는 해당 가격대에서 발생한 거래량을 의미합니다. Mode level line color 파라미터를 사용하면 가격이 반등할 가능성이 높은 주요 매물대 수준을 자동으로 표시할 수 있으며, Maximum color 파라미터는 설정된 전체 범위에서 거래가장 많이 발생한 최대 거래량 수준을 별도로 보여줍니다. 스마트 오실레이터는 과매수 및 과매도 구간을 표시합니다. 여러 지표로부터 오는 정보를 분석하고, 처리된 데이터를 바탕으로 과매수 및 과매
Trade Performance Information
Andres Mauricio Serrano Quintero
This indicator will help you track performance of your trades, even scalping trades.  You can use it with the Arab, and many other traders.  This indicator displays essential trading account information directly on your chart. It positions itself in one of the four corners of the screen and showcases details such as: Symbol: The symbol of the asset currently displayed on the chart. Profit/Loss: The total profit or loss in dollars for the current symbol. Pips: The total number of pips gained or
FREE
Harmonic Pattern Structure Harmonic Pattern Structure is a professional MetaTrader 5 indicator that automatically detects classic harmonic patterns using strict Fibonacci ratio validation and XABCD price structure. Designed for traders who value precision, clean visuals, and structured analysis, the indicator highlights potential reversal zones based on price geometry, supporting consistent and objective decision-making. SUPPORTED HARMONIC PATTERNS Gartley (222) Butterfly Bat Crab Shark Cy
PZ Support Resistance MT5
PZ TRADING SLU
3.71 (7)
Unlock key market insights with automated support and resistance lines Tired of plotting support and resistance lines? This is a multi-timeframe indicator that detects and plots supports and resistance lines in the chart with the same precision as a human eye would. As price levels are tested over time and its importance increases, the lines become thicker and darker, making price leves easy to glance and evaluate. [ Installation Guide | Update Guide | Troubleshooting | FAQ | All Products ] Boos
Universal Soul Reaper
Pieter Gerhardus Van Zyl
Universal Soul Reaper is an atmospheric market-flow oscillator designed to interpret price behavior as a cycle of spiritual energy. Instead of reacting to raw price alone, it visualizes the state of the market’s soul —revealing when momentum is awakening, stabilizing, or fading. The indicator operates in a separate window and presents three interwoven entities: the Ectoplasmic Veil , the Spirit Boundary , and the Soul Core . Together, they form a living framework that helps traders sense pressu
# DRAWDOWN INDICATOR V4.0 - The Essential Tool to Master Your Trading ## Transform Your Trading with a Complete Real-Time Performance Overview In the demanding world of Forex and CFD trading, **knowing your real-time performance** isn't a luxury—it's an **absolute necessity**. The **Drawdown Indicator V4.0** is much more than a simple indicator: it's your **professional dashboard** that gives you a clear, precise, and instant view of your trading account status. --- ## Why This Indicator
Dual Confirmation PMAX Supertrend Indicator
AL MOOSAWI ABDULLAH JAFFER BAQER
Dual Confirmation PMAX-Supertrend Indicator: The Ultimate Trading Edge The Dual Confirmation PMAX-Supertrend Indicator represents a significant advancement in technical analysis tools for serious traders. This premium indicator combines two powerful trend-following systems into a single, streamlined solution that generates signals only when both systems agree, dramatically reducing false signals and improving trading precision. Superior Signal Accuracy Through Dual Confirmation Trading success d
Blahtech Supply Demand MT5
Blahtech Limited
4.54 (13)
Was: $299  Now: $99  Supply Demand uses previous price action to identify potential imbalances between buyers and sellers. The key is to identify the better odds zones, not just the untouched ones. Blahtech Supply Demand indicator delivers functionality previously unavailable on any trading platform. This 4-in-1 indicator not only highlights the higher probability zones using a multi-criteria strength engine, but also combines it with multi-timeframe trend analysis, previously confirmed swings a
BoxChart MT5
Evgeny Shevtsov
5 (7)
The market is unfair if only because 10% of participants manage 90% of funds. An ordinary trader has slim changes to stand against these "vultures". This problem can be solved. You just need to be among these 10%, learn to predict their intentions and move with them. Volume is the only preemptive factor that faultlessly works on any timeframe and symbol. First, the volume appears and is accumulated, and only then the price moves. The price moves from one volume to another. Areas of volume accumu
Owl Smart Levels MT5
Sergey Ermolov
4.03 (32)
MT4 버전  |  FAQ Owl Smart Levels Indicator 는 Bill Williams 의 고급 프랙탈, 시장의 올바른 파동 구조를 구축하는 Valable ZigZag, 정확한 진입 수준을 표시하는 피보나치 수준과 같은 인기 있는 시장 분석 도구를 포함하는 하나의 지표 내에서 완전한 거래 시스템입니다. 시장과 이익을 취하는 장소로. 전략에 대한 자세한 설명 표시기 작업에 대한 지침 고문-거래 올빼미 도우미의 조수 개인 사용자 채팅 ->구입 후 나에게 쓰기,나는 개인 채팅에 당신을 추가하고 거기에 모든 보너스를 다운로드 할 수 있습니다 힘은 단순함에 있습니다! Owl Smart Levels 거래 시스템은 사용하기 매우 쉽기 때문에 전문가와 이제 막 시장을 연구하고 스스로 거래 전략을 선택하기 시작한 사람들 모두에게 적합합니다. 전략 및 지표에는 눈에 보이지 않는 비밀 공식 및 계산 방법이 없으며 모든 전략 지표는 공개되어 있습니다. Owl Smart Levels를 사
Overview Harmonic Patterns MT5 is a technical analysis indicator designed for the MetaTrader 5 platform. It identifies and displays harmonic price patterns, such as Butterfly, Cypher, Crab, Bat, Shark, and Gartley, in both bullish and bearish directions. The indicator calculates key price levels, including entry, stop loss, and three take-profit levels, to assist traders in analyzing market movements. Visual elements and customizable alerts enhance usability on the chart. Features Detects six ha
This indicator allows you to enjoy the two most popular products for analyzing request volumes and market deals at a favorable price: Actual Depth of Market Chart Actual Tick Footprint Volume Chart This product combines the power of both indicators and is provided as a single file. The functionality of Actual COMBO Depth of Market AND Tick Volume Chart is fully identical to the original indicators. You will enjoy the power of these two products combined into the single super-indicator! Below is
표시기는 가능한 최소 지연으로   다시 칠하지 않고   차트의 고조파 패턴을 보여줍니다. 지표 상단 검색은 가격 분석의 파동 원리를 기반으로 합니다. 고급 설정을 통해 거래 스타일에 대한 매개변수를 선택할 수 있습니다. 양초(막대)가 열릴 때 새로운 패턴이 형성되면 가격 변동의 가능성이 있는 방향의 화살표가 고정되어 변경되지 않습니다. 표시기는 ABCD, Gartley(Butterfly, Crab, Bat), 3Drives, 5-0, Batman, SHS, One2One, Camel, Triangles, WXY, Fibo, Vibrations와 같은 패턴과 그 종류를 인식합니다. 기본적으로 ABCD 및 Gartley 수치만 설정에 표시됩니다. 많은 추가 구성 가능한 매개변수. 주요 매개변수: ShowUpDnArrows - 가능한 방향 화살표 표시/숨기기 ArrowUpCode - 위쪽 화살표 코드 ArrowDnCode - 아래쪽 화살표 코드 Show old history pattern
Gold Venamax MT5
Sergei Linskii
2.67 (3)
Gold Venamax - 이것은 최고의 주식 기술 지표입니다. 지표 알고리즘은 자산의 가격 변동을 분석하고 변동성과 잠재적 진입 영역을 반영합니다. 표시기 기능: 이것은 편안하고 수익성 있는 거래를 위한 매직과 두 개의 추세 화살표 블록을 갖춘 슈퍼 지표입니다. 블록 전환을 위한 빨간색 버튼이 차트에 표시됩니다. 매직은 표시기 설정에서 설정되므로 서로 다른 블록을 표시하는 두 개의 차트에 표시기를 설치할 수 있습니다. Gold Venamax는 서로 다른 화살표 버퍼(GV 및 SD)를 사용하여 두 개의 차트에 배치할 수 있습니다. 이렇게 하려면 설정에서 다른 Magic을 선택해야 합니다. 예를 들어 하나는 Magic = 999이고 다른 하나는 Magic = 666입니다. 다음으로 차트의 빨간색 버튼으로 화살표 버퍼를 선택할 수 있습니다. 지표 설정의 각 화살표 버퍼(GV 및 SD)에는 편안하고 수익성 있는 거래를 위한 별도의 화살표 필터가 있습니다(UseFiltrGV = true;
Premium level Pro
Dmitriy Kashevich
Premium level is a unique indicator with more than 80% accuracy of correct predictions! This indicator has been tested for more than two months by the best Trading Specialists! The author's indicator you will not find anywhere else! From the screenshots you can see for yourself the accuracy of this tool! 1 is great for trading binary options with an expiration time of 1 candle. 2 works on all currency pairs, stocks, commodities, cryptocurrencies Instructions: As soon as the red arrow app
Maximum Trend Arrows OT MT5
Mulweli Valdaz Makulana
STRICTLY FOR BOOM INDEX ONLY!!!!! Here I bring the Maximum Trend Arrows OT1.0 MT5 indicator. This indicator is made up of a combination of different trend indicators for entries and exits, for entries an orange arrow will paint on the chart below the current market and a red flag for closing of trades and it produces buy arrows only. When the orange arrow appears, it will appear along with it's sound to notify you. The 1H timeframe is recommended, don't use it anywhere else than on the 1H timefr
Visual Bronze Path Indicator
AL MOOSAWI ABDULLAH JAFFER BAQER
Bronze Path Indicator The Bronze Path Indicator is a powerful yet customizable trading tool designed to help traders identify potential market opportunities using advanced technical analysis. This indicator provides a clear visual representation of buy and sell signals, ensuring traders can make informed decisions based on market conditions. Please note that this indicator is not optimized; it is created for you to fine-tune and optimize it according to your trading strategy and preferences. Ho
MT5용 암호화폐 외환 지표 "WPR with 2 Moving Averages" (리페인트 없음) - WPR 자체는 스캘핑에 가장 적합한 오실레이터 중 하나입니다. - "WPR and 2 Moving Averages" 지표는 WPR 오실레이터의 빠른 이동평균과 느린 이동평균을 함께 보여줍니다. - 이 지표는 가격 조정을 매우 빠르게 감지할 수 있도록 도와줍니다. - 매개변수를 통해 간편하게 설정할 수 있으며, 모든 시간대에 사용 가능합니다. - 매수 및 매도 진입 조건은 그림에서 확인할 수 있습니다. - WPR MA 교차 시 PC 및 모바일 알림 기능 제공. 매수 신호 조건 예시: (1) 빠른 이동평균이 느린 이동평균을 상향 돌파하고 WPR 값이 -50 미만이면 매수 진입. (2) WPR 값이 -20 이상으로 과매수 영역에 진입하면 매수 포지션 청산. 매도 신호 조건 예시: (1) 빠른 이동평균이 느린 이동평균을 하향 돌파하고 WPR 값이 -50 이상이면 매도 진입. (2) -
ATrend
Zaha Feiz
4.82 (17)
ATREND: 작동 방식 및 사용 방법 ### 작동 방식 MT5 플랫폼을 위한 "ATREND" 지표는 기술 분석 방법론의 조합을 활용하여 트레이더에게 강력한 매수 및 매도 신호를 제공하도록 설계되었습니다. 이 지표는 주로 변동성 측정을 위해 평균 진폭 범위(ATR)를 활용하며, 잠재적인 시장 움직임을 식별하기 위한 트렌드 탐지 알고리즘과 함께 사용됩니다. 구매 후 메시지를 남기면 특별 보너스 선물을 받게 됩니다. ### 주요 특징: - 동적 트렌드 탐지: 이 지표는 시장 트렌드를 평가하고 신호를 조정하여 트레이더가 현재 시장 상황에 맞춰 전략을 조정할 수 있도록 돕습니다. - 변동성 측정: ATR을 사용하여 시장의 변동성을 측정하며, 이는 최적의 손절매(SL) 및 이익 실현(TP) 수준을 결정하는 데 중요합니다. - 신호 시각화: 이 지표는 차트에 매수 및 매도 신호를 시각적으로 표시하여 트레이더의 의사 결정을 향상시킵니다. ### 운영 단계 #### 입력 및 설정 - TimeFr
TRI Visualizer
Yoshimi Mon 三 Ura
TRI Visualizer MT5 – Thermodynamic Market Analysis Overview The TRI (Thermal Range Indicator) Visualizer Enhanced is a rare market analysis indicator that goes beyond conventional technical analysis, applying principles of thermodynamics from physics. It interprets market price fluctuations as “thermodynamic energy,” enabling the highly accurate detection of subtle market changes that are often overlooked. Innovative Mechanisms 1. Dual Calculation Engines Classic TRI Mode Formula: |Close
이 제품의 구매자들이 또한 구매함
SuperScalp Pro
Van Minh Nguyen
5 (3)
SuperScalp Pro – 고급 다중 필터 스캘핑 인디케이터 시스템 SuperScalp Pro는 클래식 Supertrend와 여러 지능형 확인 필터를 결합한 고급 스캘핑 인디케이터 시스템입니다. 해당 인디케이터는 M1부터 H4까지 모든 타임프레임에서 효율적으로 작동하며, 특히 XAUUSD, BTCUSD 및 주요 외환 통화쌍에 적합합니다. 독립형 시스템으로 사용하거나 기존 거래 전략에 유연하게 통합할 수 있습니다. 이 인디케이터는 11개 이상의 필터를 통합하며, 빠른/느린 EMA, 추세 판별용 3개의 EMA, EMA 기울기(EMA slope), RSI, ADX, 거래량(Volume), VWAP, 볼린저 밴드 돌파(Bollinger Bands Breakout) 및 MACD 다이버전스 필터 등을 포함합니다. 스마트 캔들 필터는 캔들 종가를 확인하여 약한 신호를 제거하고, 3 EMA와 MACD 다이버전스 필터를 결합한 추세 인식 메커니즘은 더 높은 승률의 신호를 선별하는 데 도움을 줍니
FX Trend MT5 NG
Daniel Stein
5 (2)
FX Trend NG: 차세대 멀티 마켓 트렌드 인텔리전스 개요 FX Trend NG 는 다중 시간 프레임 기반의 전문 트렌드 분석 및 시장 모니터링 도구입니다. 몇 초 만에 전체 시장 구조를 파악할 수 있도록 설계되었습니다. 여러 차트를 일일이 전환할 필요 없이, 어떤 종목이 추세에 있는지, 어디에서 모멘텀이 약화되고 있는지, 그리고 어떤 시간 프레임이 서로 정렬되어 있는지 즉시 확인할 수 있습니다. 출시 기념 특별 혜택 – FX Trend NG 를 $30 (6개월) 또는 $80 평생 라이선스 로 이용할 수 있습니다. 이미 Stein Investments 고객이신가요? -> 메시지를 보내 전용 고객 그룹에 참여하세요. 설정이나 사용 방법이 필요하신가요? -> Stein Investments 공식 페이지 를 방문하세요. 1. FX Trend NG가 특별한 이유 3단계 추세 로직 – 단순한 Buy / Sell이 아닙니다 • 대부분의 지표는 Buy 또는 Sell 두 가지 상태만 제
이 지표를 구매하면 제 프로페셔널 트레이드 매니저를 무료로 드립니다. 우선 이 거래 시스템이 리페인팅, 리드로잉 및 레이그 인디케이터가 아니라는 점을 강조하는 것이 중요합니다. 이는 수동 및 로봇 거래 모두에 이상적인 것으로 만듭니다. 온라인 강좌, 설명서 및 프리셋 다운로드. "스마트 트렌드 트레이딩 시스템 MT5"은 새로운 및 경험이 풍부한 트레이더를 위해 맞춤형으로 제작된 종합적인 거래 솔루션입니다. 10개 이상의 프리미엄 인디케이터를 결합하고 7개 이상의 견고한 거래 전략을 특징으로 하여 다양한 시장 조건에 대한 다목적 선택이 가능합니다. 트렌드 추종 전략: 효과적인 트렌드 추이를 타기 위한 정확한 진입 및 손절 관리를 제공합니다. 반전 전략: 잠재적인 트렌드 반전을 식별하여 트레이더가 범위 시장을 활용할 수 있게 합니다. 스캘핑 전략: 빠르고 정확한 데이 트레이딩 및 단기 거래를 위해 설계되었습니다. 안정성: 모든 인디케이터가 리페인팅, 리드로잉 및 레이그가 아니므로 신뢰
ARIPoint
Temirlan Kdyrkhan
ARIPoint is a powerful trading companion designed to generate high-probability entry signals with dynamic TP/SL/DP levels based on volatility. Built-in performance tracking shows win/loss stats, PP1/PP2 hits, and success rates all updated live. Key Features: Buy/Sell signals with adaptive volatility bands Real-time TP/SL/DP levels based on ATR Built-in MA Filter with optional ATR/StdDev volatility Performance stats panel (Success, Profit/Loss, PP1/PP2) Alerts via popup, sound, push, or email Cu
Entry In The Zone and SMC Multi Timeframe is a real-time market analysis tool developed based on Smart Money Concepts (SMC). It is designed to analyze market structure, price direction, reversal points, and key zones across multiple timeframes in a systematic way. The system displays Points of Interest (POI) and real-time No Repaint signals, with instant alerts when price reaches key zones or when signals occur within those zones. It functions as both an Indicator and a Signal System (2-in-1), c
Divergence Bomber
Ihor Otkydach
4.89 (81)
이 지표를 구매하신 분께는 다음과 같은 혜택이 무료로 제공됩니다: 각 거래를 자동으로 관리하고, 손절/익절 수준을 설정하며, 전략 규칙에 따라 거래를 종료하는 전용 도우미 툴 "Bomber Utility" 다양한 자산에 맞게 지표를 설정할 수 있는 셋업 파일(Set Files) "최소 위험", "균형 잡힌 위험", "관망 전략" 모드로 설정 가능한 Bomber Utility의 셋업 파일 이 전략을 빠르게 설치, 설정, 시작할 수 있도록 돕는 단계별 영상 매뉴얼 주의: 위의 모든 보너스를 받기 위해서는 MQL5 개인 메시지 시스템을 통해 판매자에게 연락해 주세요. 독창적인 커스텀 지표인 “Divergence Bomber(다이버전스 봄버)”를 소개합니다. 이 지표는 MACD 다이버전스(괴리) 전략을 기반으로 한 올인원(All-in-One) 거래 시스템입니다. 이 기술 지표의 주요 목적은 가격과 MACD 지표 간의 다이버전스를 감지하고, **향후 가격이 어느 방향으로 움직일지를 알려주는
Azimuth Pro
Ottaviano De Cicco
5 (4)
LAUNCH PROMO Azimuth Pro price is initially set at 299$ for the first 100 buyers. Final price will be 499$ . THE DIFFERENCE BETWEEN RETAIL AND INSTITUTIONAL ENTRIES ISN'T THE INDICATOR — IT'S THE LOCATION. Most traders enter at arbitrary price levels, chasing momentum or reacting to lagging signals. Institutions wait for price to reach structured levels where supply and demand actually shift. Azimuth Pro maps these levels automatically: swing-anchored VWAP, multi-timeframe structure lines, an
Game Changer Indicator mt5
Vasiliy Strukov
5 (18)
Game Changer는 모든 금융 상품에 적용 가능한 혁신적인 추세 지표로, MetaTrader를 강력한 추세 분석 도구로 탈바꿈시켜 줍니다. 모든 시간대에서 작동하며 추세 식별, 잠재적 반전 신호 제공, 트레일링 스톱 기능, 그리고 신속한 시장 대응을 위한 실시간 알림 기능을 제공합니다. 숙련된 전문가든 이제 막 시작하는 초보자든, Game Changer는 추세의 역학을 명확하게 이해하고 자신감 있고 규율 있는 거래를 할 수 있도록 도와줍니다. 이 지표는 차트 재구성 기능을 지원합니다. 구매 후 즉시 연락 주시면 특별 보너스를 드립니다. Strong Support 및 Trend Scanner 지표를 무료로 제공해 드립니다. [email protected]으로 메시지를 보내주세요. 참고로, 저는 텔레그램에서 EA나 특별 세트를 판매하지 않습니다. 모든 EA는 MQL5에서만 사용 가능하며, 세트 파일은 제 블로그(여기)에서만 다운로드하실 수 있습니다. 사기꾼을 조심하시고 다른 사
Power Candles MT5
Daniel Stein
5 (6)
Power Candles – 모든 시장을 위한 강도 기반 진입 신호 Power Candles 는 Stein Investments의 검증된 강도 분석을 가격 차트에 직접 제공합니다. 가격 움직임에만 반응하는 대신, 각 캔들은 실제 시장 강도를 기준으로 색상화되어 모멘텀 형성, 강도 가속, 명확한 추세 전환을 즉시 파악할 수 있습니다. 모든 시장을 위한 단일 로직 Power Candles는 모든 거래 심볼 에서 자동으로 작동합니다. 현재 심볼이 Forex인지 비-Forex 시장인지 자동으로 감지하여 내부적으로 적절한 강도 모델을 적용합니다. Forex 및 Gold 는 FX Power Delta 값을 사용합니다 (절대값 범위 최대 100) 지수, 크립토 및 CFD 는 IX Power Strength 값을 사용합니다 (절대값 범위 최대 50) 필요한 강도 계산은 Power Candles에 완전히 내장되어 있습니다. 캔들 색상이나 신호 로직을 위해 추가 인디케이터는 필요하지 않습니다. 가격
Atomic Analyst MT5
Issam Kassas
4.07 (28)
우선적으로 언급할 점은이 거래 지표가 다시 그리지 않고 지연되지 않으며 이를 통해 수동 및 로봇 거래 모두에 이상적이라는 점입니다. 사용자 매뉴얼: 설정, 입력 및 전략. Atomic Analyst는 가격의 강도와 모멘텀을 활용하여 시장에서 더 나은 이점을 찾는 PA Price Action Indicator입니다. 고급 필터를 장착하여 잡음과 거짓 신호를 제거하고 거래 잠재력을 높이는 데 도움이 됩니다. 복잡한 지표의 다중 레이어를 사용하여 Atomic Analyst는 차트를 스캔하고 복잡한 수학적 계산을 간단한 신호와 색상으로 변환하여 초보 트레이더가 이해하고 일관된 거래 결정을 내릴 수 있도록합니다. "Atomic Analyst"는 새로운 및 경험이 풍부한 트레이더를위한 종합적인 거래 솔루션입니다. 프리미엄 지표와 최고 수준의 기능을 하나의 거래 전략에 결합하여 모든 종류의 트레이더에 대한 다재다능한 선택지가되었습니다. 인트라데이 거래 및 스캘핑 전략 : 빠르고 정확한 일일
Super Signal – Skyblade Edition 전문가용 노리페인트 / 노래그 트렌드 신호 시스템, 뛰어난 승률 제공 | MT4 / MT5용 1분, 5분, 15분과 같은 낮은 타임프레임에서 가장 좋은 성능을 보입니다. 핵심 기능: Super Signal – Skyblade Edition은 추세 매매를 위해 설계된 스마트 신호 시스템입니다. 이 시스템은 다중 필터 로직을 활용하여, 명확한 방향성과 실질적인 모멘텀이 수반된 고품질 추세만을 감지합니다. 이 시스템은   고점 또는 저점을 예측하지 않으며 , 다음 세 가지 조건이 모두 충족될 때만 신호를 발생시킵니다: 명확한 추세 방향 강화되는 모멘텀 건전한 변동성 구조 또한, 시장 세션 기반의 유동성 분석을 통해 신호의 신뢰성과 타이밍을 더욱 향상시킵니다. 신호 특성: 모든 화살표 신호는 100% 리페인트 없음 / 지연 없음 신호가 한 번 발생하면 고정되며, 깜빡이거나 사라지지 않음 차트 상의 시각적 화살표, 정보 패널, 팝업
FX Power MT5 NG
Daniel Stein
5 (31)
FX Power: 통화 강세 분석으로 더 스마트한 거래 결정을 개요 FX Power 는 어떤 시장 상황에서도 주요 통화와 금의 실제 강세를 이해하기 위한 필수 도구입니다. 강한 통화를 매수하고 약한 통화를 매도함으로써 FX Power 는 거래 결정을 단순화하고 높은 확률의 기회를 발견합니다. 트렌드를 따르거나 극단적인 델타 값을 사용해 반전을 예측하고자 한다면, 이 도구는 귀하의 거래 스타일에 완벽히 적응합니다. 단순히 거래하지 말고, FX Power 로 더 스마트하게 거래하세요. 1. FX Power가 거래자에게 매우 유용한 이유 통화와 금의 실시간 강세 분석 • FX Power 는 주요 통화와 금의 상대적 강세를 계산하고 표시하여 시장 역학에 대한 명확한 통찰력을 제공합니다. • 어떤 자산이 앞서고 있고 어떤 자산이 뒤처지는지 모니터링하여 보다 현명한 거래 결정을 내릴 수 있습니다. 포괄적인 멀티 타임프레임 뷰 • 단기, 중기 및 장기 타임프레임에서 통화와 금의 강세를
Entry Points Pro for MT5
Yury Orlov
4.48 (138)
다시 색을 칠하지 않고 거래에 진입할 수 있는 정확한 신호를 제공하는 MT5용 지표입니다. 외환, 암호화폐, 금속, 주식, 지수 등 모든 금융 자산에 적용할 수 있습니다. 매우 정확한 추정값을 제공하고 매수와 매도의 가장 좋은 시점을 알려줍니다. 하나의 시그널로 수익을 내는 지표의 예와 함께 비디오 (6:22)시청하십시오! 대부분의 거래자는 Entry Points Pro 지표의 도움으로 첫 거래 주 동안 트레이딩 결과를 개선합니다. 저희의   Telegram Group 을 구독하세요! Entry Points Pro 지표의 좋은점. 재도색이 없는 진입 신호 신호가 나타나고 확인되면(시그널 캔들이 완성된 경우) 신호는 더 이상 사라지지 않습니다. 여타 보조지표의 경우 신호를 표시한 다음 제거되기 때문에 큰 재정적 손실로 이어집니다. 오류 없는 거래 게시 알고리즘을 통해 트레이드(진입 또는 청산)를 할 이상적인 순간을 찾을 수 있으며, 이를 통해 이를 사용하는 모든 거래자의 성공률이
Trend Screener Pro MT5
STE S.S.COMPANY
4.84 (100)
트렌드 표시기, 트렌드 트레이딩 및 필터링을 위한 획기적인 고유 솔루션, 하나의 도구 안에 내장된 모든 중요한 트렌드 기능! Forex, 상품, 암호 화폐, 지수 및 주식과 같은 모든 기호/도구에 사용할 수 있는 100% 다시 칠하지 않는 다중 시간 프레임 및 다중 통화 표시기입니다. Trend Screener는 차트에 점이 있는 화살표 추세 신호를 제공하는 효율적인 지표 추세 추종 지표입니다. 추세 분석기 표시기에서 사용할 수 있는 기능: 1. 트렌드 스캐너. 2. 최대 이익 분석이 있는 추세선. 3. 추세 통화 강도 측정기. 4. 경고가 있는 추세 반전 점. 5. 경고가 있는 강력한 추세 점. 6. 추세 화살표 Trend Screener Indicator가 있는 일일 분석 예, 일일 신호 성능...등은 여기에서 찾을 수 있습니다. 여기를 클릭하십시오. LIMITED TIME OFFER : Trend Screener Indicator는 50$ 및 평생 동안만 사용할 수 있습니다.
" Dynamic Scalper System MT5 " 지표는 추세 파동 내에서 스캘핑 방식으로 거래하도록 설계되었습니다. 주요 통화쌍 및 금에서 테스트되었으며, 다른 거래 상품과의 호환성이 가능합니다. 추가적인 가격 변동 지원을 통해 추세에 따라 단기 포지션 진입 신호를 제공합니다. 지표의 원리 큰 화살표는 추세 방향을 결정합니다. 작은 화살표 형태의 스캘핑 신호를 생성하는 알고리즘은 추세 파동 내에서 작동합니다. 빨간색 화살표는 상승 방향을, 파란색 화살표는 하락 방향을 나타냅니다. 민감한 가격 변동선은 추세 방향으로 그려지며, 작은 화살표의 신호와 함께 작용합니다. 신호는 다음과 같이 작동합니다. 적절한 시점에 선이 나타나면 진입 신호가 형성되고, 선이 있는 동안 미결제 포지션을 유지하며, 완료되면 거래를 종료합니다. 권장되는 작업 시간대는 M1~H4입니다. 화살표는 현재 캔들에 형성되며, 다음 캔들이 이미 시작되었더라도 이전 캔들의 화살표는 다시 그려지지 않습니다. 입
Transaction Speed MT5
Ivan Stefanov
5 (3)
이 지표는 시장에서 관심이 나타나는 영역 을 강조 표시한 후, 주문이 누적되는 영역 을 보여줍니다. 이는 **대규모 오더북(호가창)**처럼 작동합니다. 이것은 거대한 자금 을 위한 인디케이터입니다. 성능은 탁월하며, 시장에서 어떤 관심이 있든 반드시 포착할 수 있습니다 . (이것은 완전히 새로 작성되고 자동화된 버전 입니다 – 이제 수동 분석은 필요하지 않습니다.) **거래 속도(Transaction Speed)**는 새로운 개념의 인디케이터로, 시장에 대규모 주문이 언제, 어디에 쌓이는지를 보여주며 , 그 이점을 분석합니다. 매우 초기 단계에서 트렌드 전환 을 감지할 수 있습니다. FX 시장에서 흔히 사용하는 "거래량(volume)"은 오해입니다. 실제로는 시간당 가격 변화량 이므로, 올바른 용어는 거래 속도 입니다. 우리가 어떻게 사고하고, 행동하며, 분석하느냐 가 가장 중요합니다. 분석 패러다임의 전환 은 필수적입니다. 이 인디케이터는 외환 시장에서의 볼륨 개념을 논리적으로
Smart Stop Indicator – 차트 위에서 직접 작동하는 지능형 스톱로스 시스템 개요 Smart Stop Indicator는 감이나 추측이 아닌 명확하고 체계적인 방식으로 스톱로스를 설정하고 싶은 트레이더를 위한 맞춤형 솔루션입니다. 이 도구는 클래식 프라이스 액션 논리(고점, 저점 구조)와 현대적인 브레이크아웃 인식을 결합하여 실제로 가장 논리적인 다음 스톱 레벨을 정확히 식별합니다. 추세, 박스권, 빠른 브레이크아웃 상황 등 어떤 시장에서도 인디케이터는 최적의 SL 구역과 상태(“new”, “broken”, “valid”)를 차트에 직접 표시합니다. 새로운 기능으로 SL 거리의 %ADR 표시가 추가되었습니다. 핵심 기능 자동 시장구조 기반 스톱 설정 • 시장 구조와 실시간 가격 움직임을 기반으로 의미 있는 스톱로스 레벨을 자동으로 탐지합니다. 스마트 브레이크아웃 감지 • 빠른 방향 변화나 돌파 상황에서도 불필요한 조기 스톱 조정을 강요하지 않으며 유연하게 반응합
매일 많은 트레이더들이 공통적인 도전에 직면합니다: 가격이 주요 레벨을 돌파하는 것처럼 보여 거래에 진입하면, 시장이 반전하여 스톱로스가 발동됩니다. 이것을 거짓 돌파(False Breakout)라고 합니다 — 가격이 지지 또는 저항 수준을 잠시 넘어선 후 방향을 반전하는 움직임입니다. 이러한 움직임은 실제 가격 방향이 명확해지기 전에 스톱로스가 발동되는 결과를 초래할 수 있습니다. 기술적 분석에서 이 현상은 일반적으로 "유동성 스윕"(liquidity sweep) 또는 "스톱 헌팅"(stop hunt)이라고 합니다. Mirage Trading System은 거짓 돌파 패턴을 감지하도록 설계된 지표입니다. "Mirage"(신기루)라는 이름은 시장에서 빈번하게 발생하는 기만적인 가격 움직임이라는 환상을 의미합니다. 거짓 돌파가 많은 트레이더를 당황하게 할 수 있지만, Mirage Trading System은 이러한 패턴이 언제 형성되는지 식별하고 후속 가격 움직임의 잠재적 방향을 나
Quantum TrendPulse
Bogdan Ion Puscasu
5 (20)
SuperTrend   ,   RSI   ,   Stochastic   의 힘을 하나의 포괄적인 지표로 결합하여 트레이딩 잠재력을 극대화하는 궁극의 트레이딩 도구   인 Quantum TrendPulse를   소개합니다. 정밀성과 효율성을 추구하는 트레이더를 위해 설계된 이 지표는 시장 추세, 모멘텀 변화, 최적의 진입 및 종료 지점을 자신 있게 식별하는 데 도움이 됩니다. 주요 특징: SuperTrend 통합:   주요 시장 추세를 쉽게 따라가고 수익성의 물결을 타세요. RSI 정밀도:   매수 과다 및 매도 과다 수준을 감지하여 시장 반전 시점을 파악하는 데 적합하며 SuperTrend 필터로 사용 가능 확률적 정확도:   변동성이 큰 시장에서 숨겨진 기회를 찾기 위해 확률적 진동   을 활용하고 SuperTrend의 필터로 사용 다중 시간대 분석:   M5부터 H1 또는 H4까지 다양한 시간대에 걸쳐 시장을 최신 상태로 유지하세요. 맞춤형 알림:   맞춤형 거래 조건이 충족되면
Quantum Entry 는 트레이더들 사이에서 가장 인기 있고 널리 알려진 전략 중 하나인 "브레이크아웃 전략"을 기반으로 구축된 강력한 가격 행동 거래 시스템입니다! 이 지표는 주요 지지 및 저항 구역의 돌파를 기반으로 명확한 매수 및 매도 신호를 생성합니다. 일반적인 브레이크아웃 지표와 달리 고급 계산을 사용하여 돌파를 정확하게 확인합니다! 돌파가 발생하면 즉시 알림을 받을 수 있습니다. 지연 없고 재표시 없음 : 모든 신호는 실시간으로 제공되며 지연 없이 과거 신호가 재표시되지 않습니다! 권장 사항 Quantum Entry는 모든 시간대와 모든 거래 심볼에서 작동합니다. 우리는 개인적으로   XAUUSD(금) 의   M1, M5 및 M15   시간대에서 이 지표를 사용합니다! 당신의 거래 실력을 향상시킬 기회를 놓치지 마세요. 지금 바로   Quantum Entry 를 확보하고 자신감과 정확성으로 거래를 시작하세요! MT4 version -  https://www.mql5.
Support And Resistance Screener는 하나의 지표 안에 여러 도구를 제공하는 MetaTrader에 대한 하나의 레벨 지표입니다. 사용 가능한 도구는 다음과 같습니다. 1. 시장 구조 스크리너. 2. 완고한 후퇴 영역. 3. 약세 후퇴 영역. 4. 일일 피벗 포인트 5. 주간 피벗 포인트 6. 월간 피벗 포인트 7. 고조파 패턴과 볼륨에 기반한 강력한 지지와 저항. 8. 은행 수준 구역. LIMITED TIME OFFER : HV 지원 및 저항 표시기는 50 $ 및 평생 동안만 사용할 수 있습니다. ( 원래 가격 125$ ) MQL5 블로그에 액세스하면 분석 예제와 함께 모든 프리미엄 지표를 찾을 수 있습니다. 여기를 클릭하십시오. 주요 특징들 고조파 및 볼륨 알고리즘을 기반으로 하는 강력한 지원 및 저항 영역. Harmonic 및 Volume 알고리즘을 기반으로 한 강세 및 약세 풀백 영역. 시장 구조 스크리너 일간, 주간 및 월간 피벗 포인트. 실제 거래의
Bill Williams Advanced
Siarhei Vashchylka
5 (10)
Bill Williams Advanced is designed for automatic chart analysis using Bill Williams' "Profitunity" system. The indicator analyzes four timeframes at once. Manual (Be sure to read before purchasing) Advantages 1. Analyzes the chart using Bill Williams' "Profitunity" system. Signals are displayed in a table in the corner of the screen and on the price chart. 2. Finds all known AO and AC signals, as well as zone signals. Equipped with a trend filter based on the Alligator. 3. Finds "Divergence Bar
Trend indicator AI mt5
Ramil Minniakhmetov
5 (15)
트렌드 인공 지능 지표는 실행 가능한 진입 점 및 반전 경고와 추세 식별을 결합하여 상인의 시장 분석을 향상시킬 훌륭한 도구입니다. 이 표시기는 사용자가 자신감과 정밀도로 외환 시장의 복잡성을 탐색 할 수 있도록 지원합니다 기본 신호 외에도 트렌드 인공 지능 지표는 풀백 또는 되돌림 중에 발생하는 2 차 진입 점을 식별하여 거래자가 기존 트렌드 내에서 가격 수정을 활용할 수 있도록합니다. 중요한 장점: ·작동 4 및 5 *명확한 구매 또는 판매 신호 *다시 칠하지 않습니다 *모든 자산에서 작동 나는 전보 사기에 개 또는 세트를 판매하지 않도록주의. 모든 설정은 블로그에 여기에 무료.  중요! 지침 및 보너스를 얻기 위해 구입 후 즉시 저에게 연락! 진짜 가동 감시는 뿐 아니라 나의 다른 제품 여기에서 찾아낼 수 있습니다: https://www.mql5.com/en/users/mechanic/seller&nbsp ; 설정 및 입력: 모든 자산에 대해 기본 설정을 권
Grabber System MT5
Ihor Otkydach
4.82 (22)
탁월한 기술적 지표인 Grabber를 소개합니다. 이 도구는 즉시 사용 가능한 “올인원(All-Inclusive)” 트레이딩 전략으로 작동합니다. 하나의 코드 안에 강력한 시장 기술 분석 도구, 매매 신호(화살표), 알림 기능, 푸시 알림이 통합되어 있습니다. 이 인디케이터를 구매하신 모든 분들께는 다음의 항목이 무료로 제공됩니다: Grabber 유틸리티: 오픈 포지션을 자동으로 관리하는 도구 단계별 영상 매뉴얼: 설치, 설정, 그리고 실제 거래 방법을 안내 맞춤형 세트 파일: 인디케이터를 빠르게 자동 설정하여 최고의 성과를 낼 수 있도록 도와줍니다 다른 전략은 이제 잊어버리세요! Grabber만이 여러분을 새로운 트레이딩의 정점으로 이끌어 줄 수 있습니다. Grabber 전략의 주요 특징: 거래 시간 프레임: M5부터 H4까지 거래 가능한 자산: 어떤 자산이든 사용 가능하지만, 제가 직접 테스트한 종목들을 추천드립니다 (GBPUSD, GBPCAD, GBPCHF, AUDCAD, AU
[ 내 채널 ] , [ 내 제품 ] Lorentzian Distance Classifier는 머신러닝 기반 트레이딩 지표로, 근사 최근접 이웃(ANN) 프레임워크 내에서 로렌츠 거리(Lorentz distance)를 핵심 지표로 사용합니다. 기존의 유클리드 거리 대신, 금융 가격 움직임을 “왜곡된” 가격-시간 공간에서 발생하는 것처럼 처리합니다(상대성이론에서 거대한 물체가 시공간을 휘게 만드는 것과 유사). 이러한 접근 방식은 시장 노이즈, 이상치, 이벤트로 인한 왜곡(FOMC, 지정학적 충격 등)에 훨씬 더 강하며, 유클리드 거리 기반 방법들이 시간에 따라 포착하지 못하는 과거의 유사한 가격 움직임을 인식할 수 있도록 합니다. 이 지표는 종가 기준 캔들에서 명확한 **리페인트 없음(non-repainting)** 신호를 제공하며, 바로 사용할 수 있는 버퍼를 제공합니다. 기능 RSI, WaveTrend, CCI20, ADX를 조합할 수 있습니다. 총 다섯 개의 슬롯이 제공되며 —
Trend Hunter MT5
Andrey Tatarinov
5 (3)
Trend Hunter 는 Forex, 암호화폐 및 CFD 시장에서 작업하기 위한 추세 지표입니다. 이 지표의 특별한 특징은 가격이 추세선을 약간 돌파할 때 신호를 변경하지 않고 자신있게 추세를 따른다는 것입니다. 표시기는 다시 그려지지 않으며 막대가 닫힌 후에 시장 진입 신호가 나타납니다. 추세를 따라 이동할 때 표시기는 추세 방향에 대한 추가 진입점을 표시합니다. 이러한 신호를 바탕으로 작은 StopLoss로 거래할 수 있습니다. Trend Hunter 는 정직한 지표입니다. 표시 신호 위로 마우스를 가져가면 신호의 잠재적 이익과 가능한 중지가 표시됩니다. 새로운 신호가 나타나면 다음 알림을 받을 수 있습니다. 알리다 푸시 알림 이메일로 알림 텔레그램 알림 차트 스크린샷도 텔레그램으로 전송되므로 거래 결정을 내리기 위해 단말기를 열 필요가 없습니다. 표시 신호는 텔레그램 채널 https://www.mql5.com/ko/market/product/11085#!tab=com
FX Levels MT5
Daniel Stein
5 (13)
FX Levels: 모든 시장을 위한 뛰어난 정확도의 지지와 저항 간단 요약 통화쌍, 지수, 주식, 원자재 등 어떤 시장이든 믿을 만한 지지·저항 레벨을 찾고 싶나요? FX Levels 는 전통적인 “Lighthouse” 기법과 첨단 동적 접근을 결합해, 거의 보편적인 정확성을 제공합니다. 실제 브로커 경험을 반영하고, 자동화된 일별 업데이트와 실시간 업데이트를 결합함으로써 FX Levels 는 가격 반전 포인트를 파악하고, 수익 목표를 설정하며, 자신 있게 트레이드를 관리할 수 있게 돕습니다. 지금 바로 시도해 보세요—정교한 지지/저항 분석이 어떻게 여러분의 트레이딩을 한 단계 끌어올릴 수 있는지 직접 확인하세요! 1. FX Levels가 트레이더에게 매우 유용한 이유 뛰어난 정확도의 지지·저항 존 • FX Levels 는 다양한 브로커 환경에서도 거의 동일한 존을 생성하도록 설계되어, 데이터 피드나 시간 설정 차이로 인한 불일치를 해소합니다. • 즉, 어떤 브로커를 사용하
Crystal Heikin Ashi Signals - Professional Trend & Signal Detection Indicator Advanced Heikin Ashi Visualization with Intelligent Signal System for Manual & Automated Trading Overview Crystal Heikin Ashi Signals is a professional-grade MetaTrader 5 indicator that combines pure Heikin Ashi candle visualization with an advanced momentum-shift detection system. Designed for both manual traders and algorithmic systems, this indicator delivers clear trend analysis with precise entry signals through v
TrendMaestro5
Stefano Frisetti
note: this indicator is for METATRADER4, if you want the version for METATRADER5 this is the link:  https://www.mql5.com/it/market/product/108106 TRENDMAESTRO ver 2.5 TRENDMAESTRO recognizes a new TREND from the start, he never makes mistakes. The certainty of identifying a new TREND is priceless. DESCRIPTION TRENDMAESTRO identifies a new TREND in the bud, this indicator examines the volatility, volumes and momentum to identify the moment in which there is an explosion of one or more of these da
Dark Support Resistance  is an Indicator for intraday trading. This Indicator is programmed to identify  Support and Resistance Lines , providing a high level of accuracy and reliability. Key benefits Easily visible lines Only the most important levels will be displayed Automated adjustment for each timeframe and instrument Easy to use even for beginners Never repaints, never backpaints, Not Lag 100% compatible with Expert Advisor development All types of alerts available: Pop-up, Email, Push
제작자의 제품 더 보기
BoomTroom
Maryna Shulzhenko
The original BoomTroom trend indicator. With this indicator, you do not need to sit near the computer and wait for the inflection point to appear day and night. How important it is to determine the trend in the stock market or the Forex market! Still not sure how to determine the inflection point of a trend? Are you still worried about how to draw short-term and long-term trend lines? Run this smart utility. You will see pivot points of varying strength, as well as long-term and short-term tre
Trend Units
Maryna Shulzhenko
The Forex market can go through many different price paths to reach a point in the future. The future is dynamic. Therefore, planning a trade with a possible future scenario is an essential step for your success. For these purposes, we present to your attention Trend Units. A unique author's strategy that simultaneously determines the strength of trends and points of entry into the market, visualizing it using arrows on the chart. The indicator is optimally adapted for trading on time periods
TrendSys
Maryna Shulzhenko
Trend Sys, an indicator designed to detect trends in price movement and allows you to quickly determine the direction of the trend. The best way to trade Trend Sys is to enter the market when Trend Sys peaks and goes the other way. This is a sign of a trend reversal. I hope you enjoy this indicator and leave your comments to make it even better. Good luck and happy trading.
Trend Moment
Maryna Shulzhenko
Using the Trend Moment indicator, you can find not only overbought and oversold zones, but also be able to identify the strongest reversals of the current trend. This will take your trading to a whole new level. Forget about slipping in oscillators, be it Stochastic or RSI or any other oscillator. Trend Moment signals 100% do not redraw and do not require adjusting the parameters - the indicator will work equally well on any chart, even with default parameters.
Trend Sens
Maryna Shulzhenko
Trend Sens is a universal indicator, the values of which are calculated based on different indicators. The iPump indicator is a versatile indicator that combines the advantages of three categories of indicators. You get 3 indicators in 1 product. Trend Sense itself appeared in the process of many years of work with financial assets. The indicator has become a consequence of those desires and requirements, for the analysis that I personally would like to use for trading.
Trend Lime
Maryna Shulzhenko
With the development of information technologies and a large number of participants, financial markets are less and less amenable to analysis by outdated indicators. Conventional technical analysis tools, such as the Moving Average or Stochastic, in their pure form are not able to determine the direction of the trend or its reversal. Can one indicator indicate the correct direction of the future price, without changing its parameters, in the history of 14 years? At the same time, not to lose ad
Trend Map
Maryna Shulzhenko
The Trend Map indicator is designed to detect trends in price movement and allows you to quickly determine not only the direction of the trend, but also to understand the levels of interaction between buyers and sellers. It has no settings and therefore can be perceived as it signals. It contains only three lines, each of which is designed to unambiguously perceive the present moment. Line # 2 characterizes the global direction of the price movement. If we see that the other two lines are above
Trend LineA
Maryna Shulzhenko
Trend LineA is a powerful trend indicator equipped with everything you need to trade and at the same time very easy to use. The indicator calculates the most probable zones of trend stop / reversal, zones of confident trend movements. The indicator works on all timeframes and currency pairs. The indicator gives quite accurate signals and it is customary to use it both in trend and flat markets. It is advisable to use the indicator in combination with other instruments for more reliable signals
Trrend Arrow
Maryna Shulzhenko
Original Trrend Arrow trend indicator showing buy and sell areas. With this indicator, you do not need to sit near the computer and wait for the inflection point to appear day and night. The indicator is very easy to use. When an up arrow appears, open a buy deal. When a down arrow appears, open a sell trade. The indicator works on all timeframes and currency pairs. It is advisable to use the indicator in combination with other instruments for more reliable signals and making a more balanced
Trend Op
Maryna Shulzhenko
One of the biggest challenges traders face is finding the trading system that's right for them. Trend Op indicator predicts the most likely short-term price movement based on complex mathematical calculations. This indicator is designed to detect trends in price movement and allows you to quickly determine not only the direction of the trend, but also to understand the levels of interaction between buyers and sellers. It has no settings and therefore can be perceived as it signals.
Trend Hist
Maryna Shulzhenko
The Trend Hist indicator is designed to display on a chart and visually evaluate the trailing algorithm by inside bars. This indicator finds strong trend movements of a currency pair on a given number of bars, and also finds a correction to this trend. If the trend is strong enough, and the correction becomes equal to the one specified in the parameters, then the indicator signals this.
Trend Slow
Maryna Shulzhenko
The Trend Slow indicator uses the author's algorithm for analyzing price behavior and displays the result of complex work in the form of lines. For simplicity, the algorithm automatically changes the line color according to its direction. The indicator has a parameter to enable alerts when the color changes, thus helping the trader to identify new market trends. This system will help you find high-probability trades in the direction of strong trends.
Effect
Maryna Shulzhenko
The Effect indicator shows the points of potential market reversal. Simple, visual and efficient trend detection. Ready-made trading system. The intelligent algorithm of the indicator determines the trend with good probability. Uses just one parameter for settings. The indicator does not redraw and does not lag. Works on all currency pairs and all timeframes. You should remember that using a combination of forecasting tools, it is advisable to choose 2-3 indicators for trading. Otherwise, thei
Going straight
Maryna Shulzhenko
American traders say: “Trend is your friend”, which means “Trend is your friend”. And indeed it is! By trading with the trend, you reduce your risks and gain an advantage, as you increase the mathematical expectation of completed trades and, therefore, earn more profit. Together with the Going straight indicator you will trade with the trend with ease! This is one of the most effective ways to deal with market trends. Trading strategies using the channel indicator belong to the classic methods
Schrodinger Channel
Maryna Shulzhenko
Schrodinger Channel is a non-redrawing channel indicator based on moving averages, it takes into account not simple moving averages, but twice smoothed ones, which, on the one hand, makes it possible to more clearly determine the market movement, and on the other hand, makes the indicator less sensitive. Signals are not redrawn and can be used immediately after they appear. This means that there is no need to wait for a new confirming bar. The lower and upper bands are used as support / resista
Direction Arrows
Maryna Shulzhenko
The Direction Arrows indicator tracks the market trend while ignoring the sharp market fluctuations and noise around the average price. The indicator implements a kind of technical analysis based on the idea that the market is cyclical in nature. It catches the trend and shows favorable moments of entering the market with arrows. The indicator can be used both for pipsing on small periods and for long-term trading.
Incognito RSI
Maryna Shulzhenko
The Incognito RSI indicator is an advanced internal strength index. It transforms the signal so that the low-frequency components lag behind much more than the high-frequency components. In general, the data of the last bar has more weight than the previous data, like an exponential moving average. The indicator demonstrates not the relative strength of the compared trading instruments, but the internal strength of a single instrument, therefore it is the “Internal Strength Index”. This is an
Oscillator Trends
Maryna Shulzhenko
The Oscillator Trend indicators are most useful in identifying trend decay. Nobody canceled the divergence. Correct use of this signal will give you a certain head start in the market. When working in flat. The principle of operation of the oscillator is based on the measurement of fluctuations. The indicator tries to determine the maximum or minimum of the next swing - an exit from the overbought and oversold zones. Do not forget that these signals are most interesting at the borders of the fl
Purpose Trend
Maryna Shulzhenko
Purpose Trend - analyzes the current trend gives an excellent understanding of which direction the market is aimed at, at what point it should be expected in the near future. Unfortunately, most of the popular indicators in practice give a huge number of false signals, since they all work without any consideration of global trends. That is why in today's conditions, when the market is far from stable price movement, it is almost impossible to build a strategy without using trend indicators. Ho
BitTerraCoin
Maryna Shulzhenko
BitTerraCoin is a unique trading system! It goes through the entire history and all currency pairs with one single setting. Works using sharp tick movements. Recommendations for working with a scalpel: It is recommended to work on liquid Forex pairs with a low spread. The lower the commission and the spread, the greater the profit. You can start using it with $ 100 and 0.01 lot. You can work on any hourly period, on any currency pair and on the server of any broker. Details: The MaxSpread par
Make Use
Maryna Shulzhenko
The Make Use trend indicator copes with the main task of trading: to find an entry point to the market at the moment of trend initiation and an exit point at the moment of its completion. A stable movement of quotations in a certain direction is called a trend in trading. In this case, the movement itself can be downward, upward or sideways, when the market movement does not have a pronounced direction. The Make Use trend indicator is important for identifying trends in financial markets. Howev
Trend Thyrogen
Maryna Shulzhenko
Trend Thyrogen is a trend trading strategy, filtering and all the necessary features built into one tool! Intelligent indicator algorithm with generates input signals and output levels. The principle of operation of the indicator is to automatically determine the current state of the market when placed on a chart, analyze historical data based on historical data and display instructions for further actions on the trader's screen. The system itself shows in the form of arrows when to buy and wh
Channel Token
Maryna Shulzhenko
The Channel Token indicator automatically builds a trend movement tracking channel. The price is in its trend movement in a certain range, and not a chaotic spread of the price, it is not clear in which direction. And if the price deviates within a certain range, it means that the boundaries of these ranges are support and resistance lines and form the Channel Token channel. Channel Token - an indicator in which the indicator period is automatically calculated based on the number of bars of t
Gibraltar
Maryna Shulzhenko
The bot uses 4 MACD indicators and two MAs in its work, thus a zone is formed for trading on the breakdown of the Bands channel and, accordingly, with a minimum stop level and only one deal. The bot also takes into account parameters such as slippage, spread and volatility. Entry is made only when there is sufficient volatility. Thus, the bot works using sharp tick movements. It is recommended to work on liquid Forex pairs with a low spread. The lower the commission and the spread, the greater
Trend Long
Maryna Shulzhenko
The Trend Long indicator accompanies long trends. It can be used only to determine the global trend, but not as an entry point. Any reliable entry indicator can be used for the entry point. Or the standard RSI, based on overbought / oversold levels. The indicator can be used without restrictions on instruments or timeframes. Experiment with the parameters! The parameters are not linear! When you specify a period, you only specify a period to determine the price range for a certain interval. Th
Channel Reliable
Maryna Shulzhenko
This is no ordinary channel. Everyone should analyze it and find a way to use it in their trading strategies. Like all channels, it has a middle line as well as a high and low line. This channel is worth watching for its unusual behavior. The use of the Channel Reliable indicator allows the trader to react in time to the price going beyond the boundaries of the channel set for it. This corridor is built on the basis of the analysis of several candles, and changes in the parameter of the number
Pattern Trend
Maryna Shulzhenko
The principle of operation of the Patern Trend indicator is to work on a channel breakout. The parameters and width of the channel are selected in such a way that the closing in the red is sufficiently balanced, which is shown on the chart by the inscriptions near the arrows. You can see that the arrow signal does not appear every time the channel is broken. Because the indicator has a volatility filter that has a big impact on the entry. In total on the chart (EURUSD / H1) you can see that th
Signal Switched
Maryna Shulzhenko
Signal Switched is a channel indicator designed to work with support and resistance levels and help traders find opportunities to enter the market. It is also protected by arrows that help to enter the market correctly. Channel indicators are among the most popular technical analysis tools on Forex and Signal Switched is a promising market analysis tool. Signal Switched can be used as a base for building a strategy or as an addition to an existing one. Signal Switched is a limited range (corr
Quatre
Maryna Shulzhenko
Quatre is a trend indicator, it indicates well the points of the beginning of the trend and its completion or reversal. This indicator is characterized by the following behavior: After a trend movement appears on the market, the indicator sends a signal of its beginning in the form of arrows. Quatre is a mathematical averaging of prices, and based on this, one can assume the direction of price movement (trend) in the future. Against the background of insignificant fluctuations, it is possible t
Secured
Maryna Shulzhenko
This tool scans the market looking for the correct entry. You can see and evaluate it yourself, perhaps it will suit you for a number of tasks related to forecasting price movements. It uses only price data and analytics to calculate entry points. Does not use auxiliary indicators. It has two parameters for customization. Setting the indicator. Interval - price analysis interval. Subterfuge - analysis correction interval.
필터:
리뷰 없음
리뷰 답변