 MetaTrader 5
 Experts
 지표
 라이브러리
 유틸리티
 위젯
 규칙
MetaTrader 5용 기술 지표 - 213
 기술 지표의 시그널은 주식 및 외환 시장에서 거래를 개시 및 종료하는 데 중요한 역할을 합니다. 지표의 본질은 미래의 가격 변화를 예측하기 위한 금융 시그널 값의 수학적 변형입니다.
기술 지표를 테스트하여 시장 행동과 그로 인한 이익을 더 잘 예측할 수 있습니다.

Relative Volume Profile (RVP) Stop guessing where the smart money is trading. See the exact price levels that matter. Overview Traditional Volume Profiles tell you where volume occurred, but they leave out a crucial piece of the puzzle: intensity . The Relative Volume Profile (RVP) is a next-generation charting tool that fuses standard price profiling with Relative Volume (RVOL) analysis. Instead of drawing plain, monotone blocks, RVP color-codes every single price level based on aggressive buyi

# Adaptive Slope Ribbon - ATR-normalised regression slope ribbon
*Category: Trend | Difficulty: intermediate | Window: separate window below the chart | Markets: Universal (Forex, indices, commodities, crypto, stocks) | Suggested timeframes: M15, M30, H1, H4, D1*
## Short description
> Five linear regression slopes over growing horizons, normalised in ATR units and comparable across instruments. The histogram shows the mean slope coloured by the level of agreement between time scales.
## Fu

Nadaraya Watson Envelope Scanner는 하나의 파일에 두 개의 제품을 담고 있습니다. 첫 번째는 지금 보고 있는 차트에 그려지는 Nadaraya Watson Envelope 자체로, 인과적인 Nadaraya-Watson 커널 회귀 중심선, 그 둘레에 평균 절대 오차로 세운 엔벨로프, 그리고 가격이 엔벨로프 바깥에서 거래된 뒤 다시 안으로 돌아온 자리의 표시입니다. 두 번째는 같은 계산을 심볼 목록에 대해 여러 시간대에서 한꺼번에 돌려 답을 표로 정리하는 보드입니다. 보드는 어디를 볼지 알려 주고, 그 아래 차트는 거기에 실제로 무엇이 있는지 보여 줍니다. 표가 찾아낸 것에 대응하기 위해 두 번째 지표를 붙일 필요가 없습니다. 보드 심볼마다 한 줄, 스캔하는 시간대마다 한 열, 시간대는 최대 네 개, 심볼은 최대 스물여덟 개입니다. 심볼 목록은 쉼표로 구분해 적거나, 보드가 대신 Market Watch 목록을 가져올 수 있습니다. 브로커 접두사와 접미사는 지금 보

Exhaustion Count Scanner는 하나의 파일에 두 개의 제품을 담고 있습니다. 첫 번째는 눈앞의 차트에 그려지는 Exhaustion Count MTF 자체로, 봉마다 찍히는 setup과 카운트다운 숫자, 현재 유효한 Setup Barrier 가격, 그리고 완성된 신호 위의 화살표입니다. 두 번째는 같은 계수를 심볼 목록 전체에 대해 최대 여덟 개 시간대에서 동시에 돌리는 보드입니다. 아홉이나 열셋은 어느 한 종목에서는 드물게 나타나는 사건이며, 보드가 존재하는 이유가 바로 이 경우입니다. 표는 관심목록 전체에서 그것들을 찾아내고, 그 아래 차트는 두 번째 지표를 붙이지 않아도 그것을 만들어 낸 계수를 그대로 보여 줍니다. 이 파일의 계수 블록은 단일 차트 제품에 있는 블록의 그대로의 사본입니다. 같은 차트 위의 지표와 숫자가 어긋나는 스캐너는 아무도 두 번은 믿지 않는 스캐너이며, 두 파일을 일치시켜 두는 유일하게 믿을 만한 방법은 중요한 부분이 한 번만 존재하는 것입

Wave Trend Oscillator Scanner는 하나의 파일에 두 개의 제품이 들어 있습니다. 첫째는 이 차트의 전용 서브윈도우에 그려지는 Wave Trend 오실레이터 자체입니다. 빠른 선과 느린 선, 그리고 두 선의 차이를 나타내는 히스토그램이 모멘텀이 확장 중인지 감쇠 중인지에 따라 색이 바뀌며, 다이버전스 선은 가격 차트 자체에도 그릴 수 있습니다. 둘째는 같은 계산을 여러 종목과 여러 타임프레임에 한 번에 돌리는 보드입니다. 이 제품은 등급이 실제로 보드 위에 나타나는 계열 내 두 제품 중 하나입니다. Wave Trend 오실레이터는 시장이 구간 안으로 얼마나 깊이 들어갔는지에 따라 교차에 1 또는 2의 등급을 매기기 때문입니다. 보드는 어떤 상품이 교차했고 그것이 얼마나 최근인지를 알려줍니다. 그 아래 서브윈도우는 그 교차를 만든 오실레이터를 보여주므로, 표가 찾아낸 것을 실행하기 위해 두 번째 지표를 붙일 필요가 없습니다. 보드 종목마다 한 행, 스캔하는 타임프레

Half Trend Scanner는 하나의 파일에 두 개의 제품이 들어 있습니다. 첫째는 지금 보고 있는 차트에 그려지는 Half Trend 자체입니다. 시장이 밀어내기 전까지 자기 수준을 유지하는 계단형 추세선, 그 주위의 ATR 채널, 그리고 전환 화살표입니다. 둘째는 같은 계산을 여러 종목과 여러 타임프레임에 한 번에 돌리는 보드입니다. 보드는 어떤 통화쌍이 언제 전환했는지 알려주고, 그 아래 차트는 선과 채널을 보여줍니다. 표가 찾아낸 것을 실행하기 위해 두 번째 지표를 붙일 필요가 없습니다. 보드 종목마다 한 행, 스캔하는 타임프레임마다 한 열이며 최대 4열, 최대 28종목입니다. 종목 목록은 쉼표로 구분해 입력하거나 Market Watch 목록을 그대로 쓸 수 있습니다. 브로커의 접두사와 접미사는 현재 차트에서 자동으로 인식하며 직접 지정할 수도 있습니다. 기본값은 M15, H1, H4, D1의 네 개입니다. 셀은 ^14b 형태로 읽습니다. 추세선이 어느 쪽에 있는지, 그

UT Bot Scanner는 하나의 파일에 두 개의 제품이 들어 있습니다. 첫째는 지금 보고 있는 차트에 그려지는 UT Bot MTF 자체입니다. 서 있는 쪽에 따라 색이 바뀌는 ATR 트레일링 스톱과 전환 화살표이며, 단일 차트 제품이 가진 것과 같은 네 개의 선택적 필터를 그대로 갖추고 있습니다. 둘째는 같은 계산을 여러 종목과 여러 타임프레임에 한 번에 돌리는 보드입니다. 보드는 어떤 상품이 언제 전환했는지 알려주고, 그 아래 차트는 트레일링 스톱을 보여줍니다. 표가 찾아낸 것을 실행하기 위해 두 번째 지표를 붙일 필요가 없습니다. 양쪽 절반이 같은 필터를 돌리므로, 무엇을 신호로 볼 것인가에 대해 보드와 차트가 어긋나는 일은 생기지 않습니다. 필터 모든 필터는 꺼진 상태로 출하됩니다. 각각은 시장에 대한 별개의 가설이며 하나씩 따로 켤 수 있습니다. 추세 필터는 상위 타임프레임의 이동평균과 방향이 맞는 신호만 남기며, 타임프레임과 기간과 계산 방식을 모두 직접 고릅니다. 필터

# Fractal Trend Channel - Structural channel from confirmed swings
*Category: Trend | Difficulty: beginner | Window: chart window (overlaid on price) | Markets: Universal (Forex, indices, commodities, crypto, stocks) | Suggested timeframes: M15, M30, H1, H4, D1*
## Short description
> Step channel built from the last confirmed fractal swings, with a midline coloured by market structure: higher highs and lows, lower highs and lows, or mixed structure.
### Overview
Reading structure through

# Volatility Adaptive MA - Variable speed moving average
*Category: Trend | Difficulty: intermediate | Window: chart window (overlaid on price) | Markets: Universal (Forex, indices, commodities, crypto, stocks) | Suggested timeframes: M5, M15, M30, H1, H4*
## Short description
> A moving average whose smoothing factor is driven by the ratio between short and long term volatility: it accelerates during breakouts and slows down in compressed phases, cutting false crossovers.
### Overview
Eve

# Trend Persistence Index - Persistence versus randomness
*Category: Trend | Difficulty: advanced | Window: separate window below the chart | Markets: Universal (Forex, indices, commodities, crypto, stocks) | Suggested timeframes: M30, H1, H4, D1*
## Short description
> Compares the direction changes actually observed with those expected from a purely random series. Above zero the market persists in one direction, below zero it keeps flipping.
### Overview
In a random walk the sign of the

# Kalman Trend Filter - Level and velocity Kalman filter
*Category: Trend | Difficulty: advanced | Window: chart window (overlaid on price) | Markets: Universal (Forex, indices, commodities, crypto, stocks) | Suggested timeframes: M15, M30, H1, H4, D1*
## Short description
> A two state Kalman filter that simultaneously estimates price level and velocity. The gain self-adjusts: it trusts the model when data are consistent and re-adapts immediately to shocks.
### Overview
The Kalman filter

MT5용 Crypto_Forex 지표 "HTF 볼린저 밴드" - MT5용 전문 지표 "HTF 볼린저 밴드"로 거래 방식을 업그레이드하세요. HTF는 Higher Time Frame(상위 시간대)을 의미합니다. - 볼린저 밴드는 시중 최고의 지표 중 하나로, 완벽한 거래 도구입니다. - 가격 변동의 약 90%는 두 밴드 사이에서 발생합니다. - HTF 볼린저 밴드 지표는 가격 변동 진입 시점을 포함하거나 다른 지표와 함께 사용하는 다중 시간대 거래 시스템에 매우 적합합니다. - 이 지표를 사용하면 상위 시간대의 볼린저 밴드를 현재 차트에 추가할 수 있습니다. Click here to see high quality Trading Robots and Indicators! MQL5 웹사이트에서만 제공되는 오리지널 상품입니다.

# Multi Scale Trend Agreement - Consensus across eight horizons
*Category: Trend | Difficulty: beginner | Window: separate window below the chart | Markets: Universal (Forex, indices, commodities, crypto, stocks) | Suggested timeframes: M5, M15, M30, H1, H4, D1*
## Short description
> Checks price position against its own average on eight geometrically spaced scales and condenses the result into a single score from -100 to +100.
### Overview
A trend worth the name is recognised from whatev

# Directional Efficiency - Net path versus gross path
*Category: Trend | Difficulty: intermediate | Window: separate window below the chart | Markets: Universal (Forex, indices, commodities, crypto, stocks) | Suggested timeframes: M15, M30, H1, H4, D1*
## Short description
> Signed ratio between the net distance travelled by price and the gross path actually covered. It separates straight trends from disorderly advances that burn capital.
### Overview
Two markets can rise by the same amoun

# Trend Age Counter - Regime age versus typical duration
*Category: Trend | Difficulty: intermediate | Window: separate window below the chart | Markets: Universal (Forex, indices, commodities, crypto, stocks) | Suggested timeframes: M30, H1, H4, D1*
## Short description
> Counts how many bars the current regime has lasted and compares it with the average duration of all past regimes on the same instrument. It measures trend maturity, not strength.
### Overview
Every trend indicator answer

# Regression Confidence Baseline - Bands on residual error
*Category: Trend | Difficulty: intermediate | Window: chart window (overlaid on price) | Markets: Universal (Forex, indices, commodities, crypto, stocks) | Suggested timeframes: M15, M30, H1, H4, D1*
## Short description
> Linear regression baseline with bands built on the residual standard error instead of the price standard deviation. Bands widen when the move loses order, not when price runs.
### Overview
Classic volatility band

# Trend Exhaustion Meter - Composite exhaustion score
*Category: Trend | Difficulty: advanced | Window: separate window below the chart | Markets: Universal (Forex, indices, commodities, crypto, stocks) | Suggested timeframes: M30, H1, H4, D1*
## Short description
> A 0 to 100 score combining stretch from the mean, directional saturation and momentum fade. It measures the continuation risk of a move, not its reversal.
### Overview
No single symptom says a trend is about to end, but when se

# Normalized Momentum Z - Momentum in standard scores
*Category: Momentum | Difficulty: intermediate | Window: separate window below the chart | Markets: Universal (Forex, indices, commodities, crypto, stocks) | Suggested timeframes: M15, M30, H1, H4, D1*
## Short description
> Standardises momentum against its own recent historical distribution and returns a z score. A value of +2 marks a thrust stronger than roughly 97 per cent of the instrument recent moves.
### Overview
Raw momentum ha

# Momentum Curvature - Acceleration versus velocity
*Category: Momentum | Difficulty: intermediate | Window: separate window below the chart | Markets: Universal (Forex, indices, commodities, crypto, stocks) | Suggested timeframes: M15, M30, H1, H4, D1*
## Short description
> Measures price acceleration, the second derivative of the smoothed series, and compares it with velocity. It detects loss of thrust before direction changes.
### Overview
Anyone who drives knows the brake pedal acts o

# Rate Of Change Spectrum - Which horizon is driving
*Category: Momentum | Difficulty: advanced | Window: separate window below the chart | Markets: Universal (Forex, indices, commodities, crypto, stocks) | Suggested timeframes: M30, H1, H4, D1*
## Short description
> Standardises the rate of change over six horizons and identifies which one is driving the move. It shows the dominant scale score and its rank.
### Overview
Knowing the market is rising tells you little. Knowing whether it ri

# Impulse Strength Gauge - Movement weighted by volume
*Category: Momentum | Difficulty: intermediate | Window: separate window below the chart | Markets: Universal (Forex, indices, commodities, crypto, stocks) | Suggested timeframes: M5, M15, M30, H1, H4*
## Short description
> Weights every bar by combining body size in ATR units with volume relative to its average, then accumulates the contributions. It separates wide but empty bars from genuinely supported impulses.
### Overview
A wide

# Dual Horizon Momentum Delta - Short versus long, time corrected
*Category: Momentum | Difficulty: advanced | Window: separate window below the chart | Markets: Universal (Forex, indices, commodities, crypto, stocks) | Suggested timeframes: M15, M30, H1, H4, D1*
## Short description
> Compares momentum on two horizons after normalising them by the square root of time, a correction without which the long horizon would always look larger by pure construction.
### Overview
Directly comparing

# Impulse Retrace Ratio - Impulse size versus retracement size
*Category: Momentum | Difficulty: intermediate | Window: separate window below the chart | Markets: Universal (Forex, indices, commodities, crypto, stocks) | Suggested timeframes: M15, M30, H1, H4, D1*
## Short description
> Groups consecutive same sign changes into runs and compares the average size of bullish runs with that of bearish ones. It measures whether impulses are larger, not more numerous.
### Overview
A healthy upt

# Momentum Thrust Counter - Counting thrusts beyond threshold
*Category: Momentum | Difficulty: beginner | Window: separate window below the chart | Markets: Universal (Forex, indices, commodities, crypto, stocks) | Suggested timeframes: M15, M30, H1, H4, D1*
## Short description
> Counts bars moving beyond an ATR multiple and reports the net balance. The total line separates calm from battle, both of which show a balance near zero.
### Overview
Most bars on a chart carry no information: t

# Momentum Divergence Scanner - Divergences without repaint
*Category: Momentum | Difficulty: intermediate | Window: chart window (overlaid on price) | Markets: Universal (Forex, indices, commodities, crypto, stocks) | Suggested timeframes: M15, M30, H1, H4, D1*
## Short description
> Flags price to momentum divergences using confirmed swings only. The arrow appears on confirmation and is never withdrawn, unlike almost every other divergence indicator.
### Overview
Almost every divergence

# Elastic Momentum Band - Momentum driven asymmetric channel
*Category: Momentum | Difficulty: intermediate | Window: chart window (overlaid on price) | Markets: Universal (Forex, indices, commodities, crypto, stocks) | Suggested timeframes: M15, M30, H1, H4*
## Short description
> A channel deforming with momentum: the band favouring the move draws closer to the average, the opposite one moves away. It makes breaks in direction easier and counter breaks more selective.
### Overview
A symm

# Momentum Entropy Filter - Order versus randomness in thrusts
*Category: Momentum | Difficulty: advanced | Window: separate window below the chart | Markets: Universal (Forex, indices, commodities, crypto, stocks) | Suggested timeframes: M30, H1, H4, D1*
## Short description
> Computes the Shannon entropy of the recent momentum distribution and converts it into an order score from 0 to 100. It separates markets with recurring structure from those without regularity.
### Overview
Shannon e

# Realized Volatility Cone - Historical volatility percentiles
*Category: Volatility | Difficulty: intermediate | Window: separate window below the chart | Markets: Universal (Forex, indices, commodities, crypto, stocks) | Suggested timeframes: M30, H1, H4, D1*
## Short description
> Draws realized volatility together with the percentiles of its own historical distribution. It tells whether the current level is high or low for that specific instrument.
### Overview
Knowing that realized vo

# Volatility Forecast EWMA - Forecasting the next bar
*Category: Volatility | Difficulty: advanced | Window: separate window below the chart | Markets: Universal (Forex, indices, commodities, crypto, stocks) | Suggested timeframes: M15, M30, H1, H4, D1*
## Short description
> Estimates next bar volatility with an EWMA model on variance, the same scheme used in portfolio risk management, alongside the volatility actually observed.
### Overview
Every volatility indicator looks backwards and

# Volatility Regime Classifier - Classification with hysteresis
*Category: Volatility | Difficulty: intermediate | Window: separate window below the chart | Markets: Universal (Forex, indices, commodities, crypto, stocks) | Suggested timeframes: M15, M30, H1, H4, D1*
## Short description
> Classifies volatility into four regimes using a hysteresis state machine, eliminating the constant flipping typical of fixed thresholds. The active threshold is drawn.
### Overview
Classifying volatility

Alpha Gold SMC Dashboard - Institutional Order Blocks & AI Scoring Matrix Introduction: Stop guessing and start trading with institutional precision. The Alpha Gold SMC Dashboard is an advanced, all-in-one manual trading assistant designed to give you an unfair advantage. Built specifically for XAUUSD and major forex pairs, this indicator doesn't just paint arrows on a chart; it provides a comprehensive real-time analysis of market structure, momentum, and institutional zones. KEY FEATURES: S

SMC Indicator BOS & CHoCH analyze market structure using Smart Money Concepts The indicator combines BOS (Break of Structure), CHoCH (Change of Character), Fair Value Gaps (FVG), Liquidity Sweep logic and ATR filtering to provide a structured view of market movements and potential trading opportunities. The indicator automatically identifies swing highs and swing lows and monitors structural breaks in the market. BOS (Break of Structure) identifies potential continuation of the current market st

Candle Timer is a candle countdown indicator for MetaTrader 5. It shows how much time is left on up to three timeframes, together with your broker's trading hours, the Asia, London and New York sessions and today's high-impact news — in one compact panel.
You open a trade, and ten seconds later the H1 candle closes with a long wick through your stop. Candle Timer keeps that moment in sight: the countdown sits in the panel and on the price line, so you always know when the candle rolls over.
TI

RegimeShiftPro marks the moment the market changes character — when a quiet or ranging phase turns directional, and when a trend starts to lose its drive. It is a regime indicator, not a moving-average cross: it watches the statistical behaviour of returns and reports a regime change only when the evidence is strong enough. How it works The indicator runs one to three independent change-point detectors on the standardized returns of the symbol. Each detector accumulates evidence for a shift in

NKZ MarginZone GOLD MT5 NKZ MarginZone GOLD is a professional trading indicator for MetaTrader 5 that automatically plots a cascade of margin zones and target levels based on the Chicago Mercantile Exchange ( CME Group ) methodology. Designed specifically for day traders and swing traders trading Gold ( XAUUSD ), major currency pairs, and stock indices. It replaces hours of manual technical analysis with instant, mathematically precise volatility-adjusted levels, showing exactly where institu

# Garman Klass Volatility - An estimator using the whole OHLC
*Category: Volatility | Difficulty: advanced | Window: separate window below the chart | Markets: Universal (Forex, indices, commodities, crypto, stocks) | Suggested timeframes: M15, M30, H1, H4, D1*
## Short description
> A volatility estimator using open, high, low and close instead of closes only. Its ratio to the classic estimate separates intra-bar movement from close-to-close movement.
### Overview
The standard deviation o

# Overnight Gap Risk - The risk stops cannot cover
*Category: Volatility | Difficulty: intermediate | Window: separate window below the chart | Markets: Stocks | Suggested timeframes: H1, H4, D1*
## Short description
> Splits each bar change into gap and intra-bar movement, and reports the share of risk attributable to gaps, the part no stop can protect against.
### Overview
The risk of a position held past the close is not the same as that of the same position closed intraday, and the dif

# Volatility Breakout Projection - Levels projected from the open
*Category: Volatility | Difficulty: beginner | Window: chart window (overlaid on price) | Markets: Universal (Forex, indices, commodities, crypto, stocks) | Suggested timeframes: M5, M15, M30, H1*
## Short description
> Anchors a reference to each session open and projects two pairs of levels computed as fractions of the average daily range. Levels stay fixed for the whole session.
### Overview
If an instrument covers on ave

# Compression Expansion Detector - Squeeze and release
*Category: Volatility | Difficulty: intermediate | Window: separate window below the chart | Markets: Universal (Forex, indices, commodities, crypto, stocks) | Suggested timeframes: M15, M30, H1, H4, D1*
## Short description
> Measures how far short term volatility has narrowed relative to the reference, counts how many bars the compression has lasted and highlights the bars following the release.
### Overview
Volatility is not stable:

# Intraday Volatility Seasonality - Hourly volatility profile
*Category: Volatility | Difficulty: intermediate | Window: separate window below the chart | Markets: Universal (Forex, indices, commodities, crypto, stocks) | Suggested timeframes: M5, M15, M30, H1*
## Short description
> Builds the instrument average hourly volatility profile and compares it with the actual range of the current bar. It separates normally quiet hours from genuine anomalies.
### Overview
Intraday volatility is n

# Downside Upside Vol Ratio - Risk asymmetry
*Category: Volatility | Difficulty: intermediate | Window: separate window below the chart | Markets: Universal (Forex, indices, commodities, crypto, stocks) | Suggested timeframes: H1, H4, D1*
## Short description
> Computes two separate semi-deviations, one on negative returns only and one on positive ones, and reports their proportion. It measures an asymmetry standard deviation conceals.
### Overview
Standard deviation treats an upward and a

# Volatility Shock Decay - Half-life of post-shock recovery
*Category: Volatility | Difficulty: advanced | Window: separate window below the chart | Markets: Universal (Forex, indices, commodities, crypto, stocks) | Suggested timeframes: H1, H4, D1*
## Short description
> Estimates the persistence coefficient of volatility and derives its half-life, how many bars a deviation from normal needs to halve. It also shows the size of the current shock.
### Overview
When volatility explodes, the

# Volume Price Efficiency - Lo spessore del mercato
*Categoria: Volume | Difficolta: intermedio | Finestra: finestra separata sotto il grafico | Mercati: Universale (Forex, indici, materie prime, crypto, azioni) | Timeframe consigliati: M5, M15, M30, H1, H4*
## Descrizione breve
> Misura quanto prezzo viene spostato da una unita di volume. Valori alti indicano un mercato sottile, in cui pochi ordini muovono molto; valori bassi indicano assorbimento.
### Panoramica
Quanto prezzo serve per a

ZYRON STRUCTURE is an all-in-one MetaTrader 5 market analysis indicator designed to provide a clear view of Fair Value Gaps, market structure, higher-timeframe bias, trading sessions, and multi-timeframe conditions. The indicator combines several analysis tools into one clean chart system, helping traders monitor price structure without loading multiple separate indicators. Main features: Bullish and Bearish Fair Value Gap detection Historical FVG zones Active and mitigated FVG tracking Partial-

# Cumulative Delta Proxy - Delta estimated from OHLC and volume
*Category: Volume | Difficulty: intermediate | Window: separate window below the chart | Markets: Universal (Forex, indices, commodities, crypto, stocks) | Suggested timeframes: M5, M15, M30, H1*
## Short description
> Estimates the buyer/seller imbalance from the close position within the range, weighted by volume, accumulating it per session in equivalent imbalance bars.
### Overview
True delta, the difference between volume

# Volume Climax Detector - The signature of absorption
*Category: Volume | Difficulty: intermediate | Window: chart window (overlaid on price) | Markets: Universal (Forex, indices, commodities, crypto, stocks) | Suggested timeframes: M15, M30, H1, H4, D1*
## Short description
> Recognises climax bars: exceptional volume, wide range but small body, that is price pushing far and coming back. It marks the bars with arrows on the chart.
### Overview
A volume spike alone means nothing: it can a

# Volume Weighted Range Profile - Rolling window profile
*Category: Volume | Difficulty: advanced | Window: chart window (overlaid on price) | Markets: Universal (Forex, indices, commodities, crypto, stocks) | Suggested timeframes: M15, M30, H1, H4, D1*
## Short description
> Builds a volume profile on a rolling window and extracts the point of control and value area. Unlike session profiles, it does not reshape itself during the day.
### Overview
The volume profile identifies the levels w

# Smart Money Flow Index - Opening versus rest of the day
*Category: Volume | Difficulty: intermediate | Window: separate window below the chart | Markets: Indices | Suggested timeframes: M5, M15, M30, H1*
## Short description
> Separates money flow between the first session hours and the rest of the day, showing their divergence. A time based convention, not a measure of who is trading.
### Overview
There is a long standing observation in equity market analysis: the first part of a sessio

# Volume Divergence Tracker - Price to volume correlation
*Category: Volume | Difficulty: intermediate | Window: separate window below the chart | Markets: Universal (Forex, indices, commodities, crypto, stocks) | Suggested timeframes: M15, M30, H1, H4, D1*
## Short description
> Measures the rolling correlation between the size of price moves and the change in volume. It recognises when movement loses the support of participation.
### Overview
In a healthy market price and volume move tog

# Effort Versus Result - Four bar categories
*Category: Volume | Difficulty: intermediate | Window: separate window below the chart | Markets: Universal (Forex, indices, commodities, crypto, stocks) | Suggested timeframes: M15, M30, H1, H4, D1*
## Short description
> Classifies every bar by comparing effort, the volume, with result, the range, both as standard scores. Four categories with distinct operational meaning follow.
### Overview
The effort versus result principle is one of the fou

# Accumulation Phase Scanner - Compressed range, high volume
*Category: Volume | Difficulty: intermediate | Window: separate window below the chart | Markets: Universal (Forex, indices, commodities, crypto, stocks) | Suggested timeframes: M15, M30, H1, H4, D1*
## Short description
> Recognises accumulation phases by combining three conditions: range compressed versus normal, volume above average and no net price progress.
### Overview
Accumulation has a recognisable signature: price stays

# Relative Volume Heatmap - Volume relative to its own hour
*Category: Volume | Difficulty: beginner | Window: separate window below the chart | Markets: Universal (Forex, indices, commodities, crypto, stocks) | Suggested timeframes: M5, M15, M30, H1*
## Short description
> Compares the bar volume with the historical average of the same hour band and colours it on four levels. It spots genuine participation anomalies, not clock effects.
### Overview
Absolute volume is nearly useless on int

# Liquidity Vacuum Finder - The empty corridors of price
*Category: Volume | Difficulty: advanced | Window: chart window (overlaid on price) | Markets: Universal (Forex, indices, commodities, crypto, stocks) | Suggested timeframes: M15, M30, H1, H4, D1*
## Short description
> Identifies price bands crossed on low volume, where nothing will slow price on its return. It draws the nearest vacuum above and below current price.
### Overview
The concept is the exact complement of the volume prof

# Percentile Rank Oscillator - Thresholds that are frequencies
*Category: Oscillators | Difficulty: beginner | Window: separate window below the chart | Markets: Universal (Forex, indices, commodities, crypto, stocks) | Suggested timeframes: M15, M30, H1, H4, D1*
## Short description
> An oscillator based on the percentile rank of price within its own recent distribution. A value of 90 always and everywhere means price is higher than ninety per cent of observations.
## Full description
###

# Adaptive Stochastic Bands - Soglie che si muovono
*Categoria: Oscillatori | Difficolta: intermedio | Finestra: finestra separata sotto il grafico | Mercati: Universale (Forex, indici, materie prime, crypto, azioni) | Timeframe consigliati: M15, M30, H1, H4, D1*
## Descrizione breve
> Oscillatore con bande calcolate sulla propria distribuzione recente invece che con soglie fisse. In un trend forte le bande si alzano e i falsi segnali contrari spariscono.
## Descrizione lunga
### Panoramic

# Mean Reversion Pressure - Deviation that actually pays
*Category: Oscillators | Difficulty: advanced | Window: separate window below the chart | Markets: Universal (Forex, indices, commodities, crypto, stocks) | Suggested timeframes: M30, H1, H4, D1*
## Short description
> Measures price deviation from the mean and weights it by the market actual tendency to revert, estimated on recent data. It signals only when the deviation is exploitable.
## Full description
### Overview
It is not en

# Cycle Phase Oscillator - Cycle position in degrees
*Category: Oscillators | Difficulty: advanced | Window: separate window below the chart | Markets: Universal (Forex, indices, commodities, crypto, stocks) | Suggested timeframes: M30, H1, H4, D1*
## Short description
> Expresses the market position in its own cycle as a phase angle from minus one hundred eighty to plus one hundred eighty degrees, with an amplitude measure indicating how reliable the phase is.
## Full description
### Over

# Dual Range Oscillator - Two ranges compared
*Category: Oscillators | Difficulty: beginner | Window: separate window below the chart | Markets: Universal (Forex, indices, commodities, crypto, stocks) | Suggested timeframes: M15, M30, H1, H4, D1*
## Short description
> Measures the price position within two ranges of very different length and shows their difference. It separates a move just started from one already mature on every scale.
## Full description
### Overview
Price can sit at t
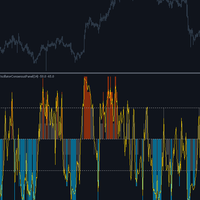
# Oscillator Consensus Panel - Four comparable oscillators
*Category: Oscillators | Difficulty: intermediate | Window: separate window below the chart | Markets: Universal (Forex, indices, commodities, crypto, stocks) | Suggested timeframes: M15, M30, H1, H4, D1*
## Short description
> Computes four oscillators built on different principles and makes them comparable by converting them into percentile ranks, before aggregating them into a consensus measure.
## Full description
### Overview

# Extreme Reading Frequency - How rare is this extreme
*Category: Oscillators | Difficulty: intermediate | Window: separate window below the chart | Markets: Universal (Forex, indices, commodities, crypto, stocks) | Suggested timeframes: M15, M30, H1, H4, D1*
## Short description
> Measures how frequently the oscillator has crossed the thresholds over recent bars. A rare extreme is informative, a frequent one is simply that market norm.
## Full description
### Overview
When an oscillator

# Volatility Scaled RSI - Strength separated from volatility
*Category: Oscillators | Difficulty: intermediate | Window: separate window below the chart | Markets: Universal (Forex, indices, commodities, crypto, stocks) | Suggested timeframes: M15, M30, H1, H4, D1*
## Short description
> A relative strength index where every change is normalised by the volatility of its own moment. It measures pure direction instead of a blend of direction and volatility.
## Full description
### Overview

# Overbought Duration Tracker - How long the extreme has lasted
*Category: Oscillators | Difficulty: intermediate | Window: separate window below the chart | Markets: Universal (Forex, indices, commodities, crypto, stocks) | Suggested timeframes: M15, M30, H1, H4, D1*
## Short description
> Measures how many bars the oscillator has spent in the extreme zone and compares it with the average duration of past stays. It avoids the error of selling on the first overbought touch.
## Full descript

# Reversal Probability Gauge - Historical frequency by analogy
*Category: Oscillators | Difficulty: advanced | Window: separate window below the chart | Markets: Universal (Forex, indices, commodities, crypto, stocks) | Suggested timeframes: M30, H1, H4, D1*
## Short description
> Searches history for bars with a state similar to the current one and counts in what percentage of those cases price then moved the opposite way. It is an observed frequency, not a forecast.
## Full description
#

is a versatile analytical tool designed for both advanced traders and beginners. It combines classic trend line analysis with automatic Fibonacci level plotting to deliver precise market entries and structural clarity. Built as an intuitive and clean on-screen dashboard, this indicator simplifies multi-timeframe analysis without cluttering your main workspace. Technical Analysis and Entry Points The indicator automates the most critical aspects of price action and structural trading: Trend L
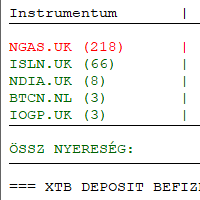
Introducing my indicator in Meta Trader 5. XTB export analysis and charting and export of currency conversion to csv for tax return. This indicator is an independent development and has no official connection with XTB S.A. https://youtu.be/z9JVhqKdKns
Hungary: Meta Trader 5 ben indikátorom bemutatása. XTB export elemzése és chartra kiíratása és adóbevalláshoz deviza konverzió csv.-be exportálása. Ez az indikátor egy független fejlesztés, és semmilyen hivatalos kapcsolatban nem áll az XTB S.A. v

QUANTUM OCEAN SIGNALS MT5
Quantum Ocean Signals MT5 is a multi-filter decision-support indicator for MetaTrader 5. It evaluates trend direction, momentum, directional strength, volatility and candle confirmation to display structured BUY and SELL setups after a candle has closed.
The indicator does not open or manage trades. It gives manual traders a clear trade plan consisting of a signal, an adaptive Stop Loss and three optional Take Profit reference levels.
MAIN FEATURES
• Closed-candle

Level Alert Utility is an essential workflow tool for MetaTrader 5 designed to eliminate constant screen fatigue. Effortlessly drag the interactive level line directly on your chart—the indicator instantly configures trigger rules and delivers real-time notifications via customizable sound repeats, popup alerts, mobile Push notifications, and email. Equipped with high-speed millisecond monitoring, gap and impulse protection, quick-action chart buttons, hotkey support, and state persistence acros

SMC SYNTHRIDERS — Smart Money, Liquidity and Market Phase Trading Indicator SMC SYNTHRIDERS is a MetaTrader 5 market-analysis and signal indicator developed by MohSOLUTIONS . It is designed for traders who analyse price through market structure, liquidity behaviour, Smart Money Concepts, multi-timeframe context and market phases . Rather than generating signals from a single condition, SMC SYNTHRIDERS combines multiple layers of market information to identify conditions where a structured tradin

MACandleApproxPro — Advanced MA Candle Reconstruction & Multi-Dimensional Market Structure Indicator Overview MACandleApproxPro is a comprehensive technical analysis tool designed for professional traders. It breaks through the limitations of traditional moving averages by reconstructing MA data into "MA Candles" through complex algorithms. This unique visualization filters out market noise, allowing you to examine price trends, momentum shifts, and critical market structures from a more

# Level Strength Ranker - Only the two levels that matter
*Category: Support and Resistance | Difficulty: intermediate | Window: chart window (overlaid on price) | Markets: Universal (Forex, indices, commodities, crypto, stocks) | Suggested timeframes: M30, H1, H4, D1*
## Short description
> Scores every level by number of touches, size of reactions and recency, drawing only the strongest one above and below price.
## Full description
### Overview
Not all levels are equal. A level touched
MetaTrader 마켓 - 트레이더를 위한 로봇 및 기술 지표는 거래 터미널에서 바로 사용할 수 있습니다.
The MQL5.community 결제 시스템은 MQL5.com 사이트의 모든 등록된 사용자가 MetaTrader 서비스에서 트랜잭션을 수행할 수 있습니다. 여러분께서는 WebMoney, 페이팔, 또는 은행 카드를 통해 자금을 예치하거나 인출하실 수 있습니다.
