 MetaTrader 5
 Experts
 지표
 라이브러리
 유틸리티
 위젯
 규칙
MetaTrader 5용 기술 지표 - 209
 기술 지표의 시그널은 주식 및 외환 시장에서 거래를 개시 및 종료하는 데 중요한 역할을 합니다. 지표의 본질은 미래의 가격 변화를 예측하기 위한 금융 시그널 값의 수학적 변형입니다.
기술 지표를 테스트하여 시장 행동과 그로 인한 이익을 더 잘 예측할 수 있습니다.

Professional Volume Profile - Institutional Levels - Value Area - HVN/LVN - Naked IVL Gold Institutional Profile is a professional volume analysis indicator designed specifically for XAUUSD (Gold) . Instead of simply displaying volume, the indicator transforms daily volume distribution into a clear and structured Volume Profile , helping traders identify areas of high activity, low-volume regions, value zones, and historically significant volume levels. The indicator was designed to provide a cl

SMC OrderBlock Pro is a professional Smart Money Concepts indicator that automatically detects Institutional Order Blocks.
FEATURES:
Auto Bullish Order Block (Blue) - Last bearish candle before bullish BOS
Auto Bearish Order Block (Orange) - Last bullish candle before bearish BOS
Break of Structure (BOS) Detection
Clean non-repainting boxes - Professional look
Works on ALL symbols: XAUUSD (Gold), EURUSD, GBPUSD, BTCUSD, All Forex
Works on ALL timeframes: M1, M5, M15, H1, H4, D1
P

"See 6 timeframes + never miss a candle close." MTF Candle Countdown — see candles from 6 timeframes on one chart, plus a live countdown that warns you before every candle closes or starts. Overview Stop switching charts. This indicator draws candle clusters from Daily, 1H, 30M, 15M, 5M and 1M side by side on your current chart, with a clear label and a live countdown for each timeframe. Key Features 6 timeframes on one chart — compare Daily down to 1M at a glance Live countdown (MM:SS)

Trendlines Breaks is a MetaTrader 5 indicator designed to automatically detect dynamic trendlines and identify potential price breaks. The indicator analyzes pivot points, calculates trendline slopes, and displays breakout signals when price moves beyond detected trendline levels.
The indicator helps traders analyze market structure by displaying upper and lower trendlines together with breakout markers. It supports different slope calculation methods, including ATR-based, standard deviation-ba

Confluence Trader Indicator — Multi-Filter Signal Tool for MT5 Confluence Trader plots high-probability entries directly on your chart. Trend direction, momentum, and price action are checked together, and an arrow only appears when all of them agree — setups that pass just one or two filters are ignored. Candles are colour-coded to show the prevailing trend at a glance, so you always know which side of the market the tool is favouring. Green arrows mark buy setups, orange arrows mark sell setup

리페인팅 없음, 그리고 실제로 측정했습니다. 4개 심볼과 3개 타임프레임에서 199,984회의 불변성 검사를 수행한 결과 변경은 0건이었습니다. Deep Water가 마감된 봉에 그린 것은 그린 자리에 그대로 남습니다. 개인 투자자의 손실 대부분은 진입이 나빠서가 아닙니다. 유동성 이벤트의 반대편에 서 있었기 때문입니다. 방향은 맞았는데 그 움직임이 시작되기 몇 핍 전에 손절에 걸리는 상황입니다. Deep Water는 그런 이벤트가 발생하는 위치를 표시합니다. 방향을 예측하지 않습니다. 대량 주문이 처리된 곳, 스톱이 사냥된 곳, 그리고 거래량의 뒷받침 없이 나온 움직임을 보여주어, 그 자리에 서 있지 않기로 결정할 수 있게 합니다. 왜 고래인가 차트는 대형 참여자의 흐름을 Whale Bull과 Whale Bear로 표시하고 알림에서도 같은 단어를 쓰므로, 그 뜻을 분명히 밝혀 둡니다. 고래란 규모입니다. 은행, 펀드, 마켓메이커. 그 규모의 주문을 한 번에 체결할 수 있는 주체는

ADX MA: The Ultimate Trend Strength Guide
In forex trading, the Average Directional Index (ADX) is a vital indicator for gauging trend strength. Here's a streamlined approach to using ADX for effective trading:
1. Add ADX to your forex chart. 2. Interpret ADX values: <20 is weak, >40 is strong. 3. Identify trend direction: +DI above -DI indicates an upward trend, and vice versa. 4. Execute trades based on ADX and trend: Strong up trend, consider buying; strong down trend, consider selling; we

Multi-Confluence Reversal Alert | RSI + Heikin Ashi + Divergence + Key Levels | SL/TP Lines | No Repaint
Confluence Reversal Alert is a professional-grade reversal detection indicator for MetaTrader 4. It combines five powerful trading concepts into a single, clean alert system — giving you high-probability reversal signals with automatically drawn Entry, Stop Loss, and Take Profit levels directly on your chart. Designed for traders who use VSA (Volume Spread Analysis), price action, and multi-

Pivot Points Indicator by Thunder FX**
Unlock the hidden structure of the market with the **Thunder FX Pivot Points Indicator** — a clean, powerful, and lightning-fast tool designed for serious traders who want precise support & resistance levels every single day.
Whether you trade Forex, Indices, Crypto, or Gold, this indicator automatically plots the classic **Pivot Point (PP)** along with **R1–R3** and **S1–S3** levels in real time. No more manual calculations. No more guessing. Just cle

Squeeze Momentum Pro — TTM Squeeze Momentum Indicator for MT5
(The old version is named "Dot Histogram Trend for Buy Sell) Squeeze Momentum Pro is a professional Squeeze Momentum indicator for MT5 that combines a volatility squeeze detector with a color‑coded momentum oscillator in a single window. Built on the well‑known TTM Squeeze concept (Bollinger Bands inside Keltner Channels), this MT5 momentum indicator helps forex, indices, metals and crypto traders spot low‑volatility compression befor

ShooterSignal ShooterSignal is a multi-timeframe market structure indicator for MetaTrader 5. The indicator analyzes price data and identifies swing points used to display market structure on the chart. Market Structure The indicator identifies: Higher High (HH) Higher Low (HL) Lower High (LH) Lower Low (LL) These structural points are displayed on the chart according to the selected timeframe. Structure Events ShooterSignal can display structural events based on detected price movement, includ

Nafiyan MTF Indicator Setfiles Nafiyan MTF Indicator is a multi-timeframe technical analysis tool designed to give traders a clear view of RSI, MA trend direction, swing levels, active trades, PnL, and multiple Stochastic signals in one compact indicator. Key Features Multi-Timeframe RSI Table — Monitor RSI across 5 customizable timeframes, with automatic overbought, oversold, and neutral color zones. Multi-Timeframe MA Trend — Displays Bullish, Bearish, or Neutral conditions using Fast/Slow MA

VAMA Signal Simulator는 7개 타임프레임(M1-D1, 가중치 5%~30%)을 스캔하고 각각을 4개의 이동평균선과 6개의 오실레이터로 점수화하여 가중 합산된 Strong Buy/Buy/Neutral/Sell/Strong Sell 신호로 결합합니다. 확인된 신호는 변동성에 따라 기간이 조정되는 H4 이동평균(고변동성 시 기간 단축, 안정장에서는 연장) 방향과 M15·H1 추세 방향 모두와 일치해야 합니다. 확인된 신호마다 방향별로 색상이 지정된 화살표와 BUY/SELL 라벨이 차트에 표시되며, 진입가·ATR·익절·손절 정보가 담긴 CSV 로그도 기록됩니다. SL/TP 거리, 랏 사이즈, 그리고 선택적 재진입 모드(반전을 기다리지 않고 이전 거래가 종료되는 즉시 같은 방향으로 신규 진입)는 모두 Inputs에서 조정 가능합니다 — 기본값은 원래의 1:1 손익비 전략을 그대로 재현하며, 변경 시 명시적인 선택적 이탈이 됩니다. 패널에는 실시간 Win/Loss/Pending

Hexad Grid Market Structure Trading Suite
Hexad Grid Market Structure Trading Suite is an all-in-one MT5 market-structure and price-action indicator designed to keep key trading information on one clean chart.
It includes:
Swing Highs & Lows — selectable 3-candle or 5-candle swing model.
Market Bias — independent 3/5-candle structural bias with confirmed body-close shifts.
Order Blocks — identifies source candles/stacks behind qualified displacement.
Session Highs & Lows — Asia, London

The I ndicator is designed for XAUUSD (Gold) traders who want important market levels and clear directional signals directly on the chart. Instead of filling the chart with unnecessary indicators, it focuses on key price areas from higher timeframes and displays them directly on your trading chart. Main Features H1 and H4 Support & Resistance Levels Automatically selects the most important levels Displays higher-timeframe levels directly on the lower-timeframe chart Separate support and resistan

Crypto_Forex Indicator "RSI FLAT Detector"는 효율적인 트레이딩 보조 도구입니다! 리페인팅 현상이 없습니다. MT5용 이 훌륭한 지표로 트레이딩 기법을 한 단계 업그레이드해 보세요. - 이 지표는 차트에서 가격이 횡보하는 영역을 보여줍니다. "횡보 민감도" 매개변수를 통해 횡보 영역을 감지할 수 있습니다. - "RSI FLAT Detector"는 가격 움직임 진입 확인 또는 다른 지표와 함께 사용할 수 있습니다. - 추세 추종 시스템에서 횡보 영역을 감지하고 해당 영역에서 거래를 피하는 데 사용할 수 있습니다. - 반전 스캘핑에서 횡보 경계를 이용해 반전 거래를 할 수 있습니다. - "RSI FLAT Detector"는 표준 RSI 오실레이터 대신 사용할 수 있는 다양한 활용법이 있습니다. - RSI 자체는 트레이딩에서 가장 인기 있는 오실레이터 중 하나이며, 다이버전스 감지에 매우 유용합니다. - 과매수 영역(70 이상)에서 매도, 과매도 영역(3

Massive Gold SuperTrend Queen M15 - Real Trading Mistakes Edition
Real Trading Mistakes solved by Real Queen.
Most traders lose on Gold because they enter against the trend, late entries, and fake breakouts. This Queen fixes those 3 mistakes.
WHAT IS IT? Powerful SuperTrend based Queen indicator designed for XAUUSD Gold M15. Works on all pairs but optimized for Gold. Shows real trend with massive accuracy. No repaint after bar close.
WHY "Real Trading Mistakes" Edition? Created from YouTube

Alberto Countdown Dashboard is a professional multi-timeframe candle timer dashboard for MetaTrader 5. Monitor the current candle and up to six configurable timeframes from one chart without changing your workspace. Multi-timeframe dashboard - Up to 6 independent MTF countdown rows - Default periods: M5, M15, H1, H4, D1 and W1 - Exact remaining time and progress percentage for every row - Large current-candle countdown and progress meter - Broker server clock and active/paused market status - Pr

McGinley Dynamic Fusion — مؤشر تحليل واتجاه ذكي الوصف المختصر (Short Description) مؤشر بصري متقدم يعتمد على خطي McGinley Dynamic (سريع/بطيء) مع شموع حرارية، إشارات دخول، ومستويات وقف خسارة وأهداف ربح تلقائية لكل إشارة — بدون تنفيذ صفقات. الوصف الكامل (Full Description) McGinley Dynamic Fusion هو مؤشر متكامل مصمم لمساعدتك على قراءة الاتجاه واللحظات المناسبة للدخول بوضوح تام على الشارت، اعتمادًا على خط McGinley Dynamic الشهير بدقته العالية في تتبع السعر مقارنة بالمتوسطات التقليدية. أبرز المميزات خ

# MQL5 Submission - Trend Momentum Signals (Indicator)
Ready-to-paste text for the MQL5 Market. It's an INDICATOR (Product type = Indicators). Honest, no performance claims - it shows signals; the buyer decides.
---
**Product name:** Trend Momentum Signals
**Product type:** Indicators **Account type:** Any
**Short description (top line buyers read first):** Trend-aligned momentum and breakout signal arrows for any symbol and timeframe. Two trend-filtered entry patterns, RSI/ATR confirmatio

이것은 색상으로 구분된 프라이스 액션(Price Action) 지표입니다. 간단히 말해, 시장 모멘텀, 캔들스틱 패턴, 그리고 20기간 추세선(EMA)을 내부적으로 분석한 뒤 차트상의 캔들에 색상을 입혀 현재 시장을 누가 주도하고 있는지 명확히 보여줍니다.
추세가 강한지, 약한지, 혹은 반전되는지 짐작할 필요 없이 색상만 확인하면 됩니다.
적용 가능한 타임프레임 및 종목:
기본적인 프라이스 액션에 기반하므로 모든 종목과 타임프레임에서 사용할 수 있습니다. 마치 피아노 연주 가이드와 같아서, 어떤 곡을 연주할지는 사용자가 결정해야 합니다.
캔들스틱 색상 가이드 (Cheat Sheet)
1. 강력한 움직임 (강한 추세) 이 색상들은 매수세나 매도세가 시장을 완전히 장악했음을 나타냅니다.
진한 파란색 (강한 상승 캔들): 강력한 매수 압력. 가격이 최근 고점을 돌파하고 있습니다. 대응: 매수 기회를 찾으세요.
진한 빨간색 (강한 하락 캔들): 강력한 매도 압력. 가

Swing Volume Profile MT5 Swing Volume Profile Indicator — Auto Swing Detection, Volume Profile, Fibonacci Retracement & RSI Overlay in One Chart Tool Swing Volume Profile (SVP) automatically detects structural swings and displays a volume profile for the most recent completed swing — with Fibonacci retracement and RSI overlay. No manual range selection. No trendline required. The indicator finds the swings and builds the profile automatically. MT5 Native • No Repainting • Auto Swing Detection •

Auto-levels trading robot: key levels & risk manager Short Description: Automatically plots dynamic weekly support and resistance zones with real-time risk tracking. Full Description: Elevate your chart analysis with a dynamic tool designed to map the market structure effortlessly. This indicator automatically calculates and plots critical support and resistance levels based on weekly price action, updating every new week to align seamlessly with current market dynamics. By projecting precise pe

SwingPoint Levels — 지정된 지점에서 거래 레벨을 계산하며, H1부터 일봉까지 모든 종목과 타임프레임에 적용 가능
SwingPoint Levels는 보편적인 가격 구조 논리를 사용하여 거래 레벨을 분석하고 구축하므로, 외환, 주식, 선물, 암호화폐 시장에서 동일한 강력한 분석 방법을 적용할 수 있으며 각 시장에 대한 별도 버전이 필요하지 않습니다. 권장 타임프레임 범위는 H1부터 일봉까지이며, 이 범위에서 가격 구조(고점/저점)가 레벨 계산을 위해 가장 안정적으로 형성됩니다.
이 지표는 사용자가 지정한 극점(Swing High/Low)을 계산을 위한 기준 레벨(앵커)로 사용합니다. 이 지점을 기반으로 거래 레벨 세트가 자동으로 구축됩니다: 진입 구간, 포지션 강화 구간, 이익 실현 목표 레벨, 리스크 제한 레벨(Stop Loss). 진입 레벨과 리스크 제한 레벨은 동시에 동일한 지점에서 계산됩니다 — 트레이더는 시장에 진입하기 전에 거래의 전체 구조를 즉시 확인할

ATR Zigzag With Bollinger Bands Pro Pips Predict 인디케이터 설명 ATR Zigzag With Bollinger Bands Pro Pips Predict는 MetaTrader 5 플랫폼용 전문 기술적 인디케이터로, 여러 강력한 시장 분석 도구를 결합한 것입니다: ATR 기반 지그재그 — 변동성(ATR)에 기반하여 지그재그 구축 볼린저 밴드 — 동적 변동성 채널 메디안 세그먼트 — 중간 지지 및 저항선 예측 모드 — 다음 움직임 예측 핍스 표시 — 핍 단위로 움직임 크기 표시 자동 반떨림 방지 — 모든 시간대에서 깜박임 방지 인디케이터의 목적 이 인디케이터는 다음과 같은 목적으로 설계되었습니다: 추세 움직임 식별 — 지그재그가 시장 구조를 표시 진입 및 청산 포인트 찾기 — 반전 시 매수 및 매도 신호 제공 변동성 평가 — ATR과 볼린저 밴드를 통해 목표 예측 — 핍 단위로 잠재적 움직임 계산 리스크 관리 — 메디안 세그먼트의 지지 및 저항 레
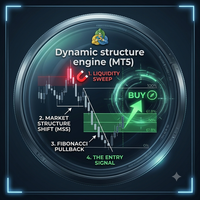
Dynamic Structure Engine (DSE) The Ultimate Quantitative Algorithmic Engine for Market Structure & Smart-Money Tracking. Stop guessing where the true institutional levels are. The Dynamic Structure Engine (DSE) is a premium, rule-based institutional tracker designed to automate your entire top-down analysis. By combining multi-timeframe trend filtering, dynamic volatility adjustments, and real-time liquidity sweep detection, DSE provides pristine, high-probability trade setups directly on your c

Neuron Squeeze reads the volatility cycle. Bollinger Bands contracting inside the Keltner Channels is the signature of a market storing energy; the bands pushing back outside is the signature of a market spending it. This indicator marks both states bar by bar on the zero line, drives a four-colour linear-regression momentum histogram that shows which side is in control and whether that control is building or bleeding away, and grades the depth of every coil on a panel so a shallow pause never r

Candle Pulse Countdown is a clean and customizable candle-close timer for MetaTrader 5. See exactly how much time remains before the active candle closes, synchronized with the broker server time. Trade with better timing awareness Use the countdown to prepare for candle-close confirmations, avoid entering without noticing an imminent close and keep discretionary PO3 or CRT (Candle Range Theory) analysis aligned with the selected timeframe. Main features Live countdown for the active candle Floa

Neuron MacD is a MACD you can read at a glance instead of squinting at. The histogram is split into four colours — not two — so each bar tells you which side of zero it sits on and whether it is still growing or already shrinking. The MACD line changes colour the moment it crosses its signal, a dot marks every cross on the signal line itself, and the whole calculation can be pulled from a higher timeframe while you trade a lower one. It is an indicator for chart analysis only: it draws on the ch

Ranked Support & Resistance Zones – Graded Strength Scoring Automatically detects support and resistance zones and ranks each one by strength — Weak, Standard, Strong, or Mitigated — so you instantly know which levels the market actually respects.Most S/R indicators draw lines. This one tells you which lines matter.
NOEL_RankedSR_Zones scans price action and builds zones automatically, then scores each one in real time based on how many times it's been tested and how cleanly price has reacted.

FXPRG Smart Trend Break is a signal indicator for MetaTrader 5. It combines price-action analysis with a built-in optimization engine that searches historical closed candles and selects a suitable profile separately for the current symbol and timeframe. The internal optimized settings remain protected. The user sees the resulting signals and performance rate without seeing the selected technical parameters. Main Features Clear BUY and SELL arrows. Entry, Take Profit and Stop Loss levels. Signals

NovaTrend ELITE Scanner This Scanner Scans the market to locate and display fresh signals from this indicator: https://www.mql5.com/en/market/product/186639?source=Site +Market+My+Products+Page IT Find the markets where trend strength is actually building — before you waste time opening dozens of charts. NovaTrend ELITE Scanner is a multi-symbol, multi-timeframe market scanner built around the NovaTrend Adaptive Trend Strength engine. Instead of simply reporting whether price is moving up or do

Stop Adding... Start Building... What if one indicator was all you needed?
MQLTeam Mega Indicator는 MetaTrader 5를 위한 혁신적인 차트 패널입니다.
45개 이상의 인기 지표를 하나의 통합된 엔진으로 결합하여 복잡한 차트와 무거운 템플릿을 대체합니다.
현대적이고 매끄러운 사용자 경험으로 전문적인 분석이 필요한 Forex, Gold (XAUUSD), 지수 및 Crypto 트레이더를 위해 설계되었습니다. 추가 MQLTeam 도구 지속적으로 MT5 속성 창을 열고 수십 개의 개별 파일을 관리하는 대신, 차트에서 직접 도구를 즉시 추가, 구성 및 숨길 수 있습니다. 45개 이상의 내장 지표 Moving Averages: SMA, EMA, SMMA, LWMA, HMA, JMA, VWMA, DEMA, TEMA, AMA, FrAMA, VIDYA, McGinley. Oscillators: RSI, MACD, St

LAUNCH SALE: $50 — price increases $50 every 10 sales. Lock in the lowest price now.
Heatmap Zone is a rolling volume-based trading tool built for traders who want to see where real volume is concentrated, not just where price has been. Instead of a static profile that only updates at the end of a session, Heatmap Zone builds and projects the volume picture live, bar by bar, directly on your chart.
It combines volume heatmap visualization, a smoothed Point of Control, a fully configurable

Trend Compass — Adaptive Trend Indicator with Multi-Timeframe Confirmation for MetaTrader 5 Overview Trend Compass is a MetaTrader 5 indicator that combines an adaptive trend line, a dynamic volatility channel, and a multi-timeframe confirmation panel in a single tool. Unlike classic moving averages, the line speeds up or slows down on its own depending on how efficiently price is actually moving — so it lags less in trends and stays quieter in ranging markets. The indicator is non-repainting: v

English Introduction Pure Structure Gold Signal is a price-structure indicator designed for Gold trading on MT5. The indicator analyzes market structure, breakout behavior, trend conditions, and price position to identify potential BUY and SELL signals. How to Use When a BUY or SELL signal appears, it indicates that the indicator has detected a relatively clear structure breakout and a potential trend-trading opportunity. When no BUY or SELL signal appears, traders can use the colored candle

Stop Watching the Moving Average. Get Alerted. Moving Average Alert automatically monitors price interaction with your Moving Average and alerts you when your selected candle and price-action conditions occur. Don't settle for a basic MA crossover alert. KEY FEATURES Close Above MA
Detect bullish candles closing above the Moving Average. Close Below MA
Detect bearish candles closing below the Moving Average. Close Above/Below MA
Monitor both bullish and bearish MA breaks. Touc

Indices Metals MTF Scanner Scan major global indices and precious metals across multiple timeframes from one professional dashboard. The CapitalSol Indices Metals MTF Scanner is a multi-symbol and multi-timeframe market analysis tool for MetaTrader 5. It provides a structured overview of bullish and bearish market conditions across selected indices and metals without the need to open and analyze every chart individually. The scanner evaluates the relationship between a Fast EMA and Slow EMA on f

NOEL VTT – Tendance de la Traînée Vectorielle avec Score Z adaptatif ATR et RSI Au cœur de cette zone se trouve un centre de tendance projeté vers l’avant par la vitesse du prix — pas une simple moyenne mobile, mais une ligne qui s’adapte à la vitesse réelle du marché. Entouré d’un sentier ATR à cliquet : il ne fait que se resserrer à votre avantage, ne se desserre jamais, donc vous voyez toujours un niveau d’arrêt propre, non repeint.
At its core is a trend center projected forward by price ve

Session Volume Profile — Stepped POC & Value Area Short description (MQL5 summary field) Multi-session Volume Profile displaying POC and Value Area (VAH/VAL) as developing step lines. Tokyo, London, New York, Daily and a custom session can be displayed simultaneously, each with its own hours, its own levels and its own colour. Works with both real volume (futures, stocks) and tick volume (Forex, CFDs). Full description The problem A standard Volume Profile draws a flat POC line across the whole

LIVE SIGNAL MONITORING https://www.mql5.com/en/signals/2388341?source=Site+Signals+My
Trades on the monitored account are opened and managed manually using setups generated by Pending Stop Vintage MT5. The indicator does not execute trades automatically. PENDING STOP VINTAGE MT5 Pending Stop Vintage MT5 is a live manual setup generator designed to provide a complete pending-stop trading plan with Entry, Stop Loss and three Take Profit levels. It is not a conventional indicator that fills the hi

Ichimoku Multi Timeframe PRO reads the full Ichimoku Kinko Hyo system on four timeframes at once and answers the only question that matters when you are about to act. Are the timeframes agreeing right now, and when did they start agreeing. The free dashboard tells you what the market is doing. This version tells you when that picture actually changed.
For each of the four timeframes the panel combines four honest Ichimoku readings. The position of price against the Kumo, the relationship betwee

Gold Plus Indicator(Profit Plus Indicator) — Advanced Trading Indicator
Gold Plus Indicator is an advanced trading indicator designed to help traders identify potential market opportunities, understand market conditions, and manage trades with a clear and structured approach.
It combines multiple technical analysis tools, trend confirmation, reversal detection, multi-timeframe analysis, and built-in trade management levels into one easy-to-use system.
Main Features
- Smart Buy & Sell Sign

The 5-minute Forex scalping strategy using the Bollinger Bands indicator is a simple system you can use to trade the foreign exchange (Forex) market when it is ranging (moving sideways without a clear direction).
The Bollinger Bands indicator consists of three lines, each serving a specific function in this 5-minute scalping system: the upperger BollinBand is used to sell or take profits on a buy trade initiated at the lower band; the lower Bollinger Band is used to buy or take profits on a

MAKO Market Structure - BOS CHoCH 스캐너 | Structure Before Prediction
아직도 고점과 저점을 손으로 세고 계신가요?
대부분의 트레이더는 캔들을 보지 구조를 보지 않습니다. 없는 곳에 고점을 표시하고, 풀백을 반전으로 착각하며, 움직임이 끝난 후에야 CHoCH를 알아차립니다. 결과: 늦은 진입, 스탑 헌팅, 노이즈로 가득한 차트.
MAKO Market Structure는 그것을 끝내기 위해 만들어졌습니다. 가격 움직임을 깨끗하고, 정리되고, 즉각적인 구조 리딩으로 변환합니다 - 시각적 오염 없이.
해결하는 문제:
- 수동으로 표시된 고점과 저점으로 지저분한 차트 - 어디가 진짜 BOS이고 어디가 단순 유동성 스윕인지 실시간으로 구분하기 어려움 - 이미 반전된 후에야 보이는 CHoCH - 어디를 관찰해야 할지 명확한 기준이 없는 풀백
MAKO 솔루션:
각 캔들을 개별적으로 분석하는 대신, 인디케이터는 가격의 구조적 시퀀스를

Designed for Gain & Pain Markets ED Precision Reversal Pro has been designed with Gain and Pain markets as a key focus. These markets can produce strong directional movements, rapid price extensions and sudden reversals. The indicator is designed to monitor overextended market conditions and identify potential reversal areas where its configured BUY or SELL conditions are met. It can be used on: Gain Markets Pain Markets XAUUSD (Gold) Forex pairs Indices Other MetaTrader 5 instruments Gain & Pai

The Trade Time Alert alerts you when the time has passed since your trade was opened. For example, for prop trading, you are not allowed to close your trade for less than 30 seconds. By setting the number to 30, it will alert you when your trade time has passed 30 seconds, so you can close your trade after that.
You can also adjust the parameters as you wish. I have listed the adjustable parameters below for you.
input parameters: Alert After Seconds Alert after (seconds) Alert

EN — Short Description Piticular is a professional Expert Advisor for MetaTrader 5, built for precise and disciplined trading. It combines intelligent market structure analysis (slope angle, deviation, channel width) with flexible lot management — fixed or automatic risk-based — and strict series control (up to 8 orders per series). Every order has its own independent Stop Loss, Take Profit, and trailing stop, with built-in requote protection and full ECN support. Recommended for ECN/RAW accou

ZigZag Market Structure Breakout Pro ZigZag Extras Display BreakOut points is a MetaTrader 5 indicator for traders who use ZigZag, breakout points, market structure, BOS, CHoCH, swing high, swing low, support and resistance, and higher timeframe bias in their trading analysis. Main Benefits Displays confirmed ZigZag swing highs and swing lows Marks BOS Up, BOS Down, CHoCH Up and CHoCH Down Shows Depth Highest High and Depth Lowest Low lines Adds HH, HL, LH and LL structure labels Includes HTF bi

Hyper Reversal Pattern Hyper Reversal Pattern (HRP) is a market-turning-point indicator designed to identify moments when a directional move may be reaching exhaustion and price begins to show evidence of reversal. Rather than reacting to a single technical condition, HRP evaluates multiple dimensions of market behavior and waits for a meaningful reversal setup to form before printing a signal. The result is a selective visual indicator intended to help traders identify potential short-term and

ICT Kill Zones + Liquidity Sweep Detector (Turtle Soup / Judas Swing) A clean, automated ICT session tool that draws the key intraday Kill Zones, detects liquidity sweeps, and visually maps out the classic Turtle Soup / Judas Swing trade setup. ## Overview The ICT Kill Zones + Liquidity Sweep Detector is built for traders who follow the Inner Circle Trader (ICT) methodology. Instead of manually drawing session ranges or watching for stop hunts, this indicator automatically highlights Asia, Londo

SMC Pro is a chart-window indicator for traders who work with Smart Money Concepts: structure first, then wait for price to return into a high-quality POI. What it shows ZigZag swings on higher-timeframe structure (default H1) and on the chart timeframe BOS (break of structure) and CHoCH (change of character) Equal Highs / Equal Lows (liquidity pools) and an equilibrium midpoint Fair Value Gaps (FVG) filtered by ATR Order Blocks (OB) defined from a strong impulse candle Confluence score: structu

A dual-timeframe trend engine with volume-weighted divergence and market structure confluence. Volume Divergence Pro plots two linear-regression trend readings — a fast one and a slow one — and colors each by whether the volume actively participating in that move is building or fading. On top of that trend picture, it detects regular and hidden divergences between price and momentum, and can require those divergences to agree with the prevailing market structure before showing them. Built for tr

Aurum Retest is a chart-based MetaTrader 5 indicator for traders who prefer to wait for price to return to a defined reaction area instead of chasing an active move.
HOW IT WORKS
The indicator builds a dynamic 0.382-0.618 zone from the selected analysis range. A setup is considered only after price moves through the zone, returns to its boundary and produces a rejection. Buy and sell arrows summarize the resulting setup directly on the chart.
WHAT YOU GET
- Dynamic 0.382 and 0.618 reaction z

Heiken Ashi Smoothed Signals Pro MT5 is a MetaTrader 5 indicator designed for traders who want a cleaner way to read trend direction, momentum shifts, and buy sell signals on the chart. The indicator is based on Heiken Ashi Smoothed candles and adds a higher timeframe filter, confirmed buy sell arrows, momentum circles, alerts, and a compact trading dashboard. Many forex traders struggle with noisy candles, frequent false reversals, and signals that appear against the main market direction. This

XAUUSD Smart Liquidity & SMC Zone Indicator is a high-precision tool designed specifically for Gold (XAUUSD) traders operating on M15, H1, and H4 timeframes. It automatically detects key institutional liquidity pools, swing highs/lows, and market structure sweeps. Key Features: Automatic Liquidity Detection: Highlights key areas where institutional stop-losses reside. Multi-Timeframe Optimized: Perfect for Gold scalping and intraday trading. Real-Time Push & Pop-up Alerts: Never miss a liquidity

TC Analyst Terminal brings the analytical power and clean visualization of institutional research desks directly to your MetaTrader 5 charts. Engineered for professional discretionary traders, prop firm analysts, and quantitative traders, this all-in-one terminal combines multi-timeframe oscillator consensus, dynamic pivot levels, candlestick pattern recognition, and an Adaptive Momentum Pulse (AMP) overlay into a unified, interactive dashboard. KEY ADVANTAGES Interactive On-Chart Dashboard: Dr

Monster Breakout Index V2 is a clean, visual momentum indicator engineered to spot potential breakout opportunities by evaluating extreme price extensions against median historical range channels. Overview The indicator continuously monitors the median price across a configurable lookback window and compares it against current high and low extremes. When price expansion breaks out of the established median bounds, MBI V2 immediately plots distinct histogram bars in a separate window, allowing tr

Heiken Ashi Stacked Pro is a chart overlay indicator that combines smooth Heiken Ashi visual trend candles, a real-time bar completion timer, and an on-hover crosshair HUD for instant price and wick-to-body ratio diagnostics. Marketplace Description Overview Heiken Ashi Stacked Pro upgrades standard Heiken Ashi candle visuals with an interactive HUD. Designed for trend followers and price action traders, it filters out market noise using colored candles while supplying precise candle metric read

Aurex Fibonacci OTE Zone Smart Market Structure • Fibonacci OTE • CHoCH • Dynamic Swing Tracking Aurex Fibonacci OTE Zone is a professional MT5 chart indicator designed to help traders identify market structure, swing movements, Change of Character (CHoCH), and Fibonacci Optimal Entry (OTE) zones directly on the chart. Instead of manually drawing Fibonacci levels after every market move, the indicator automatically tracks the evolving market structure and updates the relevant Fibonacci levels as

Risk Calculator MT5 CoguaTrader Risk Calculator MT5 CoguaTrader is a position sizing utility designed to calculate the appropriate trading volume based on a fixed monetary risk, entry price and stop loss. The calculation is performed directly on the chart. Simply position the Entry and Stop Loss lines where you plan to trade, and the calculator automatically determines the required trading volume. Main Features Fixed monetary risk per trade Automatic position size calculation Drag-and-drop Entry

Vantage Reversal Signal — Precision Turning-Point Arrows for MetaTrader 5 Overview Reversals don't announce themselves — most traders catch them a few candles too late, once the move has already run. Vantage Reversal Signal closes that gap: it tracks momentum as it swings out of extreme territory and marks the exact bar where the shift is confirmed, with a crisp, unmissable arrow placed right where the action is. No second window, no squinting at oscillator lines — just a clean signal on the pri

PHOENIX INSTITUTIONAL INTELLIGENCE Advanced Institutional Market Analysis & Swing Trader Intelligence for MetaTrader 5 Phoenix Institutional Intelligence is a multi-layer market analysis system designed to help traders understand market structure, liquidity, institutional zones, displacement, premium/discount location, multi-timeframe alignment, and overall market confluence from one integrated engine. The system continuously analyzes the market in the background while keeping the chart clean a

Allocation Pulse Corridor — Adaptive Reversal Indicator for MetaTrader 5 Overview Allocation Pulse Corridor is a volatility-adaptive reversal indicator for MetaTrader 5 designed to identify short-term price exhaustion and potential mean-reversion areas. The indicator monitors brief price pulses — moments when the market moves beyond its recent trading range — and marks the point where that movement begins to fade. Instead of relying on a fixed price distance, Allocation Pulse Corridor

Professional Support & Resistance Signal Indicator v1.00 Identify key levels. Read market structure. Trade with greater clarity. Professional Support & Resistance Signal Indicator is a comprehensive MetaTrader 5 analysis tool designed for traders who want a clear, structured view of important market levels and potential trading opportunities. Instead of manually searching the chart for Support and Resistance, the indicator continuously analyzes price action using a proprietary multi-factor analy

Gann Swing & Overbalance MT5 is a technical analysis indicator for MetaTrader 5 designed to build a confirmed swing structure and analyze Price and Time Overbalance according to Gann-inspired swing analysis principles. The indicator identifies confirmed swing highs and lows, classifies market structure as HH (Higher High), HL (Higher Low), LH (Lower High) and LL (Lower Low), and compares consecutive price and time movements to highlight potential Overbalance conditions. Main Features • Confirmed

Professional Market Analysis & Trading Signals for MetaTrader 5 Dualx Signal Scalper is a professional, versatile indicator for MetaTrader 5 , designed to provide traders with a clear visual overview of market trend, market power, price movement, trading ranges, and BUY/SELL signals . Despite its name, Dualx Signal Scalper is not limited to scalping . It is designed for use across all timeframes and can be adapted to different trading styles, from short-term and intraday trading to swing and lon

Consolidation Intelligence Pro MT5 Consolidation Indicator — Automatic Range Detection, 5-Tier Price-Density Heatmaps & Re-Entry Alerts Consolidation Intelligence Pro automatically identifies where price repeatedly overlaps and trades within a concentrated range — then renders that structure as a 5-tier price-density heatmap directly on your chart. No more manually drawing every consolidation box. The indicator analyzes historical price structure, measures candle overlap and body-to-wick charac

Gap Zone Highlighter – Identify Important Gap Zones Across Multiple Timeframes The Gap Zone Highlighter is a MetaTrader 5 indicator designed to automatically detect Buy and Sell Gaps and transform them into clearly visible price zones directly on your chart. Instead of manually searching for gaps and marking relevant price areas, the indicator handles this process automatically. Detected zones are displayed as colored rectangles, making it easy to see where significant Buy or Sell Gaps have form

"CISD Plus" Change in State of Delivery (CISD) Pro is a professional price action indicator designed to precisely detect shifts in market dominance between buyers and sellers. Unlike conventional market structure indicators like Break of Structure (BoS) that rely solely on swing highs and lows, CISD focuses directly on the actual price delivery phase . The indicator tracks the origin of aggressive price moves and validates signals when price closes beyond these crucial levels. Key Features & Adv
MetaTrader 마켓은 과거 데이터를 이용한 테스트 및 최적화를 위해 무료 데모 거래 로봇을 다운로드할 수 있는 유일한 스토어입니다.
어플리케이션의 개요와 다른 고객의 리뷰를 읽어보시고 터미널에 바로 다운로드하신 다음 구매 전 트레이딩 로봇을 테스트해보시기 바랍니다. 오직 MetaTrader 마켓에서만 무료로 애플리케이션을 테스트할 수 있습니다.
