 MetaTrader 5
 Experts
 지표
지표
 라이브러리
라이브러리
 유틸리티
유틸리티
 위젯
위젯
 규칙
규칙
MetaTrader 5용 새 기술 지표 - 178
 기술 지표의 시그널은 주식 및 외환 시장에서 거래를 개시 및 종료하는 데 중요한 역할을 합니다. 지표의 본질은 미래의 가격 변화를 예측하기 위한 금융 시그널 값의 수학적 변형입니다.
기술 지표를 테스트하여 시장 행동과 그로 인한 이익을 더 잘 예측할 수 있습니다.
기술 지표의 시그널은 주식 및 외환 시장에서 거래를 개시 및 종료하는 데 중요한 역할을 합니다. 지표의 본질은 미래의 가격 변화를 예측하기 위한 금융 시그널 값의 수학적 변형입니다.
기술 지표를 테스트하여 시장 행동과 그로 인한 이익을 더 잘 예측할 수 있습니다. 
This indicator is designed according to the combination of WPR and Stoch indicators, when WPR goes up and Stoc goes up quickly too, the price may meet strong resistance, many times short order will take profit, but if the price break through it, Long positions are more likely to be profitable, and the reverse held true as well. You can adjust the parameters of WPR and Stoc to Adapt the symbol you operate. Click here to look the advanced edition: https://www.mql5.com/en/market/pro
FREE
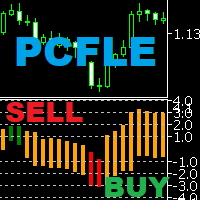
PCFLE Histogram (Price Change From the Last Extreme) - plots the percentage movement from the last extreme. Can be used for graphical representation of percentage movement from last lowest low to current high / from last highest high to current low. Input parametters: InpDigits - the number of decimal places displayed on the y-axis You can set colors and horizontal levels in the indicator properties. Examples of how to trade with the indicator can be found in screenshots.
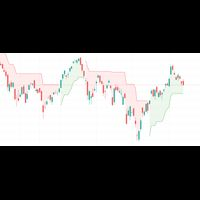
Simple Super Trend indicator for MetaTrader 5. A trend indicator similar to moving averages. Use it for entry and exit signals. It gives accurate signals on precise time. Works as a Trailing SL/TP. This indicator can also be used on multiple timeframes where you place it on a larger timeframe then go to a lower timeframe. Super Trend needs to be used in conjunction with other indicators like rsi, Parabolic SAR, MACD, etc to receive filtered signals.

RSI Scanner is a multi symbol multi timeframe RSI dashboard that monitors Relative Strength Index indicator for price entering and exiting overbought and oversold in up to 28 symbols and 9 timeframes.
Download Demo here (Scans only M2, and M10) Settings description here MT4 version here
RSI Scanner features: Signals RSI entering and exiting the overbought and oversold zones. Monitors 28 customizable instruments and 9 timeframes at the same time. Supports all 21 timeframes of Metatrader 5

Trend Reversal alert: The concept of the EA is to give you a message/alert when something happens in the market, so you will never pass a tradechance for a trendreversaltrade. The EA give you the message when the chance is higher for a trendreversal, but it is important to say that this doesn`t mean that you should trade every signal. The advantage provided by the program is that you don`t need to sit the hole time for the PC and look at the chart because you get a message when a good trendrever
FREE

"Hunttern harmonic pattern finder" base on the dynamic zigzag with the notification and prediction mode
This version of the indicator identifies 11 harmonic patterns and predicts them in real-time before they are completely formed. It offers the ability to calculate the error rate of Zigzag patterns depending on a risk threshold. It moreover sends out a notification once the pattern is complete.
The supported patterns:
ABCD BAT ALT BAT BUTTERFLY GARTLEY CRAB DEEP CRAB CYPHER SHARK THREE DRIV
마지막으로 인터페이스가 편리 해졌습니다. 지금 당신은 마우스로 표시 기간을 제어 할 수 있습니다. 버튼을 클릭하고 마우스 휠을 스크롤하여 참조 기간을 늘리거나 줄이십시오. 이 버튼은 편리한 장소에 배치 할 수 있으며 한 번의 클릭으로 고정 및 사용할 수 있습니다. 하나의 차트에 여러 지표를 설정하고 개별적으로 또는 한 번에 모두 관리 할 수 있습니다. 차트에 간단한 설치를 사용하면 각 표시기의 매개 변수 이름 바꾸기 또는 변경에 대해 걱정할 필요가 없으며 자동 알고리즘 자체가 필요한 개체의 이름을 바꾸고 생성 할뿐만 아니라 사용 후 삭제할 수 있습니다. 이 인터페이스는 가능한 한 편리하며 실제로 수동 개입이 필요하지 않습니다. 이 구성 요소는 종종 자신의 거래 전략에 참조 표시기를 사용하는 사람들을 위해 이상적입니다. 차트에 지속적으로 작업 할 수 있습니다! 테스터에서 작동하지 않습니다. 이 무료 제품에 대한 귀하의 의견을 남길 수있는 큰 요청. 설치 방법:
-차트에"버튼"을
FREE

진정한 수급 지표 - 모든 시간대에서 저항 및 지지 수준의 위치를 빠르게 결정할 수 있습니다. 이 지표는 거래에서 기술적 분석을 사용하는 사람들에게 유용합니다. 표시기는 사용하기 쉽고 차트에서 끌어다 놓기만 하면 표시기가 가장 가능성 있는 지지 및 저항 수준을 표시합니다. 기간을 전환하면 새로 선택한 기간의 수준이 표시됩니다.
추천 로봇 스캘퍼 - 테스트 .
입력 매개변수 Use_price 레이블 - 켜기 /끄다 레벨 근처에 가격 아이콘 표시 가격 수준 색상 - 가격 아이콘의 색상을 선택합니다. 가격 수준 크기 - 가격 아이콘 크기 지원/저항 레벨 색상 - 레벨 색상 선택 내 구독 페이지 , 나는 다른 많은 유용한 제품을 가지고 있습니다. 이 지표가 마음 에 든다면 리뷰를 남겨주세요. 유용한 제품을 무료로 공유할 수 있는 원동력이 됩니다.

Vix 75 and Boom Sniper Entry
= Assistance for Non Beginners traders = Market Structure is KEY =Trading is a Risk ... Know what you are entering into when starting your trading journey
Basically the indicator gives signals due to reach of Support and Resistance, it also give signals on touch of order block. Works Best on Gold and Eurusd and Synthetic Index - its best give accurate confluences with a TDI
TDI settings: RSI Period -10 Bollinger Bands - Period 34 - First indicators Data M

시장 방향을 한눈에 확인 KT Trend Filter는 개선된 추세 분석 방식을 가격 차트 위의 선명한 색상 라인으로 보여 줍니다. 여러 보조지표를 겹치지 않고도 시장이 상승, 하락 또는 횡보 중인지 빠르게 파악할 수 있습니다. Trend Period 기본값 200은 넓은 방향성을 보여 주면서 현재 상태를 쉽게 확인할 수 있게 합니다. 추세 방향을 명확한 시각 정보로 활용 파란색 Uptrend: 강세 시장 상태를 강조하여 자신의 전략에 맞는 매수 기회에 집중할 수 있게 합니다. 연어색 Downtrend: 약세 시장 상태를 강조하여 자신의 전략에 맞는 매도 기회에 집중할 수 있게 합니다. 카키색 Sideways: 추세 조건이 덜 분명할 때 횡보와 혼합 방향을 더 쉽게 알아볼 수 있게 합니다. 거래 중인 차트에서 진입, 포지션 관리 및 시간대 정렬을 위한 빠른 시각 필터로 라인을 활용할 수 있습니다. 9개 시간대에서 더 큰 흐름 확인 선택형 MTF Scanner는 M1, M5, M15,
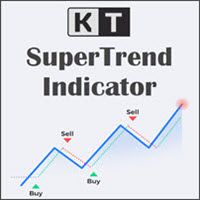
KT SuperTrend는 가격 차트에 하나의 명확한 방향선을 표시합니다. 상승 추세에서는 선이 가격 아래에서 계단식으로 움직이며 추세를 따라가는 기준이 됩니다. 하락 추세에서는 선이 가격 위로 이동해 시장의 하락을 따라갑니다. 가격과 선 사이의 거리는 Average True Range를 기반으로 하므로 변동성이 커지거나 작아질 때 자동으로 조정됩니다. 캔들이 SuperTrend 선의 반대편에서 마감되면 방향이 바뀝니다. 선 위에서 마감하면 상승 추세 신호가 표시되고, 선 아래에서 마감하면 하락 추세 신호가 표시됩니다. 최근 신호 방향과 진입 가격도 차트에 계속 표시되므로 과거 캔들을 찾아보지 않아도 현재 상태를 이해할 수 있습니다. 세 단계로 차트를 확인하세요 현재 선 확인: 선이 가격 아래에 있으면 상승 관점을, 가격 위에 있으면 하락 관점을 뒷받침합니다. 시간대 비교: 내장 스캐너는 M1부터 월봉까지 SuperTrend 방향을 보여 줍니다. 실제 거래하는 시간대의 방향이 일치하
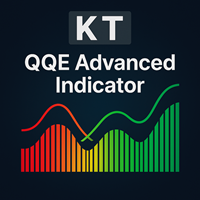
KT QQE Advanced 는 클래식 QQE 오실레이터를 색상 히스토그램과 빠른·느린 Trailing Line(TL) 로 재구성하여 더 정확하게 표현한 개선 버전입니다.
기존 QQE 와 달리, KT QQE Advanced 는 히스토그램 형태에 과매수/과매도 레벨을 표시해 추세의 과열 여부를 직관적으로 확인할 수 있습니다.
활용
MTF 스캐너로 모든 시간대에서 매수·매도 신호를 즉시 탐색. 트렌드 방향을 더욱 정확히 파악. 과매수·과매도 구간을 탐지. 가격 모멘텀을 가시화.
입력값 RSI 기간 스무딩 기간 MTF 스캐너 알림 설정
QQE란? QQE는 Quantitative Qualitative Estimation 의 약자로, 초‑스무딩 RSI 와 ATR 을 결합해 만든 오실레이터입니다. 일반 RSI 대신 Wilder RSI 를 사용하며, 이는 특수한 EMA 방식으로 평활화됩니다. Wilder 평활식 = 이전 MA + (1/n × (종가 − 이전 MA))

지표는 매일 현 상황에 대한 추세와 목표를 보여준다. 이 지표는 또한 시장 상황의 올바른 정의를 세기 위해 손실 처리 거래의 수를 줄인다. 당일 내 분석 및 무역을 위해 설계됨.
사용방법:
파란 선은 당일 목표를 정하는 특별한 4선 공식에 설정된 하루 중 개점 가격을 보여준다. 여러분은 그 추세를 보고 공개할 수 있습니다.
회색 라인이 첫 골이다. 이러한 수준의 희생으로 도달할 때, 그 직책의 일부를 폐쇄하고 그들의 거래를 보호하는 것이 가장 좋다. 이러한 가격대에서는 트렌드 딜을 오픈하는 데 주의할 수 있습니다.
1046년대; "딜리팅"은 현재까지 갈 수 있는 마지막 목표이다. 가격이 그 수준에 근접할 때 대부분의 물량을 마무리하고 거래를 보호하거나, 트렌드 거래를 완전히 종결할 가치가 있다. 이러한 분야에서는 추세를 취하는 것이 권장되지 않는다.
1046년대; 엘티델리온은 꽤 먼 길을 뚫을 수 있지만 거의 뚫지 못한다. 보너스 수익입니다.
비둘기존의 가격이 하루 안에
FREE
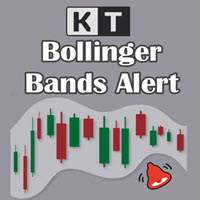
차트에서 모든 볼린저 밴드 터치 모니터링 KT Bollinger Bands Alert는 상단, 중앙 및 하단 볼린저 밴드를 표시하고 현재 캔들이 선택한 밴드에 닿는지 모니터링합니다. 자신의 거래 방식에 필요한 밴드 이벤트를 활성화하면 다른 시장을 살피는 동안에도 중요한 순간을 알림으로 확인할 수 있습니다. 세 밴드의 현재 가격을 한눈에 확인 선택 가능한 가격 태그는 차트에서 상단, 중앙 및 하단 밴드의 현재 값을 따라갑니다. 각 밴드의 색상도 개별적으로 설정할 수 있어 자신의 차트 구성에서 외부 경계와 중앙 기준선을 쉽게 구분할 수 있습니다. 계산 방식과 알림 흐름 설정 볼린저 설정: 기간, 편차, 이동 및 적용 가격을 조절합니다. 차트 기록: 밴드를 표시할 과거 봉의 수를 선택합니다. 밴드 선택: 상단, 중앙 및 하단 밴드 알림을 각각 켜거나 끕니다. 알림 간격: 반복되는 터치 알림을 관리하도록 알림 사이의 최소 시간(분)을 설정합니다. 원하는 방식으로 알림 수신 선택 가능한 소리
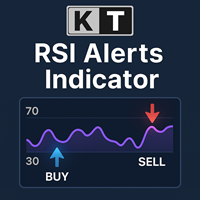
KT RSI Alerts는 RSI(상대강도지수) 오실레이터의 사용자 맞춤형 버전으로, 다음의 네 가지 사용자 지정 이벤트에 대한 신호와 알림을 제공합니다: RSI가 과매수 구간에 진입할 때 RSI가 과매수 구간에서 벗어날 때 RSI가 과매도 구간에 진입할 때 RSI가 과매도 구간에서 벗어날 때
기능 RSI의 과매수/과매도 구간 내 움직임을 기반으로 거래 전략을 구성하는 트레이더에게 매우 적합합니다. 가볍게 설계된 인디케이터로 시스템 자원을 거의 소모하지 않습니다. MetaTrader의 모든 알림 기능을 완벽하게 지원합니다.
RSI(상대강도지수)의 역사 RSI는 J. Welles Wilder가 개발하였으며, 1978년에 출판된 『New Concepts in Technical Trading Systems』와 같은 해 6월 발행된 Commodities 잡지에 처음으로 소개되었습니다. RSI는 모멘텀 오실레이터로 분류되며, 가격 움직임의 속도와 강도를 측정합니다. 상승 종가와 하락 종가

KT Forex Volume은 통화쌍의 매수 및 매도 거래량을 컬러 히스토그램 형태로 표시합니다. 거래량은 자산에 대한 매수 및 매도 거래로 구성됩니다. FX 시장에서: 매수량이 매도량보다 많으면 해당 통화쌍의 가격은 상승하는 경향이 있습니다. 매도량이 매수량보다 많으면 해당 통화쌍의 가격은 하락하는 경향이 있습니다.
주요 기능 틱 볼륨 데이터를 활용하여 나쁜 거래를 피할 수 있습니다. 시장 내 큰 자금을 움직이는 플레이어의 방향에 따라 거래할 수 있도록 도와줍니다. Metatrader의 모든 알림 기능이 포함되어 있습니다.
틱 볼륨 활용하기 기타 시장과 달리, 현물 외환 시장은 중앙 집중식이 아니기 때문에 개인 트레이더가 실제 볼륨 데이터를 얻는 것은 매우 어렵습니다. 2011년 베테랑 외환 트레이더 Caspar Marney가 발표한 연구에서는 틱 볼륨과 실제 거래량 사이에 높은 정확도와 상관관계가 있다고 결론지었습니다.
히스토그램 계산 공식
KT Forex Volume 지표
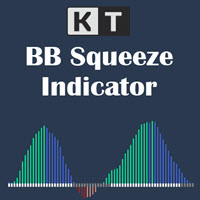
모멘텀이 확장되기 전 변동성 수축 확인 KT BB Squeeze는 변동성 상태와 모멘텀 방향을 하나의 선명한 오실레이터에 결합합니다. Bollinger Bands와 Keltner Channels를 비교하여 시장의 수축 또는 확장 상태를 표시하고, 히스토그램으로 제로선을 기준으로 한 모멘텀 변화를 보여 줍니다. 회색 점: Bollinger Bands가 Keltner Channels 안에 있으며 스퀴즈 또는 수축 구간을 나타냅니다. 흰색 점: Bollinger Bands가 Keltner Channels 밖에 있으며 확장 구간을 나타냅니다. 제로선을 기준으로 네 가지 모멘텀 상태 확인 색상 히스토그램은 방향과 강도를 구분하므로 상승 또는 하락 모멘텀이 강해지는지, 약해지기 시작하는지 쉽게 살펴볼 수 있습니다. 녹색 막대: 상승 모멘텀이 제로선 위에서 강해지고 있습니다. 파란색 막대: 상승 모멘텀이 제로선 위에 있지만 약해지고 있습니다. 빨간색 막대: 하락 모멘텀이 제로선 아래에서 강해지고
Mouse You can draw fibonaccis moving the mouse over the zigzag indicator Pin them You can click on fibonacci with this option and it will no longer be deleted unless you click on it again :) Precision The tuned fibonacci gets the precise point in lower timeframes Enjoy it You can ask me for add more features, so please comment and leave your ranting for me to be happy, thank you :)
FREE
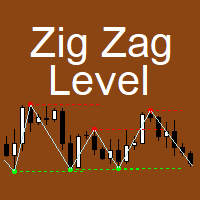
The indicator implements the author's approach to the construction of the popular "Zig-Zag" indicator.
The advantages of the "ZIgZag Level" indicator is that it filters out market noise and shows levels.
"ZIg Zag Level" is based on peaks and troughs, displays levels.
These levels can be disabled and configured.
The indicator displays the price of the level, the price tag can be disabled.
The "zigzag" line between the points can also be disabled.
The indicator has a built-in notification s

Tomamos 5 medios móviles las unimos en una la cual suavizamos y volvemos a suavizar, resultando un mega suavizador de medios móviles suavizadas. Indicador de mql5 funciona en cualquier broker y para todos los tiempos, siendo el mas optimo el de 5, 15 a mas. Funciona mejor en grupo consigo misma osea poner uno de 14 y otro de 50 y 400,, así se observa mejor su desempeño.
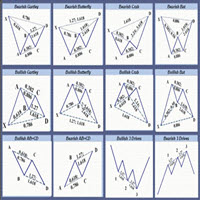
Only 5 copies of the EA at $30! Next price --> $45 Find charts and signals based on harmonic patterns, which work great in 1-hour timeframes and up.
Buy and sell signs based on different harmonic patterns as follows:
0: ABC_D
1: ABCD_E
2: 3Drive
3: 5_0
4: Gartley
5: Bat
6: Crab
7: Butterfly
8: Cypher
9: NenStar
10: Shark
11: AntiBat
12: AntiGartley
13: AntiCrab
14: AntiButterfly
15: AntiCypher
16: AntiNenStar
17: AntiShark
How to use:
When there is an opportunity to buy or sell, you have 5:

ATR Scanner Pro is a multi symbol multi timeframe volatility scanner that monitors and analyzes Average True Range indicator value in up to 28 symbols and 9 timeframes in 3 modes : ATR value: As a volatility dashboard it shows the ATR indicator value in all pairs and timeframes and signals when the ATR value reaches a maximum or minimum in a given duration. Short term ATR/Long term ATR ratio: It shows ratio of 2 ATRs with different periods. It's useful in detecting short term volatility and
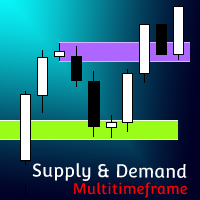
[ MT4 Version ] Supply and Demand Multitimeframe Supply and Demand Multitimeframe is the first indicator in the market that combines multiple aspects like trading volume, price structure and momentum to identify Supply and Demand zones for every asset. The Supply and Demand indicator analyzes simultaneously up to 4 different TFs and represents their information in the current graph. Its interactive UI highlights everytime the price enters a Supply or Demand zone even if the zones are not visible

Indicator and Expert Adviser EA Available in the comments section of this product. Download with Indicator must have indicator installed for EA to work.
Mt5 indicator alerts for bollinger band and envelope extremes occurring at the same time. Buy signal alerts occur when A bullish candle has formed below both the lower bollinger band and the lower envelope Bar must open and close below both these indicators. Sell signal occur when A bear bar is formed above the upper bollinger band and upper
FREE
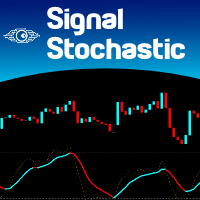
It is the very same classic Stochastic indicator, but with a little twist: we changed the Signal Line with a 2-color line, so we can use it with EAs as a filtering system. And that's it! I know it could seem stupid but I needed that, so I created it. The original formula is right from Metaquote's chest, no additions, no subtractions, it is Stochastics in its core.
So I will not publish here the Stochastics parameters as they are all the same as always... Enjoy!
If you like this indicator, all I
FREE
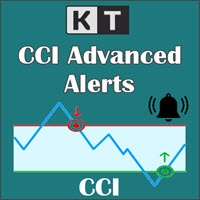
KT CCI Alerts is a personal implementation of the Commodity Channel Index (CCI) oscillator that provide signals and alerts on four custom events: When CCI enter in an overbought zone. When CCI exit from an overbought zone. When CCI enter in an oversold zone. When CCI exit from an oversold zone.
Features A perfect choice for traders who speculate the CCI movements within an overbought/oversold zone. Lightly coded without using extensive memory and resources. It implements all Metatrader alerts.
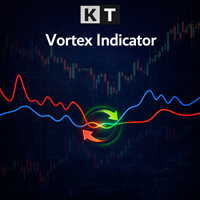
The Vortex Indicator was first presented by Douglas Siepman and Etienne Botes in January 2010 edition of Technical Analysis of Stocks & Commodities. Despite its based on a complex implosion phenomenon, the vortex is quite simple to interpret. A bullish signal is generated when +VI line cross above the -VI line and vice versa. The indicator is mostly used as a confirmation for trend trading strategies. The Vortex was inspired by the work of Viktor Schauberger, who studied the flow of water in tur
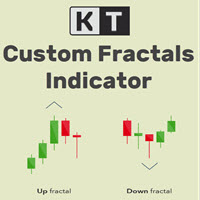
KT Custom Fractals is a personal implementation of the Fractal indicator first introduced by Bill Williams. With KT Custom Fractals you can choose a custom number of bars to allow to the left and right side of the fractal. For example, you can display the fractals that have "three" successive bars with the highest high in the middle and one lower high on both sides , or you can display the fractals that have "Eleven" consecutive bars with the lowest low in the middle and five higher lows on bot

KT Fractal Channel Breakout draws a continuous channel by connecting the successive Up and Down fractals. It provides alerts and also plots the Up and Down arrows representing the bullish and bearish breakout of the fractal channel.
Features
If you use Bill Williams fractals in your technical analysis, you must also include it in your trading arsenal. It can be very effective and useful for stop-loss trailing. A new market trend often emerges after a fractal channel breakout in a new direction.
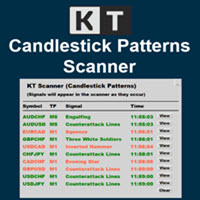
KT Candlestick Patterns Scanner is a Multi-Symbol and Multi-Timeframe scanner that fetches and shows various candlestick patterns on 28 currency pairs and 9 time-frames concurrently . The scanner finds the candlestick patterns by loading the KT Candlestick Patterns indicator as a resource in the background.
Features
The scanner can find the candlestick patterns on 252* combinations of symbols and time-frames from a single chart. Open the signal's chart loaded with a predefined template with a s
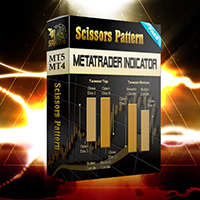
Configure scaffolding charts and signals based on the scissor pattern, which works great at low times.
Buy and sell signs based on 2 previous candle patterns
It works on the active time form, and when detecting the pattern in 4 time frames, 5 minutes, 15 minutes, 30 minutes and one hour, the alert can be set to notify us of the formation of this pattern.
MetaTrader version 4 click here
How to use:
When there is an opportunity to buy or sell, the marker places a scissors mark on the candle

Offer 249 down from 350 for the next 1 copies. then back to 350 $
Are you tired of using outdated indicators that leave you guessing where to set your profit targets? Look no further than the AK CAP Opening Range Breakout Indicator. This powerful tool is backed by a US patent and has already helped countless traders pass funded challenges like FTMO. We use it daily on our prop traders and internal funds, and now it's available to you as well. The calculation behind the indicator is incredibly a
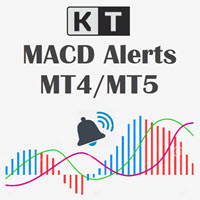
명확한 MACD 모멘텀 신호 KT MACD Alerts는 깔끔한 색상 구분 MACD 화면을 통해 시장 방향과 모멘텀의 변화를 쉽게 파악할 수 있도록 도와줍니다. 상승 및 하락 교차를 명확하게 확인할 수 있으며, 차트의 수직선과 유연한 알림 기능이 새로운 신호에 빠르게 주목할 수 있도록 지원합니다. 신호는 캔들이 마감된 후 확정되므로 차트 전반의 MACD 모멘텀 변화를 명확하고 일관되게 확인할 수 있습니다. 상승 및 하락 상태를 색상으로 구분한 MACD 표시. 교차 신호를 빠르게 찾을 수 있는 선명한 수직선. 조정 가능한 MACD 기간과 적용 가격. 선 색상, 굵기, 스타일 및 차트 확장 설정 지원. 9개 시간대 MACD 스캐너 내장 대시보드는 현재 차트 종목의 MACD 방향을 M1, M5, M15, M30, H1, H4, D1, W1, MN1의 9개 시간대에서 보여줍니다. 각 행은 최신 확정 데이터를 사용해 Bullish, Bearish 또는 Neutral을 표시하므로 단기 모멘텀과

이 알고리즘은 86%*정확도로 단기간의 가격 변화를 예측합니다. 과매수 또는 과매도 상태인 경우,이 표시기가 사용자에게 알립니다. 가격이 신호 촛불보다 높거나 낮은 경우 예측한다. 더 큰 시간 프레임에 평균 복귀 거래,바이너리 옵션 또는 선물 계약에 적합합니다. 이 지표는 5 년간의 데이터에 대해 백 테스트되었으며 시간 경과에 따른 가격 반전을 예측하는 데 90%의 정확도가 있습니다.
특징::
간단한 설정 모든 차트로 드래그 앤 드롭 원하는대로 매개 변수 조정(선택 사항) 경고 사용(선택 사항) 그리고 당신은 완료! 시각 및 오디오 경고 휴대 전화로 직접 전송 경고 터미널로 전송 된 팝업 알림 높은 승률 거래의 90%까지 승리 백 테스트 5 년 여러 통화. (백 테스트 세부 정보 및 분석은 웹 사이트를 참조하십시오). 많은 수의 신호 기대 1 에 2 기호 당 하루 신호*. 당신이 표시가있는 경우*이입니다 30 분 촛불. 유연한 외환,지수,상품 및 주식에서 작동합니다. 어떤 시간
FREE
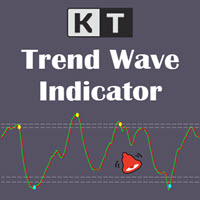
시장 흐름과 함께 Trend Wave 교차 확인 KT Trend Wave는 가격 움직임을 메인 웨이브와 부드러운 신호선으로 구성된 집중형 오실레이터로 보여 줍니다. 가격 차트 아래의 별도 창에 표시되므로 캔들을 가리지 않고 웨이브, 기준 영역 및 교차 마커를 선명하게 확인할 수 있습니다. 선, 영역 및 마커를 함께 해석 연두색 메인선: 더 빠르게 반응하는 추세 웨이브를 보여 줍니다. 빨간색 신호선: 웨이브를 부드럽게 만들어 방향 변화를 쉽게 비교할 수 있게 합니다. 하늘색 상승 마커: 하단 기준 영역에서 메인선이 신호선 위로 교차하는 강세 움직임을 표시합니다. 노란색 하락 마커: 상단 기준 영역에서 메인선이 신호선 아래로 교차하는 약세 움직임을 표시합니다. 차트를 복잡하게 만들지 않고 반응 조절 Wave Period는 메인 웨이브의 가격 반응을 조절하고 Avg. Period는 적용되는 평활화를 조절합니다. 이 두 설정으로 긴 기술 입력 목록 없이 반응성과 부드러움의 균형을 선택할 수

KT Coppock Curve는 평활화된 모멘텀 값을 시장 방향을 보기 쉬운 형태로 보여 줍니다. 가격 차트 아래의 별도 창에 표시되며, 제로 라인이 가장 중요한 기준이 됩니다. 곡선의 작은 변화마다 반응하는 대신 모멘텀이 상승 쪽에 있는지 하락 쪽에 있는지를 빠르게 확인할 수 있습니다. 이 곡선은 장기와 단기의 변화율을 결합한 뒤 결과를 평활화합니다. 따라서 빠른 오실레이터에서 자주 나타나는 노이즈를 어느 정도 줄이면서 더 큰 모멘텀 변화를 추적하는 데 유용합니다. 먼저 위치를 보고 그다음 교차를 확인하세요 곡선이 제로 위에 있으면 양의 모멘텀이 우세합니다. 제로 아래에 있으면 음의 모멘텀이 우세합니다. 곡선이 제로 라인의 한쪽에 계속 머무르면 캔들 하나마다 관점을 바꾸지 않고 현재의 방향 압력에 맞춰 거래하는 데 도움이 됩니다. 제로 라인을 위로 돌파하면 위쪽 화살표가 표시되고, 아래로 돌파하면 아래쪽 화살표가 표시됩니다. 정확한 교차 지점을 눈으로 판단하지 않아도 새로운 모멘텀

ROC는 현재 가격이 이전 기간에 비해 얼마나 빠르게 변했는지를 측정합니다. 따라서 가격이 새로운 스윙 고점이나 저점을 만들었지만 그 움직임을 뒷받침하는 모멘텀이 따라오지 않을 때 특히 유용합니다. KT ROC Divergence는 이런 불일치를 자동으로 찾아 가격 차트와 ROC 창에 서로 대응하는 선을 표시합니다. 고정된 범위 안에서 움직이는 오실레이터와 달리 ROC는 시장의 속도에 따라 값의 폭이 커지거나 작아집니다. 서로 다른 종목의 절대 수치를 비교할 필요는 없습니다. 중요한 정보는 가격 스윙과 오실레이터 스윙 사이의 관계입니다. 트레이더의 언어로 보는 네 가지 패턴 일반 상승 다이버전스: 가격은 더 낮은 저점을 만들지만 ROC는 더 높은 저점을 만듭니다. 가격이 더 내려갔더라도 매도 모멘텀이 약해지고 있을 수 있습니다. 일반 하락 다이버전스: 가격은 더 높은 고점을 만들지만 ROC는 더 낮은 고점을 만듭니다. 가격이 여전히 오르는 동안 매수 모멘텀이 약해지고 있을 수 있습니
이중 라인 신호, 제로 레벨 시스템, 멀티 타임프레임 지원, 사용자 지정 시각적 신호 및 고도로 구성 가능한 알림 시스템을 갖춘 고급 상대 활력 지수(RVI) 지표.
프리랜서 프로그래밍 서비스, 업데이트 및 기타 TrueTL 제품은 제 MQL5 프로필 에서 이용 가능합니다.
피드백과 리뷰는 매우 감사히 받겠습니다!
상대 활력 지수(RVI)란? 상대 활력 지수(RVI)는 John Ehlers가 개발한 모멘텀 오실레이터로, 거래 범위로 정규화하여 시가 대비 종가의 상대적 관계를 비교함으로써 최근 가격 움직임의 확신도를 측정합니다. 기본 원리는 강세 시장에서는 종가가 시가보다 높아지는 경향이 있고, 약세 시장에서는 반대가 성립한다는 것입니다. RVI는 제로 라인 주위를 진동합니다 — 양수 값은 강세 모멘텀을, 음수 값은 약세 모멘텀을 나타냅니다. 지표는 두 개의 라인으로 구성됩니다: 메인 라인(RVI 값)과 시그널 라인(메인 라인의 4봉 대칭 가중 이동 평균). 두 라인 간의 교차는
FREE
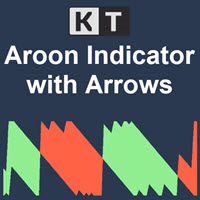
KT Aroon 오실레이터는 1995년 Tushar Chande가 처음 개발한 원래 Aroon 오실레이터를 수정한 버전입니다. 이 지표는 최근 고가와 저가 사이의 시간 간격을 측정하고, 이를 기반으로 시장 추세의 방향과 강도를 계산합니다. 가격은 상승 추세에서는 새로운 고점을 연속으로 형성하고, 하락 추세에서는 새로운 저점을 형성한다는 개념에 기반해 작동합니다. 매수 신호: Aroon Up 라인이 Aroon Down 라인을 상향 돌파할 때.
매도 신호: Aroon Down 라인이 Aroon Up 라인을 상향 돌파할 때.
특징
Aroon 신호를 가격 차트에 표시하는 위/아래 화살표가 표시됩니다. 시장 추세를 효율적으로 보여줍니다. 차트가 복잡하지 않고 깔끔하게 구성됩니다. 모든 MetaTrader 알림 기능을 지원합니다.
입력 설정 기간: Aroon Up 및 Aroon Down 라인을 계산할 기준 기간입니다. 화살표 표시: True로 설정 시, 새로운 신호가 발생할 때마다 차트

지표는 여러 쌍의 스프레드를 동시에 모니터링하는 스프레드 스크리너를 제공하며 캔들 타이머 카운트다운은 현재 막대가 닫히고 새로운 막대가 형성되기까지 남은 시간을 표시합니다.
기간 한정 제공: 당사의 모든 프리미엄 지표는 단 50$에 제공됩니다. MQL5 블로그에 액세스하면 프리미엄 지표에 대한 모든 세부 정보를 찾을 수 있습니다. 여기를 클릭하세요.
주요 특징들 동시에 확산되는 다중 쌍을 모니터링합니다. 현지 시간이 아닌 서버 시간을 추적합니다. 구성 가능한 텍스트 색상 및 글꼴 크기 CPU 사용량을 줄이기 위해 최적화 개인화 된 쌍 목록.
연락하다 질문이 있거나 도움이 필요하면 비공개 메시지를 통해 저에게 연락하십시오.
경고 경고 모든 지표와 도구는 공식 Metatrader Store( MQL5 Market )를 통해서만 사용할 수 있습니다.
작가 SAYADI ACHREF, 핀테크 소프트웨어 엔지니어이자 Finansya의 설립자
FREE
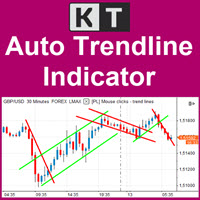
중요한 추세선을 차트에서 자동으로 업데이트 KT Auto Trendline은 최근 ZigZag 스윙 포인트를 바탕으로 상단과 하단 추세선을 자동으로 만들고 현재 차트의 미래 방향으로 두 선을 연장합니다. 같은 선을 반복해서 직접 그리지 않아도 형성 중인 돌파, 반응, 가격 방향 변화를 명확한 구조로 살펴볼 수 있습니다. 가까운 구조와 더 넓은 스윙을 함께 확인 첫 번째 추세선 세트는 기본으로 활성화되며 반응성이 높은 ZigZag 설정을 사용합니다. 더 넓은 시야가 필요하면 두 번째 세트를 켜서 별도의 민감도를 가진 상단 및 하단 추세선 한 쌍을 추가할 수 있습니다. 한 차트에서 가까운 가격 구조와 더 큰 시장 스윙을 비교하기 좋습니다. 각 추세선 세트의 반응 방식 조절 Show First Trendline: 기본 상단 및 하단 연장 추세선을 표시하거나 숨깁니다. Depth, Deviation, Back Step: 첫 번째 ZigZag 세트가 스윙 포인트를 찾는 방식을 조절합니다. S

KT Heiken Ashi Alert는 표준 Heiken Ashi 캔들에 기반하여 매수 및 매도 화살표를 표시하고 다양한 알림을 생성하는 유용한 트렌드 보조 도구입니다. Heiken Ashi를 거래 전략에 통합하고 싶은 트레이더에게 필수적인 도구입니다. Heiken Ashi가 하락 상태에서 상승 상태로 전환되면 매수 화살표가 표시됩니다. Heiken Ashi가 상승 상태에서 하락 상태로 전환되면 매도 화살표가 표시됩니다. 모바일 알림, 이메일, 사운드, 팝업 알림 모두 지원됩니다.
Heiken Ashi란? Heiken Ashi(平均足)는 일본어로 "평균 바"를 의미하며, 기존의 일본식 캔들보다 트렌드를 더 쉽게 파악할 수 있도록 설계된 차트 유형입니다. 이 캔들은 진입과 청산 전략 모두에 활용될 수 있으며, 색상이 바뀌면 종종 시장 방향의 전환을 의미합니다.
중요 포인트
Heiken Ashi Alerts를 단독으로 사용하는 것은 추천하지 않으며, 다른 보조 지표와 함께 사용하는

KT Pip Counter 는 실시간으로 핵심 데이터를 표시해 주는 간단하면서도 유용한 지표입니다. 수익·손실, 스프레드, 잔여 시간 같은 정보를 한눈에 파악할 수 있어, 급변하는 장세에서도 침착하게 대응하고 의사결정 속도를 높일 수 있습니다.
특징
현재 손익을 통화, 핍, 퍼센트로 동시에 표시. 실시간 스프레드를 표시. 현재 캔들이 마감될 때까지 남은 시간을 알려줌. 손익 상황에 따라 색상을 자동 변경. 텍스트 위치와 레이아웃을 자유롭게 설정 가능. CPU 사용량이 매우 낮아 플랫폼이 느려지지 않음.
입력값 Account P&L: true이면 계좌 전체 손익, false이면 현재 종목 손익만 표시. 색상 및 글꼴 크기 설정. Show After Current Bar: true이면 캔들 종료 후 정보 표시, 아니면 차트 구석에 고정. 나머지 입력값은 직관적으로 이해 가능.

KT Pivot Points는 최신 데이터를 기반으로 일간, 주간, 월간 피벗 레벨을 차트에 자동으로 표시합니다. 피벗 포인트는 외환 시장을 포함한 기술적 분석에서 널리 사용되는 지표입니다.
주요 기능
가격이 피벗 레벨에 도달하면 알림을 전송합니다. 각 피벗 레벨 종류별로 완전한 사용자 지정이 가능합니다. 일간, 주간, 월간 피벗 레벨을 깔끔하게 표시합니다. CPU 자원을 적게 사용하여 빠르게 계산됩니다. 차트상의 다른 지표들과 호환됩니다.
피벗 포인트란? 피벗 포인트는 전일의 고가, 저가, 종가의 평균을 이용하여 계산됩니다. 이 계산된 피벗 포인트를 기반으로 향후의 지지 및 저항 수준을 예측할 수 있으며, 이는 해당 수준 근처에서의 가격 움직임을 판단하는 데 도움이 됩니다. 일반적으로 가격이 피벗 포인트 위에서 거래되면 강세 심리를, 아래에서 거래되면 약세 심리를 나타냅니다.
피벗 계산식
피벗 레벨을 계산하기 위해 전일, 주간 또는 월간의 고가, 저가, 종가 데이터를
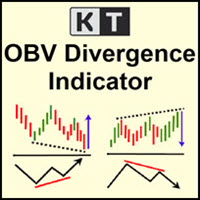
KT OBV Divergence는 가격과 OBV(온밸런스 볼륨) 오실레이터 사이에 형성되는 일반 및 숨겨진 다이버전스를 표시합니다.
기능
비대칭 다이버전스는 정확도를 높이고 시각적 혼란을 줄이기 위해 자동으로 제외됩니다. 추세 전환 및 추세 지속 전략 모두에 활용 가능합니다. Expert Advisor에 완벽히 통합 가능한 구조로 설계되었습니다. 진입 신호뿐만 아니라 청산 신호로도 활용할 수 있습니다. MetaTrader의 모든 알림 기능을 지원합니다.
다이버전스란 무엇인가요?
기술적 분석에서 일반적으로 가격이 더 높은 고점을 만들면 오실레이터도 더 높은 고점을 만들어야 하며, 가격이 더 낮은 저점을 만들면 오실레이터도 같이 낮아져야 합니다. 이와 같은 정상적인 관계가 무너질 때, 가격과 오실레이터 간에 다이버전스가 발생한 것으로 봅니다. 다이버전스는 크게 두 가지 유형이 있습니다: 일반적인 강세 다이버전스: 가격은 더 낮은 저점을 만들지만, 오실레이터는 더 높은 저점을 만듭
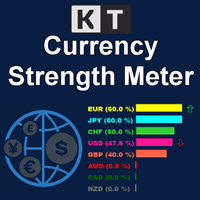
KT Currency Strength Meter는 주요 외환 통화쌍에 적용된 종합적인 수학 공식을 통해 각 통화의 강세와 약세를 측정하는 인디케이터입니다. 고정된 기간 동안의 양봉과 음봉을 기반으로 통화의 강도를 계산하며, 이 데이터를 기반으로 알고리즘이 가장 강한 통화와 가장 약한 통화를 실시간으로 정렬하고 지속적으로 업데이트합니다.
장점
강한 통화에 대해 약한 통화를 매수하려는 잘못된 신호를 걸러내어 거래 전략을 즉시 개선할 수 있습니다. 의도하지 않은 헤지나 과도한 거래를 방지할 수 있습니다. 강세 통화에 대해 약세 통화를 매수하는 등의 고위험 역추세 거래를 피할 수 있습니다. 서로 상쇄되는 포지션을 필터링할 수 있습니다. 가장 최근 데이터를 기반으로 실시간 업데이트가 이루어집니다. 가볍고 최적화된 코드로 CPU 리소스를 최소화하여 다른 전략이나 인디케이터의 작동에 영향을 주지 않습니다. 각 통화는 고유 색상으로 표시되어 시각적으로 빠르게 구분할 수 있습니다. 복잡한 설정 없
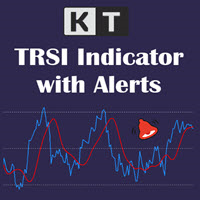
KT TRSI는 RSI(상대강도지수), EMA(지수이동평균), SMA(단순이동평균)를 조합하여 만든 오실레이터입니다. 기존의 RSI와 비교했을 때, SMA의 평활화 기능 덕분에 TRSI는 잘못된 신호에 덜 민감합니다. 또한, 모든 종류의 MetaTrader 알림 기능을 완벽히 지원합니다.
간단한 진입 규칙
매수: 파란 선(RSI)이 빨간 선(TRSI)을 상향 돌파할 때. 매도: 파란 선(RSI)이 빨간 선(TRSI)을 하향 돌파할 때.
고급 진입 규칙 매수: 파란 선(RSI)이 과매도 수준 아래로 내려갔다가 다시 위로 올라가며 빨간 선(TRSI)과의 상승 교차가 발생할 때. 매도: 파란 선(RSI)이 과매수 수준 위로 올라갔다가 다시 아래로 내려가며 빨간 선(TRSI)과의 하락 교차가 발생할 때.
TRSI를 사용할 때는 다른 보조 지표들과 함께 확인 신호를 병행하는 것이 중요합니다.
TRSI 공식
트리플 EMA = RSI의 EMA를 세 번 반복 적용한 값. TRSI = 트리플
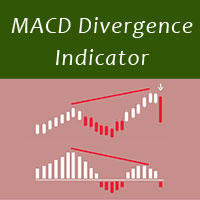
MACD divergence indicator finds divergences between price chart and MACD indicator and informs you with alerts (popup, mobile notification or email) . Its main use is to find trend reversals in the chart. Always use the divergence indicators with other technical assets like support resistance zones, candlestick patterns and price action to have a higher possibility to find trend reversals. Three confirmation type for MACD divergences: MACD line cross zero level Price returns to previous H/L Crea
FREE

Market Momentum Alerter Market Momentum Alerter will inform you about danger to operate in the market.
Imagine you see a very nice setup (Forex, Stocks, Indices) and you decide to place your trade...
And you finally lose your trade and don't understand what happened.
This can happen due to big operations in the market carried out by banks and big institutions.
These operations are invisible for most people.
Now with the Market Momentum Alerter you will be able to detect those operations...
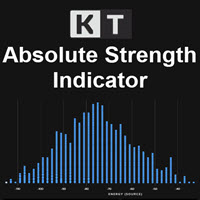
KT Absolute Strength measures and plots the absolute strength of the instrument's price action in a histogram form. It combines the moving average and histogram for a meaningful illustration. It supports two modes for the histogram calculation, i.e., it can be calculated using RSI and Stochastic both. However, for more dynamic analysis, RSI mode is always preferred.
Buy Entry
When the Absolute Strength histogram turns green and also it's higher than the previous red column.
Sell Entry
When th
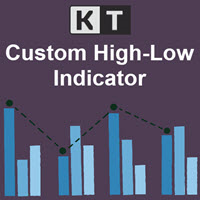
KT Custom High Low shows the most recent highs/lows by fetching the data points from multi-timeframes and then projecting them on a single chart. If two or more highs/lows are found at the same price, they are merged into a single level to declutter the charts.
Features
It is built with a sorting algorithm that declutters the charts by merging the duplicate values into a single value. Get Highs/Lows from multiple timeframes on a single chart without any fuss. Provide alerts when the current pri
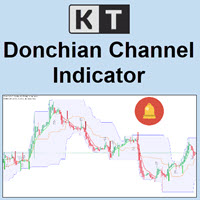
KT Donchian Channel is an advanced version of the famous Donchian channel first developed by Richard Donchian. It consists of three bands based on the moving average of last high and low prices. Upper Band: Highest price over last n period. Lower Band: Lowest price over last n period. Middle Band: The average of upper and lower band (Upper Band + Lower Band) / 2. Where n is 20 or a custom period value is chosen by the trader.
Features
A straightforward implementation of the Donchian channel ble
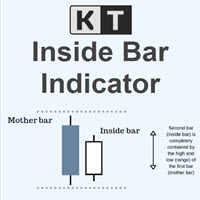
KT Inside Bar plots the famous inside bar pattern in which the bar carries a lower high and higher low compared to the previous bar. The last bar is also known as the mother bar. On smaller time-frames, the inside bar sometimes appears similar to a triangle pattern.
Features
Also plots entry, stop-loss, and take-profit levels with the inside bar pattern. No complex inputs and settings. Erase unwanted levels when the price reaches the entry line in either direction. All Metatrader alerts include
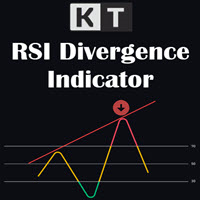
KT RSI Divergence shows the regular and hidden divergences built between the price and Relative Strength Index (RSI) oscillator. Divergence can depict the upcoming price reversal, but manually spotting the divergence between price and oscillator is not an easy task.
Features
Ability to choose the alerts only for the divergences that occur within an overbought/oversold level. Unsymmetrical divergences are discarded for better accuracy and lesser clutter. Support trading strategies for trend reve

Best indicator for MT5 providing accurate and sniper signals to enter a trade without repainting!
It can be applied to any financial assets: forex, synthetic, cryptocurrencies, metals, stocks, indices . It will provide pretty accurate trading signals and tell you when it's best to open a trade and close it. Most traders improve their trading results during the first trading week with the help of the Power Indicator Pro.
Benefits of the Power Indicator Pro
Entry signals without repaint

KT Average Daily Range(ADR) shows the upper and lower levels using the average daily range covered by the currency pair or the instrument. The average daily range is calculated using the chosen period in the input settings. ADR High: ADR upper level is found by adding the average daily range value to the current day's low.
ADR Low: ADR lower level is found by subtracting the ADR value from the current day's high.
Features
It shows the ADR levels with several other helpful information benefici

KT Fisher Transform is an advanced version of the original Fisher Transform oscillator equipped with divergence detection, crossover alerts, and many more features. Originally it was developed by John F. Ehlers. It converts the asset's price into a Gaussian normal distribution to find the local extremes in a price wave.
Features
A light-weighted oscillator that efficiently identifies the upward and downward crossovers and marks them using vertical lines. It also finds regular and hidden diverg

PriceRunner MT5 The PriceRunner indicator is based on pure relative power. It gives promising results even in M1 timeframes in currency pairs and M2 in commodities and cryptos. The indicator is designed with user-friendly and simple settings. It is very suitable even for beginners who are interested in indicators and strategies. I am ready to make improvements on the indicator in line with the needs of those who buy or rent. However, even in its current state, you can see very promising results
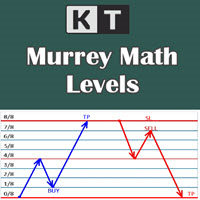
It shows the Murrey Math levels on chart and also provides an alert when price touch a particular level. T. Henning Murrey, in 1995, presented a trading system called Murrey Math Trading System, which is based on the observations made by W.D Gann.
Applications
For Murrey Math lovers, this is a must-have indicator in their arsenal. There is no need to be present on the screen all the time. Whenever the price touches a level, it will send an alert. Spot upcoming reversals in advance by speculatin
KT Candle Timer shows the remaining time in the closing of the current bar. You can use the bar closing time for multiple purposes, including time and trade management during the trading hours.
Features
It also shows the Symbol spreads along with the remaining time. It offers two convenient timer display positions, i.e., chart corner or next to the current bar. From colors to text size, it offers full customization according to user preferences. It is optimized to work without using extensive c
KT Bullish Bearish shows the bullish/bearish regime of the market in the form of a colored histogram representing both of the market states alternately. Bull Market (Blue Histogram): A bull market indicates an uptrend when an instrument price rises over a continued period like days, months, or years. Bear Market (Red Histogram): A bear market indicates a downtrend when an instrument price rises over a continued period like days, months, or years.
Applications
It prevents trading against the big
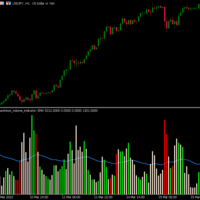
Hawkeye Volume Indicator contains a complex algorithm which executes over 300 calculations per bar in order to analyze the price action and associated volume, giving traders a tremendous advantage. Now Available in MT5 for U nlimited Use !
Volume is the only leading indicator which: .signals a price movement prior to it happening
.provides the fuel that drives the market Hawkeye Volume works in all markets and can be used in all timeframes for both tick and time charts – from longer term swing a
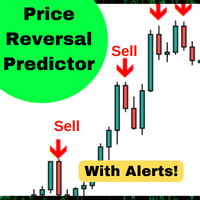
이 알고리즘은 90%*정확도로 가격의 단기 변화를 예측합니다. 가격이 신호 촛불보다 높거나 낮은 경우 예측한다. 더 큰 시간 프레임에 평균 복귀 거래,바이너리 옵션 또는 선물 계약에 적합합니다. 이 지표는 5 년간의 데이터에 대해 백 테스트되었으며 시간 경과에 따른 가격 반전을 예측하는 데 90%의 정확도가 있습니다.
특징::
간단한 설정 모든 차트로 드래그 앤 드롭 경고 사용(선택 사항) 그리고 당신은 완료! 시각 및 오디오 경고 휴대 전화로 직접 전송 경고 터미널로 전송 된 팝업 알림 높은 승률 거래의 90%까지 승리 백 테스트 5 년 여러 통화. (백 테스트 세부 정보 및 분석은 웹 사이트를 참조하십시오). 많은 수의 신호 활성 모드에서 심볼 당 하루에 3~6 개의 신호를 기대합니다 기대 1 에 2 수동 모드에서 기호 당 하루 신호. 당신이 표시가있는 경우*이입니다 30 분 촛불. 유연한 외환,지수,상품 및 주식에서 작동합니다. 어떤 시간 프레임에서 작동 매일 바 5 분에
FREE
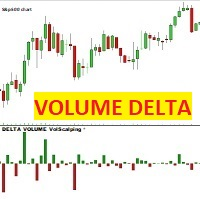
볼륨 델타 볼스캘핑 이 표시기는 각 가격 캔들에 대해 구매 및 판매 계약의 차이인 델타 캔들을 그립니다. 양초는 입찰(매도)에서 거래된 계약이 매도 가격을 초과하면 빨간색이고 음수가 되고 반대로 ASK(매수)에서 거래된 계약이 입찰가를 초과하면 양초가 녹색이고 양수입니다.
주의: 이 지표는 실제 시장 데이터 흐름을 제공하고 체결된 계약을 BID와 ASK로 나누는 브로커에서만 작동합니다. Forex, CFD 및 Cryptocurrencies는 합성 시장에 속하며 실제 시장 데이터 흐름이 없으므로 표시기가 작동하지 않습니다. 데모 계정으로도 보증금 없이 실제 시장 데이터 흐름을 제공하는 브로커가 AMP FUTURE 브로커입니다. 지수, 상품, 실제 시장에서 거래되는 상품에 대한 작업(예: CME, EUREX, ICE ...)

LT Easy Trend - 단 하나의 지표로 경험하는 기술적 중첩(Confluence)의 위력 한 지표는 매수를 가리키고 다른 지표는 매도를 가리켜 혼란스러웠던 적이 있으신가요? LT Easy Trend는 이러한 결정 장애를 해결하기 위해 개발되었습니다. 세계에서 가장 신뢰받는 9가지 기술적 지표들의 수학적 합의를 바탕으로 승률이 높은 신호만을 엄선하여 제공합니다. 수십 개의 창으로 차트를 어지럽히는 대신, Easy Trend는 모든 데이터를 실시간으로 처리하여 9가지 필터가 동시에 추세를 확정할 때만 명확한 시각적 신호를 표시합니다. 9가지 추세 필터의 강력함: 진입 신호는 다음 지표들 간의 의견이 100% 일치할 때만 생성됩니다: Moving Average (MA): 가격 방향성 필터. Relative Strength Index (RSI): 추세의 강도 및 모멘텀 식별. Commodity Channel Index (CCI): 새로운 추세 사이클 포착. Parabolic SAR:
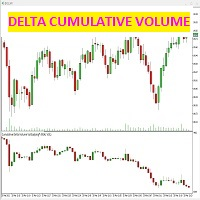
이 지표는 단일 캔들에 대해 매도 및 매도(공격) 체결된 계약 간의 차이를 감지합니다.
지표는 가격 차트 아래의 전용 창에 판매 및 구매 계약의 차이에 의해 정확하게 주어진 양초를 표시하며, 이는 시장의 체적 강도를 생성합니다.
누적 촛대 델타 차트만 선택하는 방법 또는 양초 자체의 추세선을 선택하는 방법이 가능합니다(스크린샷 참조): 두 번째 상자 u "없음"을 선택하면 추세선이 그려지지 않고 색상을 선택하면, 체적 양초의 추세선이 차트에 함께 나타납니다.
이 표시기는 무엇을 위한 것입니까? 가격 차트를 체적 델타 차트와 비교하면 시장의 진정한 강점을 볼 수 있습니다. 두 차트의 수렴은 가격의 올바른 상승/하강을 결정하는 반면 가격과 체적 델타 간의 발산은 신호 경고여야 합니다 가격이 반전되어야 하기 때문입니다. 이 지표는 잘못된 신호를 필터링하고 가격과 거래량 사이의 분기 단계에서 발생하는 신호를 제거하기 위해 거래 전략과 함께 사용해야 합니다.
주의: 이 표시기는 실제
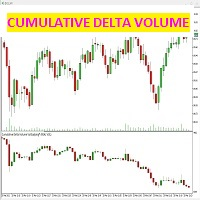
이 지표는 단일 캔들에 대해 매도 및 매도(공격) 체결된 계약 간의 차이를 감지합니다.
지표는 가격 차트 아래의 전용 창에 판매 및 구매 계약의 차이에 의해 정확하게 주어진 양초를 표시하며, 이는 시장의 체적 강도를 생성합니다.
누적 촛대 델타 차트만 선택하는 방법 또는 양초 자체의 추세선을 선택하는 방법이 가능합니다(스크린샷 참조): 두 번째 상자 u "없음"을 선택하면 추세선이 그려지지 않고 색상을 선택하면, 체적 양초의 추세선이 차트에 함께 나타납니다.
이 표시기는 무엇을 위한 것입니까? 가격 차트를 체적 델타 차트와 비교하면 시장의 진정한 강점을 볼 수 있습니다. 두 차트의 수렴은 가격의 올바른 상승/하강을 결정하는 반면 가격과 체적 델타 간의 발산은 신호 경고여야 합니다 가격이 반전되어야 하기 때문입니다. 이 지표는 잘못된 신호를 필터링하고 가격과 거래량 사이의 분기 단계에서 발생하는 신호를 제거하기 위해 거래 전략과 함께 사용해야 합니다.
주의: 이 표시기는 실제
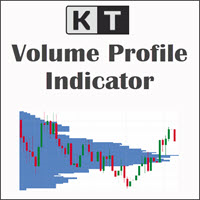
KT Volume Profile은 사용자가 선택한 차트 구간에서 거래 활동이 어느 가격대에 집중되었는지 보여 줍니다. 분석할 움직임 위에 사각형을 놓고 왼쪽 또는 오른쪽 경계를 드래그하면 됩니다. 프로파일이 즉시 다시 계산되고 선택한 가격 범위에 가로 히스토그램이 표시됩니다. 중요한 차트 구간을 직접 선택하세요 고정된 세션이나 조회 기간에 얽매이지 않습니다. 이동 가능한 박스로 추세의 한 구간, 횡보, 돌파 전 베이스, 뉴스 움직임 또는 비교하고 싶은 다른 구간을 따로 분석할 수 있습니다. 박스를 늘리거나 줄이면 프로파일도 업데이트되므로 움직임이 진행되는 동안 시장 참여가 어떻게 변했는지 쉽게 확인할 수 있습니다. 시간뿐 아니라 가격별 거래량을 읽으세요 긴 히스토그램 막대는 박스 안에서 거래량이 더 많이 누적된 가격대를 나타내고, 짧은 막대는 활동이 적었던 구간을 보여 줍니다. 시장이 어느 가격에서 더 많은 거래를 소화했고 어느 구간을 빠르게 통과했는지 실용적으로 파악할 수 있습니다

차트에서 추세 방향을 직접 확인 KT Trend Magic은 모멘텀과 변동성을 결합하여 가격을 따라가는 색상 라인을 표시합니다. 라인은 현재 추세 상태를 계속 보여 주며 계산된 방향이 바뀌면 색상도 변경됩니다. 녹색 라인: 강세 추세 상태를 나타냅니다. 빨간색 라인: 약세 추세 상태를 나타냅니다. 색상 변화: 차트에서 새로운 방향 전환을 표시합니다. 지속적인 움직임에서는 라인을 되돌림과 추세 지속을 살펴보는 동적 차트 기준으로도 활용할 수 있습니다. 각 전환을 현재 가격 움직임과 자신의 진입 규칙에 맞춰 비교할 수 있습니다. 9개 시간대의 신호 비교 다중 시간대 스캐너는 M1, M5, M15, M30, H1, H4, D1, W1, MN1의 Trend Magic 상태를 Bullish 또는 Bearish로 표시합니다. 각 시간대마다 별도의 차트를 열지 않고 현재 차트를 더 짧고 긴 시간대와 비교할 수 있습니다. 여러 시간대가 같은 방향을 가리키는지 또는 현재 차트가 더 넓은 추세 배경과

지금 어느 외환 세션에서 거래하고 있는지, 그리고 각 세션이 몇 pips 움직였는지 MetaTrader 5 차트에서 바로 확인하세요. KT Forex Sessions MT5는 도쿄, 런던, 뉴욕 세션을 색깔 박스로 그리고, 각 세션의 크기를 pips로 해당 박스 위에 적어 주는 세션 지표입니다. 지표가 브로커의 GMT 오프셋을 스스로 읽고, 각 세션은 해당 도시의 현지 시간과 서머타임을 따릅니다. 박스는 일 년 내내 올바른 위치에 있으며, 설정할 것이 없습니다. 차트에서 보이는 것 모든 박스 위의 pips: 거래하는 모든 통화쌍에서 조용한 세션과 활발한 세션을 한눈에 구별할 수 있습니다. 시간대 환산이 필요 없음: 찾아볼 GMT 오프셋도 없고, 봄과 가을에 시계가 바뀔 때 바꿀 것도 없습니다. 겹치는 시간은 별도의 박스로: 런던과 뉴욕이 동시에 열려 있는 시간에는 별도의 보라색 박스가 있습니다. 열려 있는 세션은 실시간으로 커짐: 세션이 끝날 때까지 박스가 새로운 고점과 저점을 따라
MetaTrader 마켓은 개발자들이 거래 애플리케이션을 판매할 수 있는 간단하고 편리한 사이트이다.
제품을 게시하고 마켓용 제품 설명을 어떻게 준비하는가를 설명하는 데 도움이 됩니다. 마켓의 모든 애플리케이션은 암호화로 보호되며 구매자의 컴퓨터에서만 실행할 수 있습니다. 불법 복제는 불가능합니다.
