 MetaTrader 5
 Experts
 지표
 라이브러리
 유틸리티
 위젯
 규칙
MetaTrader 5용 새 기술 지표 - 171
 기술 지표의 시그널은 주식 및 외환 시장에서 거래를 개시 및 종료하는 데 중요한 역할을 합니다. 지표의 본질은 미래의 가격 변화를 예측하기 위한 금융 시그널 값의 수학적 변형입니다.
기술 지표를 테스트하여 시장 행동과 그로 인한 이익을 더 잘 예측할 수 있습니다.
디디 지수 볼륨(Didi Index Volume)을 소개합니다. 이는 브라질 트레이더 오디르 아기아르(Odir Aguiar)이 개발한 기술적 분석 지표로, 금융 시장에서 기회를 식별하는 고급이고 강력한 접근 방식으로 주목받고 있습니다. 다양한 플랫폼에서 이용 가능한 디디 지수 볼륨은 정확한 통찰력과 가치 있는 정보를 찾는 트레이더들에게 필수적인 도구가 되었습니다.
이 지표는 오디르 아기아르가 개발한 유명한 디디 지수(Didi Index)와 거래량의 지능적인 활용을 결합합니다. 이 조합은 가격 동작과 거래량의 상호작용을 더 깊게 분석하여 자산의 움직임에 대한 독특한 시각을 제공합니다.
정교한 알고리즘과 가중 평균 계산을 통해 디디 지수 볼륨은 거래량을 기반으로 가격 변동을 예측할 수 있습니다. 이 기능은 신흥 트렌드, 시장 반전 및 적시적인 진입 및 청산 시점을 파악하는 데 매우 중요합니다.
디디 지수 볼륨을 사용하면 정확한 시장 해석을 돕고 허무맹랑한 결정을 피할 수 있는 객관
The main objective of this indicator is to determine entry and exit points, that is why ExactArrow draws nothing but arrows showing entry and exit points. In spite of apparent simplicity of the indicator, it has complicated analytic algorithms which determine entry and exit points. The indicator generates exact and timely entry and exit signals which appear on the current candle. The indicator generates an average of 1-2 candles before its analogues do. The indicator is very easy to use. Open Bu
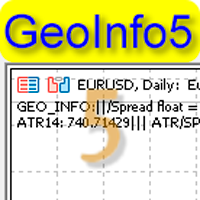
GeoInfo5 is one of the most informative indicators, it displays basic information about a trading instrument in a compact form. The version for the Meta Trader 4 terminal has gained wide popularity among traders. The indicator is free and will always be free. The launch version is now available for MetaTrader 5 as well.
displays information about the main parameters of the tool in a brief form in the line in the upper left corner of the chart: Spread, Swap for Buy order, Swap for Sell order, c
FREE
The Daily Highs and Lows Indicator is a versatile tool that combines support and resistance levels with real-time market dynamics. By incorporating previous daily highs and lows, it provides valuable insights into market psychology and identifies potential areas of price reversals or breakouts. With its ability to adapt to changing market conditions and customizable options, traders can stay ahead of trends and make informed decisions. This indicator is suitable for various trading styles and ti
FREE

The DVV indicator is a multifaceted informative indicator for the Forex market or the Cryptocurrency market . The indicator gives clear and reliable signals without redrawin g. The indicator can be used in bots by taking readings from its zero buffer.
Please note that for different currency pairs, the settings must be selected separately, this is not difficult.
Changing the input parameters greatly affects the display. I will show four options for using the indicator. The indicator has only o

Make Sure to Read the Description! UT Bot Plus contains free EA!
The EA can be downloaded from telegram channel: https://t.me/ +NSOJTvH39fNhZmU0
Unlock the Power of Automated Trading with UT BOT Indicator, Integrated with a FREE EA! ( Limited time offer ) This version has been expanded to include multiple additional filtering options. These options are fully configurable and can be switched on and off.
This versatile UT BOT indicator is crafted and optimized to work seamlessly with the FRE
This MT5 version indicator is a unique, high quality and affordable trading tool. The calculation is made according to the author's formula for the beginning of a possible trend. MT4 version is here https://www.mql5.com/ru/market/product/98041 An accurate MT5 indicator that gives signals to enter trades without redrawing!
Ideal trade entry points for currencies, cryptocurrencies, metals, stocks, indices! The indicator builds buy/sell arrows and generates an alert. Use the standart B

This indicator uses candlesticks with large real bodies to predict possible market structure shift. Displacement is a very powerful move in price action resulting in strong selling or buying pressure. Generally speaking, displacement will appear as a single or a group of candles that are all positioned in the same direction. These candles typically have large real bodies and very short wicks, suggesting very little disagreement between buyers and sellers. Often, a displacement will occur just af
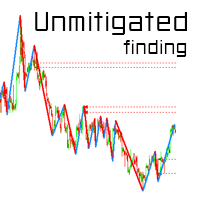
SMC Unmitigated Finding is a indicator for find unmitigated supply and demand in previous legs of price
Settings Zigzag Settings ZZDepth - by Default is 12.
ZZDeviation - by Default is 5.
ZZBackStep - by Default is 3. Horizontal Line Settings SupportColor- color for Support line.
ResistanceColor - color for Resistance line. Settings Num of Show - Number of Support & Resistance Show.

C300 SYNTHETIC INDICATOR 1MIN CHART Update V2 No repaint
*The indicator will not give a sell sign if the market conditions are not in place. *With all 3 strategy criteria in place the strategy based indicator signals 1-3 trades per day. *The drawdown can range to very high you need to place your own target profit and stop loss according to your risk management system . *The indicator is designed for only C300 and the 1min chart .
NB :Note this strategy based indicator will be free only for

Gioteen Volatility Index (GVI) - your ultimate solution to overcoming market unpredictability and maximizing trading opportunities. This revolutionary indicator helps you in lowering your losing trades due to choppy market movements. The GVI is designed to measure market volatility, providing you with valuable insights to identify the most favorable trading prospects. Its intuitive interface consists of a dynamic red line representing the volatility index, accompanied by blue line that indicate

Crash 500 indicator synthetic Update V2 No Repaint
This indicator works with a custom build in strategy
The indicator will only give a sell sign when market conditions are in place. Only for sell.
Medium to long trades use own proper risk management system. See screenshots for examples of arrow indicator.
Apply own risk management target profit and stop loss. When market conditions are met the sell sign will indicate you to enter a sell position and you will have to apply your risk manage
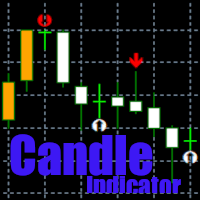
3 candel indicator in 1 !!! The 3 most important candel indicator in 1 packadge. Help trader in chart visualisation, prevent reversal !!! Doji : Gravestone Doji, Long Legged Doji, Dragonfly Doji. Engulfing : Bullish, Bearish. Hammer : red hammer, green hammer. Fully parametrable indicator icon color config and alarm. Free life time update !!! Just try our demo for free.

소개 Quantum Breakout PRO , 브레이크아웃 존 거래 방식을 변화시키는 획기적인 MQL5 지표! 13년 이상의 거래 경험을 가진 숙련된 트레이더 팀이 개발한 퀀텀 브레이크아웃 PRO 혁신적이고 역동적인 브레이크아웃 존 전략으로 거래 여정을 새로운 차원으로 끌어올리도록 설계되었습니다.
Quantum Breakout Indicator는 5개의 이익 목표 영역이 있는 브레이크아웃 영역의 신호 화살표와 브레이크아웃 상자를 기반으로 한 손절 제안을 제공합니다.
초보자 거래자와 전문 거래자 모두에게 적합합니다.
Quantum EA 채널: 여기를 클릭하세요
중요한! 구매 후 설치 매뉴얼을 받으려면 개인 메시지를 보내주십시오. 추천:
기간: M15 통화쌍: GBPJPY, EURJPY, USDJPY,NZDUSD, XAUUSD 계정 유형: 스프레드가 매우 낮은 ECN, Raw 또는 Razor 브로커 시간: GMT +3 중개인 :
통화 마술사 매트릭스 인디케이터란 무엇인가요? 통화 마술사 매트릭스 인디케이터는 통화의 강도를 보여주는 그래픽 도구입니다. 일반적인 인디케이터는 보통 다른 통화와의 상대적인 강도를 보여줍니다. 그러나 일부 계산을 통해 각 개별 통화의 절대 강도를 찾아낼 수 있습니다. 따라서 통화 마술사 매트릭스 인디케이터(또는 미터)는 통화의 절대적인 강도를 표현하기 위한 도구로, 이 강도를 다른 통화의 강도와 비교할 수 있습니다. 통화의 절대 강도를 계산하는 방법은 여러 가지가 있지만, 일반적으로 다른 인디케이터의 모든 값들을 고려하여 추출하려고 합니다. 다시 말해, 예를 들어 JPY의 강도를 계산하기 위해 알고리즘은 JPY를 포함하는 모든 통화쌍에서 동일한 인디케이터의 값들을 분석합니다. 이 개념은 통화 마술사 매트릭스에 처음 접하는 경우에는 약간 혼란스러울 수 있지만, 걱정하지 마세요. 계속 읽다보면 이해하게 될 것입니다. 통화 마술사 매트릭스는 8개 주요 통화의 강도를 측정하기 위해 개발된
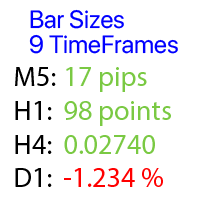
각 시간 프레임에서 가격 변동을 계산: 플로팅 또는 최근 마감 바.
다기능 유틸리티 : 66개 이상의 기능, 이 도구 포함 | 질문이 있으면 저에게 연락하세요 | MT4 버전 계산할 쉬프트 를 선택할 수 있습니다: 플로팅 (현재) 바; 최근 마감 (이전) 바; 가격 값의 유형 은 상단 행의 파란색 스위치로 선택할 수 있습니다: 핍; 시장 포인트; 백분율 값 (%); 가격 값; 바 크기 계산 방법 은 파란색 버튼으로 선택할 수 있습니다: 몸통 : (시가 - 종가) 가격; 그림자 : (고가 - 저가) 가격; 유틸리티는 차트에 별도 창 으로 표시됩니다: 창은 차트의 모든 위치로 이동 가능: 어디서나 드래그; 인터페이스는 " ^ " 버튼으로 최소화 가능; 지표 설정에서 다음을 구성할 수 있습니다: 다크 / 라이트 인터페이스 테마; 인터페이스 크기 배율; 폰트 크기 및 스타일; 프로그램 파일은 " Indicators " 디렉토리에 배치해야 합니다.
시장 스크리너: 가격, 스프레드 및 스왑, 선택한 심볼용 (Market Watch) 리스트를 사용자 지정할 수 있습니다: 필요한 심볼(통화 쌍)만 설정하세요. 심볼 수는 제한이 없습니다. 리스트는 심볼 이름 기준으로 오름차순 또는 내림차순으로 정렬할 수 있습니다. 패널은 차트의 원하는 위치로 이동할 수 있습니다. 패널을 최소화할 수도 있습니다. 평균값 과 비교하여 스프레드 크기 가 증가 했을 때 알림 을 보내는 옵션 이 있습니다. 내 #1 다기능 유틸리티 : 66+ 기능, 이 도구 포함 | 문의 사항이 있으면 저에게 연락 | MT4 버전 표시되는 값: 현재 시장 가격 (BID); 스프레드 크기; 롱 포지션의 스왑; 숏 포지션의 스왑; 계정 전체의 총 손익; 지표 설정에서 구성할 수 있음: 다크 / 라이트 인터페이스 테마; 인터페이스 크기 배율; 폰트 크기; 스프레드가 증가할 때 알림 옵션: 알림 트리거는 평균값의 백분율로 설정; 프로그램 파일은 " Indicators
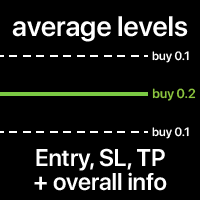
심볼에 대한 모든 거래의 평균 Entry, SL 및 TP 레벨. 레벨은 함께 계산하거나, 매수 및 매도 거래를 별도로 계산할 수 있습니다. 선택적으로 추가 정보를 표시할 수 있습니다: 레벨 가격, 총 로트 크기, 플로팅 P/L. 레벨의 스타일과 색상은 사용자 지정 가능합니다. 다기능 유틸리티 : 66개 이상의 기능 포함 | 질문이 있으면 저에게 연락하세요 | MT4 버전 인디케이터 설정에서 다음을 구성할 수 있습니다: 평균 Entry 레벨: 온/오프; 평균 SL 레벨: 온/오프; 평균 TP 레벨: 온/오프; 매수 및 매도를 별도로: ' false '를 선택하면 - 레벨은 매수 및 매도를 함께 계산됩니다. 미결 주문을 포함: 온/오프; 활성 포지션을 포함: 온/오프; 추가 정보 표시: 온/오프; 오른쪽 테두리에 정보 표시? 만약 ' false '라면: 추가 정보는 왼쪽 테두리에 표시됩니다; 라인 및 텍스트 색상: Entry, SL 및 TP용; 라인 스타일: Entry,
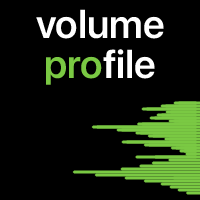
가격 수준별 거래량 시각화. 계산을 위한 임의의 기간을 설정할 수 있습니다: 두 개의 수직선 사이 또는 고정 시간 간격을 설정할 수 있습니다. 히스토그램 수준은 상대적입니다: 더 넓은 막대는 거래량이 더 많음을 의미합니다. 분포의 극단값은 지지선과 저항선 수준으로 사용될 수 있습니다.
모든 스타일, 크기 및 색상은 사용자 지정이 가능합니다. 다기능 유틸리티 : 66개 이상의 기능 포함 | 질문이 있으면 저에게 연락 | MT4 버전 인디케이터 설정에서 다음을 구성할 수 있습니다: 히스토그램 스타일:
시각적 모드: 막대 / 선 / 외곽선 / 방향 (각 수준에서 지배적인 가격 방향에 따라 색상이 달라지는 막대). 히스토그램 위치: 차트 경계 / 시간 범위 내 / 시간 범위 외 : 왼쪽 / 오른쪽. 2개의 히스토그램 색상. 히스토그램 너비. 히스토그램 크기 (% 차트 너비). 계산 설정: 범위 경계 유형: 차트 2선 사이 / 지정된 최근 분 / 오른쪽 경계 전 지

The Real Trend indicator simplifies the decision-making process by recognizing reversals with a built-in algorithm and then confirming signals at support/resistance levels. Implements a type of technical analysis based on the idea that the market is cyclical.
Thus, the indicator follows the market trend with great reliability, ignoring sharp market fluctuations and noise around the average price. The indicator can be used both for pipsing on short periods and for long-term trading.

Introducing the Kangaroo Hunter - Your Ultimate Edge in Forex Trading ATTENTION Forex Traders! Are you in constant pursuit of high-probability trade setups? Or maybe you're a novice trader struggling to pinpoint precise entry and exit points? Our solution, the Kangaroo Hunter, is about to revolutionize your trading journey. This meticulously designed indicator simplifies and refines the art of identifying the often elusive Kangaroo Tail patterns in the Forex market, pushing your trading strateg

The Game-Changing Engulfing Candle Hunter - Your Guide to Profitable Trend Trading
Step into the realm of trading possibilities with our revolutionary product - The Engulfing Hunter. Designed by traders for traders, this dynamic indicator combines the potency of engulfing candlestick patterns and the versatility of proprietary trend detection system, offering a trading edge unlike any other. Engulfing candlestick patterns have always been a revered tool in the arsenal of seasoned traders. Actin

Man Trend uses at its core the process of identifying the rate of change in price growth and allows you to find entry and exit points from the market.
The indicator was created on the basis of the original indicators for searching for extreme points, the indicator is well suited for determining a reversal or a large sharp jerk to one of the sides, thanks to it you will know when this happens, it will notify you with the appearance of a blue dot to buy red to sell.
This is a fundamental techni

Introducing the "Cybercycle Trend" Forex Oscillator, a powerful technical indicator designed to enhance your trading experience in the foreign exchange market. This innovative tool utilizes advanced algorithms to identify and analyze market trends, providing you with valuable insights and helping you make informed trading decisions.
The Cybercycle Trend Forex Oscillator is specifically designed to detect and measure cyclical price movements in the forex market. By incorporating this oscillator
FREE
MT5インジケータ TC-Alerts 開発経緯:
実はFXで簡単に勝てる手法があるんです。 それは。。。 主要な(4時間足以上、4時間足、日足、週足)のレジスタンスとサポートラインの反発を狙う FXは一方向には進まず90%以上で 必ず、必ずと言っていいほど、 どこかで反発します 。そこは大抵主要なレジスタンスとサポートラインまたは主要なフィボナッチラインなのです。
なのでそこに水平線を引いて ただ待つ のです。そこに到達したら、1分足や5分足に落として
長いヒゲ、ダブルボトム、ダブルヘッド、トリプルボトム、トリプルヘッド、三尊、逆三尊などの反転の形成を確認してエントリーする。 または、こちらを使用して
https://www.mql5.com/ja/market/product/53987
強弱が弱くなってきたのを確認してエントリーすればいいのです。
これだけです。シンプルです!!
うまく行くと、長期足レベルでレジスタンスとサポートライン間、つまり頭から尻尾まで取れる可能性もありますし、リスクリワードが異常にいいです。
そのためには、チャートに主要なレジスタンスとサポートラインに

Introducing the Power Trade Plus indicator designed by a small group of traders with a few years of experience trading the market profitably. The Power Trade Plus is derived from the Power Trade indicator, the indicator strive in powerful sniper entries and take profit levels, with an algorithm that's can determine the markets volatility and Provides entries based on the current market volatility. This indicator is much more effective in stock ,currencies and indices.
Индикатор "Benefit Predictor"
Это высокоточный инструмент для прогнозирования разворота цены на любом финансовом инструменте и любом таймфрейме. Этот продукт появился благодаря годам опыта и исследований в области анализа цен и других временных рядов, используя продвинутые методы машинного обучения и математического анализа.
Особенности продукта : Готовая торговая система, подходит как для ручной торговли, так и для использования в торговых роботах. Не перерисовывается после появления сигнала
**Features:**
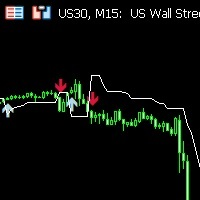
1. **Innovative Trend Tracking:** The UT BOT Simple Indicator leverages the power of the Average True Range (ATR), a renowned volatility measure, to calculate precise trailing stop values, providing unparalleled insights into market trends.
2. **Customizable Settings:** Flexibility is paramount in any trading strategy. With this in mind, our indicator allows you to adjust the ATR periods and other key parameters to tailor the tool to your trading style and strategy.
3. **Real-t
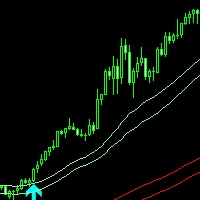
Entry Pro Indicator is a powerful multi-functional trading tool designed to increase your market entry accuracy. It combines the power of several key market trend indicators, including ATR Trailing Stop and both fast and slow EMA, to provide comprehensive market insight. It offers easy-to-interpret market entry signals represented by colored arrows. Also, it's fully customizable, allowing you to adjust ATR and EMA periods to suit your trading strategy. Trend filters and alerts can be toggled on

Meet the Tweezer Hunter, an essential tool for every Forex trader looking to make accurate, trend-following trades. This powerful, intuitive indicator helps traders spot potential trend reversals before they happen, providing a significant advantage in the fast-paced world of Forex trading. The Tweezer Hunter is more than your average tweezer candle indicator; it's designed with a built-in trend identification feature that accurately detects whether the market is bearish or bullish. By integrat
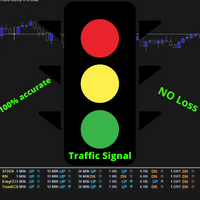
혁신적인 MT5 지표 '트래픽 신호'를 소개합니다 - 성공적인 트레이딩 세계로의 문을 열어드립니다! 정확성과 전문지식을 바탕으로 설계된 이 혁신적인 지표는 RSI, 스토캐스틱, CCI 및 모든 시간프레임의 트렌드 분석에 기반한 특별한 전략으로 가장 정확한 진입 신호를 생성합니다. 트래픽 신호는 무적의 자신감으로 시장을 탐색할 수 있도록 최상의 정확성을 제공합니다. 트래픽 신호를 통해 가장 수익성 높은 트레이딩 기회를 감지하기 위해 정밀하게 조정된 주요 기술적 지표의 철저한 분석에 접근할 수 있습니다. 불확실성에 작별을 고하고 정보 기반의 의사 결정의 새로운 시대를 맞이하세요. RSI, 스토캐스틱, CCI 및 트렌드의 잠재력을 트래픽 신호 내에서 완벽하게 융합하여 전례없는 시장의 역학을 생생하게 그려냅니다. 트래픽 신호를 통해 시장의 트렌드와 패턴을 쉽게 탐색하면서 모든 시간프레임을 주시할 수 있습니다. 단기적인 고조 또는 장기적인 전략적 플레이를 선호하든지, 이 뛰어난 지표는 여러분
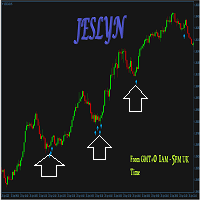
이것은 스캘퍼 시스템 또는 매우 강력한 모멘텀, 바이너리 옵션 거래자 또는 자동화 거래에 서 범용 EA가 사용하는 전략으로 Forex 수동 거래자 모두에게 적합한 다목적 시스템입니다. 이것은 스캘퍼 시스템 또는 매우 강력한 모멘텀, 바이너리 옵션 거래자 또는 자동화 거래에 서 범용 EA가 사용하는 전략으로 Forex 수동 거래자 모두에게 적합한 다목적 시스템입니다. 이것은 스캘퍼 시스템 또는 매우 강력한 모멘텀, 바이너리 옵션 거래자 또는 자동화 거래에 서 범용 EA가 사용하는 전략으로 Forex 수동 거래자 모두에게 적합한 다목적 시스템입니다. 이것은 스캘퍼 시스템 또는 매우 강력한 모멘텀, 바이너리 옵션 거래자 또는 자동화 거래에 서 범용 EA가 사용하는 전략으로 Forex 수동 거래자 모두에게 적합한 다목적 시스템입니다. 이것은 스캘퍼 시스템 또는 매우 강력한 모멘텀, 바이너리 옵션 거래자 또는 자동화 거래에 서 범용 EA가 사용하는 전략으로 Forex 수동 거래자 모두에게 적
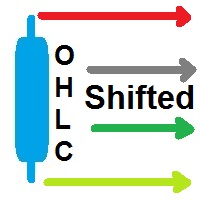
전일 종가 및 바 이동을 위한 MetaTrader 인디케이터! 전일 종가 및 바 이동 인디케이터는 기술적 분석과 거래 결정을 향상시키기 위해 개발된 도구입니다. 이 인디케이터를 사용하면 어떤 바의 개방가, 고가, 저가, 종가에 대한 상세한 정보를 얻어 시장 움직임에 대한 정확하고 포괄적인 분석이 가능합니다. 현재 타임프레임 내에서 다른 타임프레임을 적용할 수 있는 기능을 상상해보세요. 전일 종가 및 바 이동 인디케이터를 사용하면 이 놀라운 기능을 손쉽게 사용할 수 있습니다! 전일 종가가 서포트와 저항으로서의 중요성은 거래자 커뮤니티에서 널리 인정되고 있습니다. 이제 이 도구를 사용하여 이전 종가에서 가격이 멈춘 수준을 명확하고 정확하게 파악하여 매수 및 매도 결정에 유용한 정보를 얻을 수 있습니다. 인디케이터를 차트에 적용하면 시각적으로 매력적으로 강조된 전일 개방가, 고가, 저가, 종가의 중요한 정보에 즉시 액세스할 수 있습니다. 또한 바 이동을 조정하여 MetaTrader의 어떤
FREE
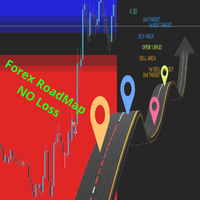
ROADMAP: 완벽한 거래 실행을 위한 귀하의 궁극적인 MT5 Forex 인디케이터! Forex 시장에서 지속적인 불확실성과 추측 작업에 지쳤나요? 정확한 진입 지점, 매수 및 매도 구간을 식별하거나 정확한 손실 제한과 이익 실현 수준을 설정하는 것이 어려운가요? 더 이상 찾지 마세요! ROADMAP은 혁신적인 MT5 Forex 인디케이터로 귀하의 거래 전략을 혁신할 수 있도록 지원합니다. ROADMAP은 특별한 전략으로 설계되어 Forex 시장을 돌파하는 데 필수적인 통찰력과 정확한 계산을 제공합니다. 이 탁월한 인디케이터는 Fibonacci(FIBO) 레벨을 포함한 고급 기술의 조합을 활용하여 최적의 거래 결정을 돕습니다. ROADMAP을 통해 뛰어난 정확성으로 시장 역학을 종합적으로 파악할 수 있으며, 이상적인 진입 영역을 정확하게 식별할 수 있습니다. 이는 수익성이 높은 기회를 놓치지 않고 조기에 거래에 참여할 수 있음을 의미합니다. 이 인디케이터의 창의적인 알고리즘은 시장

Easy ICT Price Action은 수동 차트 분석에서 유동성, BOS, Order Blocks, breaker zones, 거래 세션, Silver Bullet 타이밍 및 Opening Range Gap을 사용하는 트레이더를 위한 ICT 가격 행동 지표입니다. Easy ICT Price Action 은 수동 차트 분석에서 ICT 및 가격 행동 개념을 사용하는 트레이더를 위해 설계된 트레이딩 지표입니다. 이 지표는 유동성 레벨, BOS, 스윙 포인트, Order Blocks, breaker zones, 거래 세션, Silver Bullet 타이밍, Opening Range Gap 및 주요 기준 레벨과 같은 중요한 차트 컨텍스트를 표시하는 데 도움을 줍니다. 목표는 차트를 더 쉽게 읽을 수 있도록 하여, 트레이더가 모든 레벨을 수동으로 표시하지 않고도 구조, 타이밍, 가격 위치에 집중할 수 있게 하는 것입니다. 주요 기능 유동성 기준 레벨 BOS 및 시장 구조 라벨 Swing h
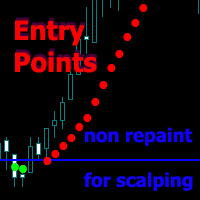
Scalping Entry Points - is a manual trading system that can adjust to price movements and give signals to open trades without redrawing. The indicator determines the direction of the trend by the central level of support and resistance. The dot indicator provides signals for entries and exits. Suitable for manual intraday trading, scalping and binary options. Works on all time frames and trading instruments.
The indicator gives several types of alerts.
How to use the product
The blue line det

The Trend Advisor indicator simplifies the decision-making process by recognizing reversals with a built-in algorithm and then confirming signals at support/resistance levels. Implements a type of technical analysis based on the idea that the market is cyclical.
Thus, the indicator follows the market trend with great reliability, ignoring sharp market fluctuations and noise around the average price. The indicator can be used both for pipsing on short periods and for long-term trading.
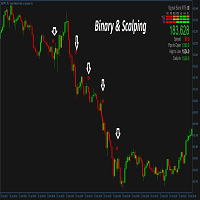
This is a trend following system for Binary options traders and forex scalpers. It is carefully crafted and recognizes periods of very strong trends in the market and gives the trader the advantage and opportunity of riding with the momentum. It works on all timeframes and currency pairs especially high liquidity pairs. Avoid news events 15mins before and after. Always have your money management script or system in place. Tested on Deriv synthetics as well, please check screenshots. The mt4 vers
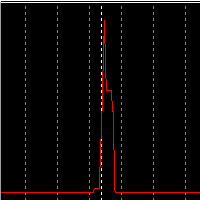
Hello! My name is Saullo and I am an MQL5/4 programmer specializing in custom services for Metatrader.
This is a very simple indicator that shows on the chart the history of the spread of each candle of the chart's asset.
Follow me on instagram: @saullo_algotrader
If you need custom development services for metatrader contact me on instagram. Thank you very much!
FREE

I suggest trying to trade with everyone who is interested in the Lino Treand indicator.
Lino Treand is a technical analysis tool that uses mathematical calculations to determine various aspects of price movements based on historical data. The indicator works using the cyclic-wave dependence function. Thus, all entry points will be optimal points where the movement changes. Lino Treand shows specific aspects of price movement and allows traders to make the right decision. All trading indicators

Are you ready to take your trading journey to new heights? Look no further than MarketMagnet, this groundbreaking indicator designed to propel your trading success with excitement and accuracy. Powered by the convergence of Momentum and CCI (Commodity Channel Index), MarketMagnet equips traders with the ultimate tool to determine direction and entry prices for a wide range of recommended currency pairs and instruments. It is designed for traders seeking to scalp for a few pips on lower timeframe

To test the adviser, do you open a separate account for each of them? this is very inconvenient, but thanks to this indicator, this is no longer a problem!
Do not be too lazy to read the full description and do not close the page ahead of time, this indicator is needed by almost every trader, no matter if he trades with his hands or uses advisors.
Buying this indicator as a gift you will receive an adviser with not bad results.. if you have already received a gift from me from other purch

Easy to use buy and sell signals with arrows. Non Repainting indicator. Non Lagging indicator. Down Arrows indicate sell and up arrows indicate buys. Works on any market and on any time frames. Arrow colors can be changed to match chart colors. Audible alerts. Periods can be changed to phase out false signals. Please remember to follow the trend like with any indicator.
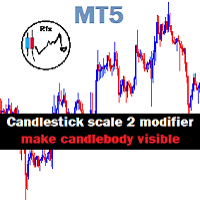
Chart Candlestick scale 2 zoom will visible instead of just a tiny unrecognized line make it look neat and tidy Instruction.
If you don't like the candles colors, you can do so by changing color. read below:
-Colors must be changed in the indicator setting.
-It won't change through the Chart properties to modify.
-After changing the color, save it as template so it wont change the colors to default value.
FREE
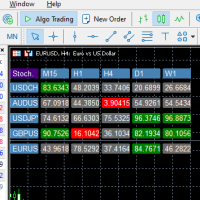
Showing like in the picture or in the logo multiple pair, multiple timeframes, multiple indicators in the same time , allowing you to click and go straight on that pair. The indicator will change like a Carosello every 3 seconds and will show you the indicator values also by background color to check in a very fast way if its oversold or overbought . Feel free to ask for adding new pair or indicator , i will update it for free. Pair managed: EURUSD, GBPUSD, USDJPY, AUDUSD, USDCHF. Indicator man

Smart Currency Strength is a powerful yet simple indicator that measures the strength of individual currencies.
It features a graphic panel that lists the main currencies and their strength in each timeframe, ranging from 0 (most oversold) to 100 (most overbought). The strength for all currencies in the current timeframe is also shown in a separate window as a multi-line graph, where each currency is represented with a different color, this allows you to monitor the evolution of strength trend
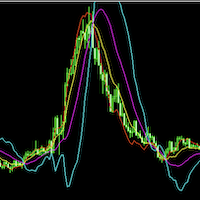
SourcePoint是一个很好的中长线交易指示器,他能独立使用,也可以去其他趋势型指标独立使用,可以很好的指出最佳的buy和sell位置,指标不含有未来函数,不会重新绘制,不仅能够应用到自己的手动交易过程中,还能完全可以写入到自己的EA中。建议配合BS TrendLine( https://www.mql5.com/zh/market/product/96476?source=Site+Market+My+Products+Page ) 一起使用。 (如果你感觉到这个指标能够帮助你进行更准确的交易,请帮忙给个好评,希望我的作品能够帮助更多有需要的人) ===================参数列表===================== fastP: 12 slowP:26 avgP:9 =================参考使用方法=================== 此指标可以适用于任何交易品种,能够用在任何周期。 每次形成一个交点,就是一个交易机会,同时也是一个持仓平仓点位。建议配合大小周期一起使用,这样更容易让你找到更精准的入场位置和出场位置

Moving Average Crossover Indicator. Add this Easy Indicator to your charts. The indicator indicates when to buy and when to sell. When the line is orange that is a sell signal. When the line is green that is a buy signal. Easy to use and colors can be changed so suit your charts. Easy to use. Follow the indicator and enter your buy and sell signals. Work on any market and on any timeframe.
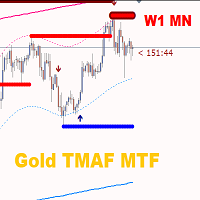
금 TMAF MTF - 최고의 주식 기술 지표입니다. 지표 알고리즘은 자산의 가격 움직임을 분석하고 변동성과 잠재적 진입 구간을 반영합니다.
최고의 지표 신호입니다: 매도 = TMA1의 빨간색 상한선 위의 TMA2의 빨간색 상한선 + 위의 빨간색 프랙탈 인디케이터 + 같은 방향의 노란색 SR 신호 화살표. 매수 = TMA2의 파란색 하한선 아래 TMA1의 파란색 하한선 + 아래에서 파란색 프랙탈 표시기 + 같은 방향의 아쿠아 SR 신호 화살표. 지표(빨간색 및/또는 파란색 W1 MN)는 편안하고 수익성 있는 거래를 위한 추가적이고 필수적인 도구입니다. SR 화살표 버퍼에는 편안하고 수익성 있는 거래를 위해 지표 설정(UseFiltrSR = true;)에 별도의 화살표 필터가 있습니다.
인디케이터의 장점
1. 이 인디케이터는 높은 정확도로 신호를 생성합니다. 2. 확인 된 화살표 신호는 다시 그려지지 않으며 프랙탈 신호는 절반 기간 동안 다시 그릴 수 있습니다. 3. 모든 브

사용자 설명서: 하모닉 패턴 OSW MT5 1. 소개 및 목적 하모닉 패턴 OSW는 피보나치 레벨을 기반으로 기하학적 가격 구조를 자동으로 감지하도록 설계된 고급 알고리즘 분석 도구입니다. 이 지표는 지그재그 알고리즘과 연동된 검색 엔진을 사용하여 시장의 노이즈를 걸러내고 가격 반전 가능성이 높은 영역을 찾아냅니다. 가틀리, 박쥐, 나비, 게, 상어와 같은 패턴을 식별하여 트레이더가 전문적인 정확도로 시장 반전을 예측할 수 있도록 하는 것이 목표입니다.
2. 매개변수 안내 (입력 메뉴) 패턴 선택 (하모닉 표시) 정의되지 않음 표시: 고전적인 범주에 속하지는 않지만 수동 분석을 위해 관련 피보나치 기하학적 구조를 유지하는 기술적 구조를 표시합니다.
가틀리/박쥐/나비/게/상어 표시: 전략에 따라 각 특정 패턴 검색을 활성화 또는 비활성화하는 개별 토글입니다.
알림 시스템 (알림) 캔들 신호: 알림 시점을 정의합니다. Candle_0은 레벨 도달 시 실시간으로 알림을 제공하고,

계정 대시보드 통계
계정의 이익과 손실을 파악하기 위해 집중적으로 볼 수 있도록 도와주는 도구이므로 이를 추적할 수 있으며 손실 분석을 통해 얻은 위험도 알 수 있습니다. 계정에서 다운로드하고 활성화한 후 EURUSD H1과 같은 기호에 연결해야 합니다. 그러면 이 순간부터 도구가 통계 모니터링을 시작합니다.
패널이 완전히 고급이므로 숨기고 원하는 위치로 이동할 수 있습니다. 주요 특징은 계정 운영에 따라 다음과 같습니다. 일일 기간(매일 갱신되는 일일 손익) 주간 기간(매주 갱신되는 주간 손익) 월간 기간(매월 갱신되는 월간 손익) 연간 기간(매년 갱신되는 연간 손익) 최대 드로다운(잔고에 따라 도달한 최대 위험을 모니터링하는 매초 제어) 예를 들어 잔액이 1000 USD이고 드로우다운 표시가 10%인 경우 어느 시점에서 계정의 총 위험이 100 USD에 도달했음을 의미합니다.
FREE

Make Your Own Index MT5은 MetaTrader 5을 위해 특별히 설계된 다목적 거래 지표로, 트레이더가 여러 기호로부터 맞춤형 지수를 생성할 수 있도록 합니다. 이 도구는 시장 분석 및 거래 전략을 향상시키려는 forex, 암호화폐 및 주식 트레이더에게 이상적입니다. 최대 15개의 기호를 하나의 라인으로 혼합할 수 있는 기능을 통해 트레이더는 섹터 성과를 추적하고, 다양한 포트폴리오를 구축하거나 전략별 바구니를 만들 수 있습니다. 이동 평균과 사용자 정의 가능한 가중치를 활용하여 이 지표는 편향을 줄이고 신호 정확성을 향상시키는 데 도움을 주며, 의사 결정 과정에서 정밀성을 중시하는 트레이더들 사이에서 인기가 높습니다. MQL 제품 설치 가이드 | MT4/MT5에서 구매한 MQL 제품 업데이트 | 일반 문제 해결 가이드 | 지표 설정 / 가이드 주요 기능 맞춤형 지수 생성: 최대 15개의 기호를 사용하여 거래 전략에 맞춘 집합 성과를 반영하는 개인화된 지수를 구축합

AI Channel | MT5용 인공지능 기반 가격 채널 지표 AI Channel: 진보된 기술 분석을 위한 인공지능 기반 도구 AI Channel 은 금융 시장에서 가격 채널을 분석하기 위해 인공지능 을 활용하는 강력한 도구입니다. 이 섹션에서는 이 혁신적인 지표가 투자자와 트레이더가 더 정보에 기반한 전략적 결정을 내리는 데 어떻게 도움을 주는지 살펴봅니다. AI Channel이란? AI Channel 은 고급 인공지능 알고리즘을 기반으로 개발된 지표입니다. 과거 가격 데이터를 사용하여 거래 채널을 식별하고 차트에서 중요한 지지선과 저항선을 강조 표시합니다. 이 분석을 바탕으로 시장 진입 및 청산의 유용한 인사이트를 제공합니다. ️ AI Channel 작동 원리 AI Channel은 인공지능을 가격 채널에 적용하여 자산의 추세, 패턴 및 과거 움직임을 분석합니다. 이 지표는 시장 변화에 따라 동적으로 적응하며 다양한 시간대와 금융 상품에 적용 가능합

Super Trend Plus is a trading system that uses four Supertrends set with different parameters. The idea behind this system is that when three Supertrends move in the same direction, there is a strong trend confirmation, but entry occurs only when the fourth Supertrend also moves in the same direction as the other three. For example, the first Supertrend could be used with a volatility multiplier of 3 and a period of 10, the second Supertrend with a volatility multiplier of 3 and a period of 12,
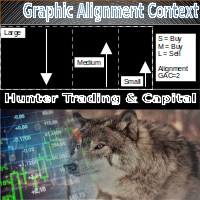
The Graphic Alignment Context (GAC) Technical Indicator measures the vertical difference of the simple average price of a financial instrument in the context of three different timeframes determined by a defined number of bars or candles (periods) to determine the strength of the buy or sell trend. sale. Ascending average prices indicate Buying strength (1), Descending average prices indicate Selling strength (-1) and any scenario different from the previous two conditions indicates Neutrality
FREE

The Available Range Bands Technical Indicator draws two lines on the chart indicating the maximum limits (bands) expected for buying and selling for the current period (candle). These limits can be accessed by buffers 0 and 1 respectively.
In addition, it displays in the lower right corner the current average values of the real volatility, the last price, the predicted range of movement available for buying (% and points) and the predicted range of movement available for selling (% and points)
FREE
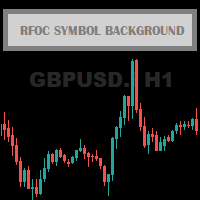
The RFOC Symbol Background was created to display the name of the asset and the current timeframe in the background of the chart.
Displaying the name of the asset at the bottom of the chart is often used by traders who are designing the screen for spectators, making it easier to identify the asset and the timeframe during a class, for example.
It is available for the user to select the font size (small, medium or large) and select the color for better viewing according to the background color
FREE
The FCPI indicator or Forex Currency Power Index indicator is a multi currency pairs indicator that displays 28 pairs on 1 chart, which consists of 8 Major Pairs and 20 Cross pairs. 8 Major Pairs dan 20 Cross pairs: EURUSD,GBPUSD,AUDUSD,NZDUSD,USDCAD,USDCHF,USDJPY,EURGBP,EURAUD,EURNZD,EURCAD,EURCHF,EURJPY,GBPAUD, GBPNZD,GBPCAD,GBPCHF,GBPJPY,AUDNZD,AUDCAD,AUDCHF,AUDJPY,NZDCAD,NZDCHF,NZDJPY,CADCHF,CADJPY,CHFJPY. Automatically detects symbols that have a symbol prefix and/or a symbol suffix.
The
[ MT4 Version ] Backtesting Simulator MT5 - Manual Market Replay and Trading Practice Manual backtesting on a finished MT5 chart is compromised by hindsight. You already know where price went, even when you pretend you do not. Backtesting Simulator is a manual market replay tool for MT5. Start from a historical point, hide the future, control the replay and place simulated trades as price unfolds. You find out how you actually decide when the next candle is still unknown. REPLAY THE MARKET INSI
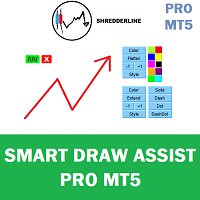
Smart Drawing Assist PRO MT5. Buttons will appears next to the selected object. The buttons are straightforward and amazingly easy to use. Features are as follow: Draw zigzag . Enabling you to draw patterns, draw zigzag, and draw shapes. All you have to do is click the button and start clicking point to point and it will draw automatically. Change object color . Rectangle/Trendline/HLine/Vline/Text/Price Arrow/Arrowed Line/ and your suggestion please. Flatten trendline . make a perfect flat line
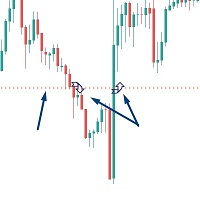
Introductory Offer! *** Only $47 - normal price $97 !! *** Ends soon - don't miis it!! The Close Above or Below Price Indicator is part of my suite of Price and Trendline Alerts Indicators. I'm excited to introduce the Close Above or Below Price Indicator – part of my new suite of Price and Trendline Alert Indicators – fantastic tools designed to alert you when candles close above or below significant prices in the markets you trade. With this indicator, you can set up to 4 price alerts on a
this indicator work with new MACD sittings from chatGPT coding and , You will get an alert through it in any change in the strength of sellers or buyers.
The indicator was tested on gold and gave great results, especially on the five-minute time frame.
It is recommended to use it two hours before the opening of the London markets and until the closing time of the London markets, because the liquidity will be high and you can reap good profits at this time for sure while avoiding staying in the d
This indicator works on atr with some edited . The AI MACD FILTER indicator is used for confirmation.
Certainly, the indicator contains an alert when the signal appears, and you use the exit of the deal on the saturation that occurs at the AI MACD. The accuracy of the work is high on gold, the time frame is five minutes, while staying away from trading at the time of news that occurs on the US dollar.
And using high liquidity trading times, which are two hours before the opening of the Lond
The Scalper v2 will give you accurate guidance to trade with. It has indications with arrows and it sends notifications. This software was built based on the RSI,MACD,Martingale, Ema 50 and 200, Aligator, SMA 30,50, ADX, Volumes percent range, variable dynamics and fibonacci levels. all of these indicators have something in common, it allows analysis, support and resistance, accurate signals for buy and sell, overbought and oversold market analysis. I have combined all of these indicators into o
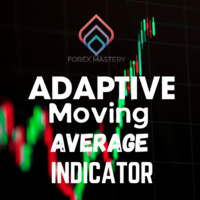
The Adaptive EMA consists of 3 lines: Yellow, Blue and Red If a yellow line appears, it means the market is entering Consolidation, Range, Contraction and no opportunities are available. If a Blue line appears, It means prices are accumulating, and now being marked up, so you are now entering a buy market with a strong Bullish trend. If a Red line appears, it means prices are now being marked down, price distribution is underway, so you are now entering a Sell market with a strong Bearish trend.
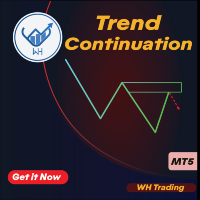
수익성 있는 시장 동향을 놓치는 데 지쳤습니까? 정확하고 정확하게 추세 지속을 식별할 수 있는 신뢰할 수 있는 도구를 원하십니까?
더 이상 보지 마세요! 당사의 Trend Continuation Indicator는 귀하의 거래 전략을 강화하고 게임에서 앞서 나갈 수 있도록 도와드립니다.
추세 지속 지표는 트레이더가 다양한 금융 시장에서 추세 지속 패턴을 식별하고 확인하는 데 도움을 주기 위해 특별히 제작된 강력한 도구입니다.
주식, 통화, 원자재 또는 지수를 거래할 때 이 지표는 거래 결정을 향상시키는 최고의 동반자입니다. MT4 버전 : WH Trend Continuation MT4
특징:
정확한 추세 확인. 사용자 정의 가능한 매개변수. 사용하기 쉬운 인터페이스. 실시간 알림. 포괄적인 지원. MT5용 Trend Continuation Indicator를 사용하여 거래 전략을 새로운 차원으로 끌어올리십시오. 추세 분석의 힘을 받아들이고 정보에 입각
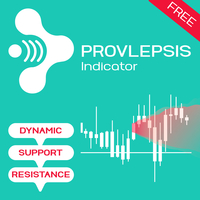
Provlepsis 지표에 오신 것을 환영합니다.
"Provlepsis"는 MQL 마켓을 위해 개발된 고급 지표입니다. 같은 시간대의 이전 바를 분석하여 시장 움직임의 잠재적 범위를 정확하게 계산하여 향후 가격 변동에 대한 소중한 통찰력을 제공합니다. 전통적인 ATR 지표와 달리 "Provlepsis"는 시간 요소를 고려하여 다양한 시장 조건에 적응하는 더 강력한 도구입니다. 밤에는 좁은 범위를 예측하고 활발한 거래 시간대에는 더 넓은 범위를 예측합니다. "Provlepsis"가 제공하는 포괄적인 범위 분석으로 거래 전략에서 경쟁 우위를 확보하세요. 여기에서 Provlepsis 지표의 길이와 시프트를 변경할 수 있는 전체 버전을 확인할 수 있습니다!
https://www.mql5.com/ko/market/product/98802
프로블렙시스 사용의 이유
범위 기반 트레이딩: 이 지표는 시장 움직임의 잠재적 범위를 식별하는 능력으로 범위 기반 트레이딩 전략에 가치를 제공할 수 있
FREE

Trend in Channel is not an ordinary forex channel. This corridor is built on the basis of the analysis of several candles, starting from the last one, as a result of which the extremums of the studied interval are determined. It is they who create the channel lines. It, like all channels, has a middle line as well as a high and low line. This channel is worth attention because of its unusual behavior. The use of the Trend in Channel indicator allows the trader to respond in time to the price go

The Riko Trend indicator is a revolutionary trend trading and filtering solution with all the important features of a trend tool built into one tool! The Riko Trend indicator is good for any trader, suitable for any trader for both forex and binary options. You don’t need to configure anything, everything is perfected by time and experience, it works great during a flat and in a trend.
The Riko Trend indicator is a technical analysis tool for financial markets that reflects the current price f

"Dragon's Tail" is an integrated trading system, not just an indicator. This system analyzes each candle on a minute-by-minute basis, which is particularly effective in high market volatility conditions. The "Dragon's Tail" system identifies key market moments referred to as "bull and bear battles". Based on these "battles", the system gives trade direction recommendations. In the case of an arrow appearing on the chart, this signals the possibility of opening two trades in the indicated directi
트레이딩 전략과 기술 지표를 판매하기에 가장 좋은 장소가 왜 MetaTrader 마켓인지 알고 계십니까? 광고나 소프트웨어 보호가 필요 없고, 지불 문제도 없습니다. 모든 것이 MetaTrader 마켓에서 제공됩니다.
