 MetaTrader 5
 Experts
 지표
지표
 라이브러리
라이브러리
 유틸리티
유틸리티
 위젯
위젯
 규칙
규칙
MetaTrader 4용 유료 기술 지표 - 82
 아래 나열된 기술 지표의 시그널은 MetaTrader 4 플랫폼의 거래를 열고 종료하는 데 중요한 역할을 합니다.
지표의 본질은 가격 변화를 예측하기 위한 금융 시그널 값의 수학적 변형입니다.
아래 나열된 기술 지표의 시그널은 MetaTrader 4 플랫폼의 거래를 열고 종료하는 데 중요한 역할을 합니다.
지표의 본질은 가격 변화를 예측하기 위한 금융 시그널 값의 수학적 변형입니다. 
KT Forex Blau Balance combines elements of momentum and volatility. It helps you identify entry and exit points.
Blau Balance consists of two moving averages (a slow-moving average and a fast-moving average) intersecting key transition points in market price. The indicator turns green or red when one is above or below the other, signaling to buy or sell trade signals.
It can be used in currency pairs and other markets that your MT4 or MT5 platform supports. Both short-term and long-term trade

Levels indicator. It works on a neural network and is formalized according to professional rules for building horizontal levels. The indicator redraws the levels every day and notifies you when the price approaches or cross the levels. The indicator is suitable for both professionals and beginners who have only recently begun to learn how to trade in the market. PrimeTools is a series of products designed for correct and professional trading. [PrimeTools Levels | PrimeTools Range ]
Panel Shows
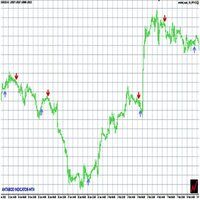
Antabod indicator is a trading system worth being sold for $999, but now $120. For a short period of time the price is now reduce to $60, but may soon go back up to $120 . This forex indicator analyzes the price behavior on the chart every second and determines the ideal entry points, based on the built-in algorithm, informing you when you need to open a deal and close it, to take profit.
It catches very fast and profitable price movements and gives you easy BUY/SELL signals, by Up and Dow

The KT De Munyuk is a trend-based indicator that uses Parabolic SAR to identify the market direction. The indicator shows the PSAR in the form of green/red dots using a separate window. Buy Signal: When a green dot appears after a series of at least three red dots. Buy Exit: When a red dot appears on the current or next higher time frame. Sell Signal: When a red dot appears after a series of at least three green dots. Sell Exit: When a green dot appears on the current or next higher

MetaTrader에서 여러 개의 수평선을 그린 후 각 수평선의 가격을 추적하는 것은 번거로운 작업이 될 수 있습니다. 이 인디케이터는 가격 알림 설정, 지지/저항선 표시 및 기타 수동 목적을 위해 동일한 간격으로 여러 수평선을 자동으로 그려줍니다. 이 인디케이터는 빠른 매수 및 매도를 통해 수익을 얻고자 하는 초보 외환 트레이더에게 적합합니다. 수평선은 시장이 추세를 따르거나 횡보 중일 때 거래 진입 가능성이 있는 구간을 찾는 데 유용합니다.
기능 입력 설정에 따라 여러 수평선을 즉시 자동으로 표시합니다. 여러 수평선을 쉽게 구분할 수 있도록 생동감 있는 색상 테마 제공. 여러 거래 세션의 가격 범위를 추적하는 데 유용한 필수 도구입니다. 가격이 수평선에 도달하면 알림을 전송합니다. 지나친 반복 알림을 방지하기 위해 알림 간격 설정 가능. 완전한 사용자 맞춤 설정 지원.
설명 이 인디케이터는 입력 설정에서 지정된 값과 지시에 따라 수평선을 표시합니다. 가격이 수평선에서

시장이 방향을 바꿀 때 가격 움직임만으로는 그 변화를 바로 알아보기 어려울 수 있습니다. KT XMaster Formula는 추세와 모멘텀 계산을 깔끔한 점선, 방향 전환을 표시하는 노란색 화살표, 멀티 타임프레임 대시보드로 보여 줍니다. 현재 방향과 마지막 전환 지점을 확인하고, 그 신호가 차트의 가격 구조와 어울리는지 비교할 수 있습니다. 계산에는 이동평균 평활화와 RSI 및 MACD 기반 정보가 함께 사용됩니다. 여러 지표를 겹쳐 놓는 대신, 스캘핑이나 눌림목 진입, 추세 추종 방식에 곁들일 수 있는 하나의 시각적 기준을 제공합니다. 하나의 선으로 보는 세 가지 신호 녹색 점선: 지표가 상승 방향으로 판단하고 있습니다. 빨간색 점선: 지표가 하락 방향으로 판단하고 있습니다. 노란색 화살표: 판단이 한 방향에서 반대 방향으로 전환되었습니다. 대시보드는 M1부터 MN1까지 상승 또는 하락 방향을 표시합니다. 새 차트 신호가 더 빠른 시간대와 더 느린 시간대에 함께 정렬되어 있는지,

KT Forex Trend Rider uses a trend following algorithm developed specifically for the Forex market to provide reliable buy & sell signals across the major currency pairs. It works best on major FX pairs and all time-frames.
Features
It comes with a Multi-Timeframe scanner that can search for upcoming signals across all the time-frames. It comes with four preset profiles to facilitate trading for scalpers, tick-trend, swing, and trend traders. It marks the potential reversal points in the market.
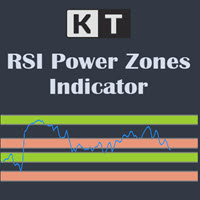
KT RSI Power Zones는 RSI의 움직임을 네 개의 파워 존으로 나누어, RSI를 활용한 잠재적인 지지 및 저항 구간을 식별하는 데 도움을 줍니다.
강세 지지 구간 강세 지지 구간은 40에서 50 사이입니다. 이 구간에서 가격이 상승 반전할 것으로 예상됩니다.
강세 저항 구간 강세 저항 구간은 80에서 90 사이입니다. 이 구간에서 가격이 하락 반전할 것으로 예상됩니다.
약세 지지 구간 약세 지지 구간은 20에서 30 사이입니다. 이 구간에서 가격이 상승 반전할 것으로 예상됩니다.
약세 저항 구간 약세 저항 구간은 55에서 65 사이입니다. 이 구간에서 가격이 하락 반전할 것으로 예상됩니다.
RSI 파워 존 활용 방법
상대강도지수(RSI)는 과매수/과매도 구간, 양의/음의 다이버전스, 실패 스윙 등을 식별할 수 있는 다목적 오실레이터입니다. 일반적으로 RSI가 과매수 상태일 경우 가격 반전이 임박했음을 의미하지만, 때로는 강한 추세를 나타내기도 하며, 그 반대
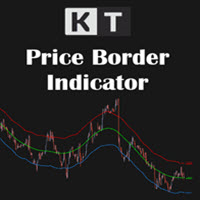
세 개의 적응형 밴드로 가격 위치 확인 KT Price Border는 차트에 세 개의 부드러운 밴드를 표시하여 변화하는 시장 엔벨로프 안에서 가격이 어디에 있는지 보여 줍니다. 기본 색상으로 각 기준선을 쉽게 구분할 수 있으며 선택 가능한 가격 태그에는 각 밴드의 현재 값이 표시됩니다. 상단 밴드: 현재 가격 엔벨로프의 위쪽 경계를 표시합니다. 중앙 밴드: 추세와 방향을 판단하는 중심 기준을 제공합니다. 하단 밴드: 현재 가격 엔벨로프의 아래쪽 경계를 표시합니다. 추세 방향과 스윙 상황 결합 가격이 상승하는 중앙 밴드 위를 유지하면 차트는 강세 방향을 보여 줍니다. 가격이 하락하는 중앙 밴드 아래에 머물면 약세 상황입니다. 외부 밴드를 향한 움직임을 통해 큰 방향 안에서 확장된 가격 위치, 되돌림, 잠재적인 스윙 영역을 모니터링할 수 있습니다. 외부 밴드를 동적인 차트 기준으로 활용하고 각 접촉이나 교차를 현재 가격 움직임 및 선호하는 확인 방식과 비교할 수 있습니다. 새로운 밴드
Gold Scalping Indicator - an indicator for intraday trading on XAUUSD gold. The indicator determines price reversal points and draws signals on the chart. The indicator also sends signals to the phone. When the indicator draws a red dot, it means that the price may turn down now. When the indicator draws a blue arrow, it means that the price may turn up now. Given this information, every trader will be able to build an effective trading system on gold. Gold is a very liquid instrument that is w

The BSI stands for Bar Strength Index. It evaluates price data using a unique calculation. It displays readings in a separate window. Many financial investors mistake this indicator for the Relative Strength Index (RSI), which is incorrect because the BSI can provide an advantage through its calculation method that the RSI indicator does not. The Bar Strength Index (BSI) is derived from the Internal Bar Strength (IBS), which has been successfully applied to many financial assets such as commodit

The KT Tether Line is a trend-following tool consisting of three indicators that work together to generate trading signals. It can correctly identify market trends while signaling trade entries. It was first introduced by Bryan Strain in the Stock & Commodities magazine in 2000 in "How to get with the trend and out at the end."
The Concept
When a market trend is confirmed, the most challenging part is determining the timing of the entries. This indicator alerts you to potential trend reversals

Wicks UpDown Target
Choppy movement up and down on the opening range every day. Trading breakouts on London session and New York session is recommended. Wicks UpDown Target is specialized in all forex pairs.
Guideline Entry Strategy Idea:
Step 1 - Breakout Forming (Warning! Trade on London Session and New York Session) Step 2 - Breakout Starting (Take Action on your trading plan) Step 3 - Partial Close your order & set breakeven (no-risk) Step 4 - Target complete Step 5 - Don't trade in Sto
A very good indicator for Experienced and Professional Traders. A practical approach to trading. Easy to understand. A helping tool for traders looking for price movements .
Signals: Signal Number 1: When yellow line which is a signal line crossing the zero line towards downward direction is a selling opportunity. Signal Number 2:
When yellow line which is a signal line crossing the zero line towards upward direction is a buying opportunity.
8대 주요 통화의 현재 강도 내 #1 다기능 유틸리티: 66개 이상의 기능 포함, 이 지표 포함 | 질문이 있으면 저에게 연락하세요 | MT5 버전 이 지표는 별도의 창에 표시되며 차트의 아무 곳으로 이동할 수 있습니다. 입력 설정에서 조정할 수 있습니다: 인터페이스 테마 : 다크 / 화이트; 접두사와 접미사, 브로커의 통화 쌍에 있는 경우:
(예: 심볼이 "EURUSD .pro "라면, " .pro "를 접미사로 설정하세요); 패널 크기 폰트 크기 내 #1 다기능 유틸리티: 66개 이상의 기능 포함, 이 지표 포함 | 질문이 있으면 저에게 연락하세요 | MT5 버전 내 #1 다기능 유틸리티: 66개 이상의 기능 포함, 이 지표 포함 | 질문이 있으면 저에게 연락하세요 | MT5 버전
//---------------
공급/수요 구역: 과거에 가격이 여러 번 접근한 관찰 가능한 영역. 다기능 유틸리티: 66+ 기능, 이 인디케이터 포함 | 문의 사항이 있으면 저에게 연락 | MT5 버전 이 인디케이터는 가격이 다시 반전될 가능성이 있는 곳을 보여줍니다. 일반적으로 가격이 해당 수준에서 거부된 횟수가 많을수록 그 수준은 더 중요합니다. 입력 설정에서 조정할 수 있습니다: 약한 구역 을 활성화 또는 비활성화합니다; 구역 설명 을 표시하거나 숨깁니다; 폰트 크기; 기본 색상 을 설정: 지원과 저항에 대해 별도로:
선택한 색상은 약한 구역에서 덜 강렬하여 차트를 시각적으로 분석하는 데 도움이 됩니다; 수요와 공급 지대 는 가격 차트에서 이전에 상당한 매수(수요) 또는 매도(공급)가 발생한 주요 영역입니다. 이러한 지대는 트레이더가 가격 움직임의 잠재적 반전 또는 지속 을 예측하는 데 도움이 됩니다. 수요와 공급 트레이딩은 추세선, 이동 평균 또는 오더 플로우 분석과 같은 다른 도구와 결

The Th3Eng Ninja indicator is based on an analysis of the right trend direction with perfect custom algorithms. It show the true direction and the best point of the trend. With Stop Loss point and Three Take Profit points. Also it provides a secondary entry points in dots arrows style. And Finally it draws a very helpful lines from entry level to TP1, TP2, TP3, SL levels or the reverse signal, and all current/old signals status.
How to use the indicator
No complicated steps , Just follow 2 si
지난 4주간 각 날짜의 절대 변동성 내 #1 다기능 유틸리티: 66개 이상의 기능 포함, 이 인디케이터 포함 | 질문이 있으면 저에게 연락하세요 | MT5 버전 인디케이터는 별도의 창에 표시되며, 차트의 원하는 위치로 이동 가능합니다. 입력 설정에서 다음 사항을 조정할 수 있습니다: 인터페이스 테마 : 다크 / 화이트; 계산 방법: 가격, 핍, 포인트, % 변화;
패널 크기 폰트 크기 내 #1 다기능 유틸리티: 66개 이상의 기능 포함, 이 인디케이터 포함 | 질문이 있으면 저에게 연락하세요 | MT5 버전 내 #1 다기능 유틸리티: 66개 이상의 기능 포함, 이 인디케이터 포함 | 질문이 있으면 저에게 연락하세요 | MT5 버전 내 #1 다기능 유틸리티: 66개 이상의 기능 포함, 이 인디케이터 포함 | 질문이 있으면 저에게 연락하세요 | MT5 버전
That is my master piece invented new Forex indicator Copyright 2010 to 2100 (316009) for Sami A. Saydam. This indicator is showing the real Support and Resistance levels in dynamical ways as movable red lines with time, also works on all time charts' intervals. The price movements are strongly respecting those red lines and either confirmed break them or just touching them and can't break them up or down then move toward the right directions. This new techniques are the real alerting system ca

XFlow shows an expanding price channel that helps determine the trend and the moments of its reversal. It is also used when accompanying transactions to set take profit/stop loss and averages. It has practically no parameters and is very easy to use - just specify an important moment in the history for you and the indicator will calculate the price channel.
DISPLAYED LINES ROTATE - a thick solid line. The center of the general price rotation. The price makes wide cyclical movements around the

TPM Cross (trend power moving cross) - is a trend following strategy based on custom signal points. Indicator consists from main custom moving chart line and trend power line. Indicator defines up and down movements by it's trend power and custom moving direction. When current market's trend looses it's power and opposite trend starts - power trend line crosses moving and indicator plots an arrow. Main indicator's adjustable inputs : movingPeriod - period of moving line trendPeriod - period

Impulse fractals indicator - is counter-trend oriented complex market fractal pattern. Market creates bull/bear impulse, trend starts, fractals on impulsed wave are an agressive pullback signals. Buy arrow is plotted when market is bearish and it's impulse showed up-side fractal, and sell arrow is plotted when market is bullish and it's impulse showed dn-side fractal. Main indicator's adjustable inputs : impulsePeriod - main period of impulse histogram filterPeriod - smoothes impulse accordi
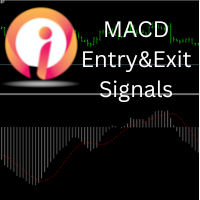
This indicator will show Entry and Exits using MACD and Moving average crossover. User can change settings to find best results from back testing. Profits and losses on candle close price is calculated and shown on screen of chart. Here any MACD settings and any Moving average crossover exit settings on various charts and various timeframes can be used. Watch video for few tests performed. Best wishes for trading.
Are you looking for a reliable support-resistant indicator to help you trade? Look no further! Our support resistance indicator is designed to make your trading experience easier and more efficient. With our indicator, you can find high-probability support and resistant zones and stay on top of the market, so you can take high-probability trades. Try it now and see the difference! support and resistance is the key element in trading just by identifying support and resistance correctly and using

The purpose of the Combo OnOff indicator is combine differerent tecniques and approachs to the market in order to spot signals that occur simultaneosly. A signal is more accurate if it is validate from more indicators as the adaptive expectations can be used to predict prices.The On-Off feature and alarms help to look for the better prices to enter/exit in the markets
Moving Averages are statistics that captures the average change in a data series over time
Bollinger Bands is formed by upper

Floating peaks oscillator - it the manual trading system. It's based on Stochastik/RSI type of oscillator with dynamic/floating overbought and oversold levels. When main line is green - market is under bullish pressure, when main line is red - market is under bearish pressure. Buy arrow appears at the floating bottom and sell arrow appears at floating top. Indicator allows to reverse signal types. Main indicator's adjustable inputs : mainTrendPeriod; signalTrendPeriod; smoothedTrendPeriod; tre
蜡烛剩余时间和价格根据行情的涨跌,变换不同颜色.当行情发生变化,就会发生颜色变更,在涨时为一种颜色,在跌时变为另外一种颜色。可以根据颜色的变化知道这一跳是涨还是跌。如果一直为同一颜色,说明现在正在加速进行涨或者跌。 蜡烛剩余时间和价格根据行情的涨跌,变换不同颜色.当行情发生变化,就会发生颜色变更,在涨时为一种颜色,在跌时变为另外一种颜色。可以根据颜色的变化知道这一跳是涨还是跌。如果一直为同一颜色,说明现在正在加速进行涨或者跌。 蜡烛剩余时间和价格根据行情的涨跌,变换不同颜色.当行情发生变化,就会发生颜色变更,在涨时为一种颜色,在跌时变为另外一种颜色。可以根据颜色的变化知道这一跳是涨还是跌。如果一直为同一颜色,说明现在正在加速进行涨或者跌。

Easy Technical Indicator is a powerful tool to detect the market trend and its strength . in addition, The signal Line reduce volatility and convert main trends to reliable Buy or Sell Signals --- Contact me in messages for free gift after purchase! --- HISTOGRAM:
It shows the main trend of the market. A histogram above zero means that the market is bullish A histogram below zero means that the market is bearish The height of the histogram bars indicates the strength of the trend weak,

Trend speed vector - is the oscillator for manual trading. System measures trend direction and it's speed. Histogram shows 4 colors: Lime --> Strong up movement with good gain speed; Green --> Up movement with low gain speed Red --> Strong down movement with good gain speed; Orange --> Down movement with low gain speed Green and Orange histograms show weak market's movements and thуese places excluded from signal points. Buy arrow is plotted during strong down movement when bearish gain speed i

Floating gain meter is the manual trading system that works with local trends and it's scalping. Histogram represents bull/bear floating trend gain. Green color histogram shows choppy market with bullish pressure, Orange - shows choppy market with bearish pressure. Lime and Red colors shows "boiled" places in market. As a rule buy arrow is placed after strong Down movement when it's power becomes weak and choppy market starts. And sell arrow is plotted after strong Up movement when it's power
This indicator shows the current direction of the market, the moments of reversal and the levels the market can reach. The development is based on years of experience and on the most advanced concepts of fractal analysis, so it adapts to every market and every time frame. The most impressive property is the ability to draw the levels that the market can reach with dozens of bars in advance.
MACD EXPLANATION Moving average convergence divergence (MACD, or MAC-D) is a trend-following momentum indicator that shows the relationship between two exponential moving averages (EMA's) of a price. The MACD is calculated by subtracting the 26-period exponential moving average (EMA) from the 12-period EMA. macd is one of the best momentum indicators macd is used by a lot of professional traders when it comes to continuous trade macd is the best choice if used properly even a ne

Pullback points indicator - is the manual trading system, that shows most popular market prices. Indicator measures bull/bear waves pressure and looks for "consensus" prices. As a rule these points are crossed up and down very often and opened trade has several chances to be closed in positive zone. Mainly, such points is the good base for "common profit" types of strategies. Indicator also represents "common profit" scalping method of trading as default one. Main Indicator's Features Signa

Noize Absorption Index - is the manual trading system that measures the difference of pressure between bears forces and bulls forces. Green line - is a noize free index that showing curent situation. Zero value of index shows totally choppy/flat market.Values above zero level shows how powerfull bullish wave is and values below zero measures bearish forces.Up arrow appears on bearish market when it's ready to reverse, dn arrow appears on weak bullish market, as a result of reverse expectation. S

Scanner and Dashboard for Money Flow Index for MT4 The Money Flow Index (MFI) is a technical oscillator that uses price and volume data for identifying overbought or oversold signals in an asset. It can also be used to spot divergences which warn of a trend change in price. The oscillator moves between 0 and 100. Advantages of the Scanner: - Full Alert Options. - Multi Timefrare - Works for all instruments including Currencies, Indices, Commodities, Cryptocurrencies and Stocks. - Fully customis

ONLY FOR FX MAJOR PAIRS Neural Oscillator is a later evolution of Neuro Scalper found here https://www.mql5.com/en/market/product/72342 It is a cluster signal, a better oscillator than a more traditional one like MACD. Neural Oscillator adds a divergence with momentum type signal compared to Neuro Scalper. Attach to charts. Entry arrows are at 100 for buy and -100 for sell. Example set up in the comments. Simple rules. Trade this as a stand alone system. How to trade: Trade during Act

The Bollinger Band is a strategy that has become one of the most useful tools for spotlighting extreme short-term price moves. Bollinger Bands consist of a centerline and two price channels or bands above and below it. The centerline is typically a simple moving average while the price channels are the standard deviations of the stock being studied. The bands expand and contract as the price action of an issue becomes volatile (expansion) or becomes bound into a tight trading pattern (c
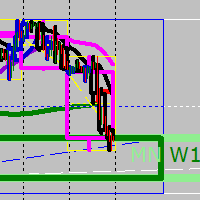
Szia! Egy indikátorral. Több idő gyertyájának kirajzoltatása egy charton. Különböző színek rendelhetők a long és short gyertyákhoz. Vonal vastagsága állítható. A gyertya kitöltése engedélyezhető. Hello! With an indicator. Drawing multiple time candles on a chart. Different colors can be ordered for long and short candles. Line thickness can be adjusted. Filling the candle can be allowed. Videó: https://www.youtube.com/watch?v=-9bequnAw-g& ;ab_channel=GyulaKlein
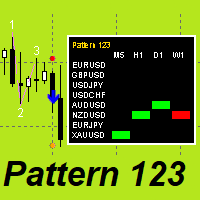
"Pattern 123" is an indicator-a trading system built on a popular pattern, pattern 123.
This is the moment when we expect a reversal on the older trend and enter the continuation of the small trend, its 3rd impulse.
The indicator displays signals and markings on an open chart. You can enable/disable graphical constructions in the settings.
The indicator has a built-in notification system (email, mobile terminal, standard terminal alert).
"Pattern 123" has a table that displays signals from sele
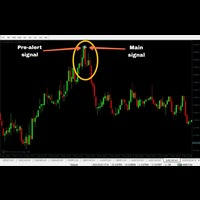
PLEASE NOTE: You can customize the settings of all 3 EMA as per your requirement. The accuracy will change as per your settings.
100% Non repaint Pre-alert (get ready) signals Non-delay indications 24/7 signals 100% No lag No recalculating Lifetime license This is a EMA crossover indicator and its 100% non repaint indicator. The EMA_1 and the EMA_2 is based on which signal is generated. EMA_3 is a Higher EMA value which will remain below or above the candle (market) to identify the trend. Me

MACros is based on Exponential Moving Average Crossover:
It can be used for: All Pairs: Forex, Cryptocurrencies, Metals, Stocks, Indices. All Timeframe All Brokers All type of Trading Style like Scalping, Swing, Intraday, Short-Term, Long-Term etc. Multiple Chart
***MT5 Version -->> https://www.mql5.com/en/market/product/87474
Notification Setting: All type of notifications and Pop-Up available with this Indicator. (Can manually ON/OFF the notification as per requirements.)
Special Note: I

What Is The Buy OR Sell MT4 Indicator? As the name suggests, the Buy-Sell Indicator is an indicator that tells traders about when to take the buy and sell position on the Forex price chart. This tool is a preference of many traders because it can provide solid indications of the trend and its reversals. In addition, it helps them simplify the hassle of choosing one or more indicators because this one tool alone is enough to provide them with a straight answer. When you apply this indicator

MMD의 다이아몬드
Diamond by MMD는 가격 행동에 중요한 장소를 식별하는 고급 지표입니다. 이 표시기는 모든 시간대에서 차트의 가격 반응 영역을 감지하고 표시합니다. MMD 방법론에서 지식 피라미드의 요소 중 하나인 다이아몬드는 매우 엄격한 조건을 충족하는 양초입니다. 다이아몬드에는 두 가지 주요 유형이 있습니다. - 표준 다이아몬드 - 역 치매. 이 두 모델은 자동으로 식별되어 차트에 표시됩니다. 지표는 예를 들어 H1 간격의 M5 간격에서 다이아몬드를 표시할 수 있습니다. 지표의 기본 설정은 현재 차트가 열려 있는 기간에 다이아몬드를 표시합니다.
표시기 매개변수에 대한 설명입니다. 표준 다이아몬드 사용 - 모델 00100에서 다이아몬드를 표시하거나 숨깁니다. 반전된 다이아몬드 사용 - 모델 0010100에서 다이아몬드를 표시하거나 숨깁니다. 다이아몬드 시간 프레임 - 다이아몬드가 표시되는 간격을 지정할 수 있는 옵션입니다. 예를 들어 M1 또는 H1 캔들로 차트에
Time Line by MMD is a simple indicator that supports historical data analysis and trading on statistical models that follow the MMD methodology.
Start Time - specifying the time when we start analyzing and playing the MMD statistical model Time Duration in minutes - duration of the model and its highest effectiveness (after the end of the line, the price returns - statistically - to the set level) Lookback days - the number of days back, subjected to historical analysis Base Time Frame - the b
Shows price reversal points on the chart. Works on a period of 1 minute. The red arrow indicates that the price will go down now, and the blue arrow shows that the price will go up now. The accuracy of the signals is up to 93% depending on the currency pair. Works on all currency pairs, including the metals gold and silver. The indicator analyzes the current price position relative to the price range for a certain period in the past. The indicator optimizes its data using mathematical modules a
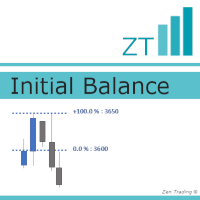
Initial Balance is a concept for the first hour of a trading session, lowest(starting) to highest point, that often determines important support / resistance for the next hours. It is based on Fibonacci levels and offers very relevant levels of reaction. Nowadays, it's mainly used for the first hour BEFORE the open. --------------- The advantage of this indicator lies here : - you could define by yourself the period for YOUR Initial Balance (first hour of a trading session, one hour before the o
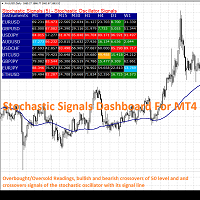
Stochastic Signals is a simple dashboard type indicator that displays the values of the stochastic oscillator on various instruments and time frames chosen by the user. The stochastic is usually used in many trading strategies, especially in countertrend systems when the price reaches overbought/oversold conditions. In addition, this indicator can be configured by the trader to show signals when the stochastic oscillator is in an overbought/oversold condition, when it crosses these levels or whe
Forex Flow Equalizer is an indicator that helps to reduce 'noise' in forex price movements. Visit https://www.mql5.com/en/blogs/post/751167 for more detailed explanation. It is programmed to enhance traders' focus, and capacity to monitor or manage multiple instruments of interest on preferred timeframe without their minds being over loaded with data or information, thereby, saving them the mental strength for more important trading decision making. Range Mode: is for traders who like to trade

신경 밴드는 스캘핑 지표입니다. 과매수 및 과매수 수준에 대해 2가지 다른 편차 밴드가 있습니다. 색상 촛불은 편차를 통과하고 강한 추세를 보이거나 색상 촛불이 편차에서 멈추고 평균으로 돌아가는 경우 추세를 결정하는 것입니다. 이 EA는 일종의 회귀 지표 거래 범위 및 가격 돌파입니다.
Neural Bands 2.0에는 다시 그리기 화살표가 추가되지 않았습니다. 신경 밴드는 스캘핑 지표입니다. 과매수 및 과매수 수준에 대해 2가지 다른 편차 밴드가 있습니다. 색상 촛불은 편차를 통과하고 강한 추세를 보이거나 색상 촛불이 편차에서 멈추고 평균으로 돌아가는 경우 추세를 결정하는 것입니다. 이 EA는 일종의 회귀 지표 거래 범위 및 가격 돌파입니다.
Neural Bands 2.0에는 다시 그리기 화살표가 추가되지 않았습니다.
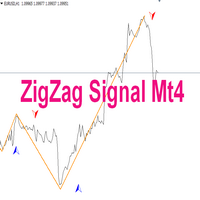
Indicator description: Indicator - ZigZag Signal is created on the basis of a well-known and popular indicator - ZigZag. The indicator can be used for manual or automatic trading by Expert Advisors. 1. The ZigZag Signal indicator has alerts of different notifications for manual trading. 2. If used in Expert Advisors, the indicator has signal buffers for buying and selling. You can also prescribe and call the indicator as an external resource and other settings and applications: (email me in a

Apollo BuySell Predictor 는 여러 거래 모듈을 포함하는 전문 거래 시스템입니다. 트레이더에게 고유한 브레이크아웃 영역, 피보나치 기반 지원 및 저항 수준, 피벗 추세선, 풀백 볼륨 신호 및 모든 트레이더가 매일 필요로 하는 기타 유용한 기능을 제공합니다. 시스템은 모든 쌍과 함께 작동합니다. 권장 시간 프레임은 M30, H1, H4입니다. 지표는 H4보다 높은 시간 프레임을 제외하고 다른 시간 프레임에서도 작동할 수 있습니다. 이 시스템은 모든 트레이더가 성공적인 거래에 필요한 모든 것을 제공하므로 보편적입니다. 이 시스템은 여러 가지 방법으로 사용할 수 있습니다. 데이 트레이딩, 스윙 트레이딩, 심지어 스캘핑까지 사용할 수 있습니다. 귀하가 선호하는 거래 스타일에 관계없이 시스템은 귀하가 시장을 실제 모습으로 볼 수 있도록 도와줄 것입니다. 모든 신호는 다시 칠하지 않고 지체하지 마십시오! 거래 기본 설정 및 작업에 따라 시스템의 다른 모듈을 켜거나 끌 수 있습

Bitcoin Predictor는 가격 반전을 예측하도록 설계된 화살표 기반 지표입니다. 이 도구는 BTC 및 기타 암호화폐와 함께 사용할 수 있습니다. 화폐로도 사용할 수 있습니다. 그러나 먼저 어떤 쌍이 가장 잘 작동하는지 확인해야 합니다. 일부 쌍과 시간 프레임은 정말 훌륭하게 작동할 수 있습니다. 직접 테스트하고 볼 수 있습니다. 표시기는 사용하기가 매우 쉽습니다. 화살표를 따라가기만 하면 됩니다. 표시기는 독립 실행형 시스템으로 작동하거나 이미 사용 중인 시스템의 일부일 수 있습니다. 표시기는 모든 암호화 통화와 함께 쉽게 사용할 수 있습니다. 또한 사용 중인 시간 프레임 및 쌍에 신호를 적용할 수 있습니다. 표시기에서 사용 가능한 하나의 입력 매개변수만 조정하면 됩니다. 정말 쉬워요. 신호를 다시 칠하지 마십시오! 구매 후 연락주세요! 내 거래 권장 사항 및 보너스를 공유하겠습니다!

The Key level wedge indicator automatically draws rising wedge pattern and falling wedge pattern for you on the chart. This pattern is really good when used as a confirmation entry at key support & resistance, supply & demand and reversal zones.
Advantages
The Key level wedge block DOES NOT RE-PAINT, giving you confidence when a signal appears and also helps when looking back. The Key level wedge includes an on/off button on the chart to easily keep the charts clean after analysis by just o
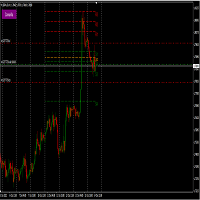
This tool draws all the pivot point lines on chart. It is important to remind/tell you that there are 5 pivot method according to BabyPips website. All these methods have their unique mathematical formula. 1. Floor Method. 2. Woodie Method. 3. Camarilla Method. 4. DeMark Method. 5. Fibonacci Method. What makes this pivot tool unique is that you can click the "Fibonacci" button to select the pivot method you want. You can click the "Monthly" button to select the Period you want to use for the piv

FX 화살표 반전은 스캘핑 추세를 의미하는 간단하고 복잡하지 않은 화살표 표시기입니다. 거래 선택의 임의적 방법이 사용됩니다. 추세선, 오실레이터, 이동 평균, 채널 또는 거래자가 원하는 기타 방법. 표시기는 모든 시간 프레임 및 모든 자산에서 작동합니다. 자본을 보존하기 위해 손절매를 사용하십시오.
지표가 작동하는 방식은 수렴 및 발산 및 추세 모멘텀에서 파생됩니다. ATR은 지표가 모든 자산에서 작동할 수 있도록 사용됩니다. 표시기에 경고가 있습니다. FX 화살표 반전은 스캘핑 추세를 의미하는 간단하고 복잡하지 않은 화살표 표시기입니다. 거래 선택의 임의적 방법이 사용됩니다. 추세선, 오실레이터, 이동 평균, 채널 또는 거래자가 원하는 기타 방법. 표시기는 모든 시간 프레임 및 모든 자산에서 작동합니다. 자본을 보존하기 위해 손절매를 사용하십시오.
지표가 작동하는 방식은 수렴 및 발산 및 추세 모멘텀에서 파생됩니다. ATR은 지표가 모든 자산에서 작동할 수 있도록 사
Promotion $66 lifetime for you.
The principle of this indicator is very simple: detecting the trend with Moving Average, then monitoring the return point of graph by using the crossing of Stochastic Oscillator and finally predicting BUY and SELL signal with arrows, alerts and notifications. The parameters are fixed and automatically calculated on each time frame. Example: If you install indicator on EURUSD, timeframe M5: the indicator will detect the main trend with the Moving Average on this

The Trend TRN trend indicator works using a special algorithm and a set of indicators. It finds the current trend based on many factors.
Trend TRN entry points should be used as potential market reversal points. The indicator works using the cyclic-wave dependence function. Thus, all entry points will be optimal points where the movement changes.
A simple and convenient indicator. The user can easily see the trends. You can use this indicator alone or in combination with other indicators acco

Introducing the trend indicator! Ready trading system. The principle of the indicator is to automatically determine the current state of the market when placed on a chart. The indicator analyzes market dynamics for pivot points. Shows the favorable moments of entering the market with stripes. Can be used as a channel indicator or level indicator! This indicator allows you to analyze historical data, and on their basis display instructions to the trader on further actions. To find out how to dete
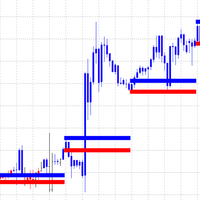
Market Dynamics는 추세 스캘핑을 위한 것입니다. 파란색이 매수, 빨간색이 매도입니다. 라인은 가격 통합 영역이며 일반 막대 캔들은 결정되지 않았습니다. 가격은 지지선과 저항선 사이에서 통합된 다음 해당 영역에서 가격 움직임이 발생합니다. 두피 위 또는 아래에 그림 영역을 그리고 두피에 대한 주요 트렌드 또는 데이 트레이드를 따르십시오. Market Dynamics는 추세 스캘핑을 위한 것입니다. 파란색이 매수, 빨간색이 매도입니다. 라인은 가격 통합 영역이며 일반 막대 캔들은 결정되지 않았습니다. 가격은 지지선과 저항선 사이에서 통합된 다음 해당 영역에서 가격 움직임이 발생합니다. 두피 위 또는 아래에 그림 영역을 그리고 두피에 대한 주요 트렌드 또는 데이 트레이드를 따르십시오.

A useful scanner/dashboard that shows the RSI values for multiple symbols and time-frames.
It can be easily hidden/displayed with a simple click on the scanner man top left of the dashboard.
You can input upper and lower RSI values and the colours can be set to show when above/below these values. The default values are 70 and 30. There are also input colours for when the RSI is above or below 50 (but not exceeding the upper/lower levels
Symbols and time-frames are input separated by commas.
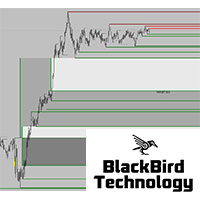
Dear Traders, check out my new multi level market liquidity indicator : https://www.mql5.com/en/market/product/73098
Many of you have been trading very good with this indicator, thanks for the support and positive feedbacks ! For more information about market liquidity, a manual on how to use this indicator please send me a message. A lot of information can be found on the net. (search liquidity trading/ inner circle trader)
https://www.youtube.com/watch?v=yUpDZCbNBRI
https://www.youtube.com/
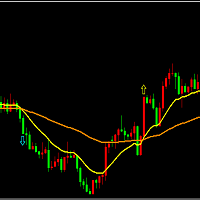
基于均线交叉的算法信号,该指标会显示历史1000个周期的信号方向,其中短周期和长周期数值可以按需要资金调整。使用者可以依据该信号判断当前趋势。该信号适用于任何周期,使用者可以切换不同周期观察各个周期的最近信号方向,然后综合进行开仓分析。 开仓建议:综合日级别、4小时级别、1小时级别信号进行整体判断,再参考RSI,波动强度等进行开仓分析。 优点: 适用于所有周期; 适用于所有品种; 可以自定义短周期、长周期参数; 适用于判断当前趋势; 能抓住大趋势,获取长期利润。 不足: 由于是均线策略,所以对趋势的反转反应不及时,可以借助波动强度和突破情况来改进该信号。 输入参数: 均线短周期数:短周期参数。 均线长周期数:长周期参数。
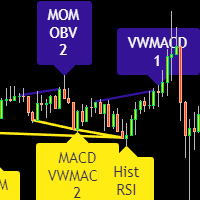
Divergence indicator 10 different indicators. Finding and displaying classic and hidden divergences.
Indicators in which divergences are searched: MACD MACD Histogram; RSI; Stochastic; CCI; momentum; OBV; VWmacd; Chaikin Money Flow; Money Flow Index. This is a replica of the indicator from the tradingview resource, adapted for the MT4 terminal.
MT5 version available here: https://www.mql5.com/en/market/product/87879
Settings: Bars in history for analysis - number of bars for analysis; D
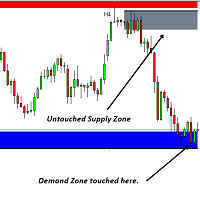
이 소프트웨어 도구는 사용자 정의 가능한 5가지 색상을 선택하여 수평 추세선과 직사각형을 생성하는 프로세스를 간소화하도록 설계되었습니다.
MT5에서 정확한 수평 추세선을 그리는 것은 어려울 수 있지만 이 지표를 사용하면 원하는 색상으로 쉽게 추세선을 만들 수 있습니다.
또한 우리 도구는 귀하가 그리는 수평선과 관련된 가격 수준을 명확하게 표시합니다.
우리는 귀하의 피드백을 소중히 여기며 이 도구가 귀하의 거래 요구에 맞는 귀중한 자산이 되기를 바랍니다.
주저하지 말고 귀하의 생각을 우리와 공유해 주십시오. ..................................................................................
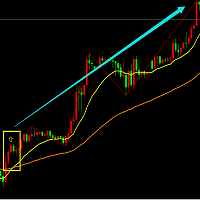
This is a signal that mainly diagnoses the current direction based on data analysis, price breakout algorithms, and strategies based on some major indicators. This signal will display all the signals from a historical period on the main chart and is a good choice if you like to show the direction of the signals on the chart. Advantage: Suitable for all breeds. Applies to all cycles. Only one adjustable parameter, easy to use. Notice: This signal only provides all the most probable signals, and u
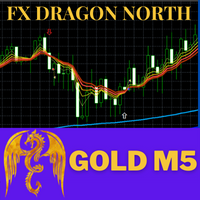
FX Dragon North Indicators is a trend indicator designed specifically for gold and can also be used on any financial instrument. Recommended time frame (XAUUSD:M5,M15,M30,H1,H4.) , (Forex: H1,H4,DAY) Can be combined with EA FX Dragon North X to increase the accuracy of EA FX Dragon North X and make more profit. ... SETTINGS Alerts - on off audible alerts. E-mail notification - on off. email notifications. Puch-notification - on off. Push notifications.

Please follow the "How To Trade" instructions exactly for best results Wycoff theory is vastly used by institutional traders but when it comes to retail traders the concept isn't well understood by most. It is even more difficult to implement in intraday & swing trading. This No REPAINT indicator helps you in analyzing the market cycles and plots buy/sell signals at the start of trending phase. It studies the market strength of bulls and bears and does a effort Vs reward matrix calculation befor

Offer 249 down from 350 for the next 3 copies. then back to 350 $
Are you tired of using outdated indicators that leave you guessing where to set your profit targets? Look no further than the AK CAP Opening Range Breakout Indicator. This powerful tool is backed by a US patent and has already helped countless traders pass funded challenges like FTMO. We use it daily on our prop traders and internal funds, and now it's available to you as well. The calculation behind the indicator is incredibly a

Hello;
This indicator presents you with a power matrix of 28 cross pairs made up of the eight most voluminous currencies. Thanks to this power chart, it shows the pairs with the best trend strength and direction. The dashboard offers a basket trading method. So you can make an average profit by trading between pairs with certain correlations.
Input parameter descriptions:
Note_1: Indicates which method the dashboard will use to find the correlation.
Input parameter that allows you to select

This indicator is based on the Weis wave principle of wave volume. Below are few features of the indicator It draws the wave on the chart while the accumulated volume per wave in a different window at the bottom of the chart You can configure the turning point move It displays the accumulated volume (in thousands, eg for 15000 volume it will show 15) at the end of each wave You can also configure to show number of candles in the wave along with the wave volume The indicator calculates the distin
MetaTrader 마켓 - 트레이더를 위한 로봇 및 기술 지표는 거래 터미널에서 바로 사용할 수 있습니다.
The MQL5.community 결제 시스템은 MQL5.com 사이트의 모든 등록된 사용자가 MetaTrader 서비스에서 트랜잭션을 수행할 수 있습니다. 여러분께서는 WebMoney, 페이팔, 또는 은행 카드를 통해 자금을 예치하거나 인출하실 수 있습니다.
