 MetaTrader 5
 Experts
 지표
 라이브러리
 유틸리티
 위젯
 규칙
MetaTrader 4용 유료 기술 지표 - 78
 아래 나열된 기술 지표의 시그널은 MetaTrader 4 플랫폼의 거래를 열고 종료하는 데 중요한 역할을 합니다.
지표의 본질은 가격 변화를 예측하기 위한 금융 시그널 값의 수학적 변형입니다.

Improve trading with this indicator. Find areas of buys or sells in Fibonacci retracement areas. Fulltrend is for scalping and making swing trades. Fib levels are added for take profits and stop losses. This works on any time frame and can be used by itself or together with other systems and indicators for filters. The indicator doesn't repaint. Alerts are added and can be true or false. No need to sit glued to the computer, just set on charts and listen or the alerts to come. Take a posi
The Breakeven levels indicator is an indicator that, according to its algorithm of work, determines the number of open orders on a certain instrument finds the level at which all orders go from loss to profit. Separately, for sell and buy orders, the general level of the beginning of profit is found. In the lower left or right corner, information is displayed on three buttons to choose from. When you press the button, a horizontal line of a certain level is displayed on the screen. On the right
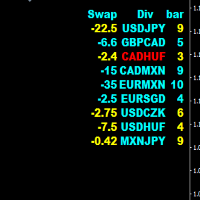
Divergence HiLo scaner is a good tool for market analysis. The indicator looks through all currency pairs and finds those that meet the selection conditions, where corrections or reversals to the main movements are supposed to begin. The indicator values are entered in the final table. 1 value is swap 2 Currency pair. 3 The number of bars after finding the selection conditions. The bar color blue is used for the buy signal. The bar color yellow is used for the sell signal. The color of the
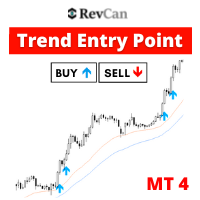
[75% OFF! - SALE ENDS SOON] - RevCan Trend Entry Point is a trend based trade alert indicator for serious traders. It does all the price and chart analysis all by itself, and whenever it finds any potential high quality trading opportunity(Buy or Sell) using its revolutionized price prediction algorithms, it sends instant trade alert directly on the chart, MT4 terminal and on the mobile device. The trade signals will be visible on the chart as Up and Down arrows, while the instant audible aler
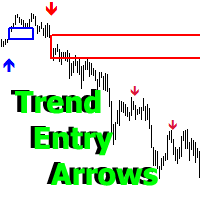
Developed methods for trading collected in one indicator. In the form of arrows, it defines entries in the direction of the trend.
It has 2 types of arrows - trend and signal guides, informing about the potential movement in the direction of the trend.
Works without redrawing, ready for use on all symbols/tools.
The most suitable time frames to use are M15, M30, H1, H4.
How to use
The indicator finds the direction of the trend in the form of a signal arrow, a graphic rectangle stretches along
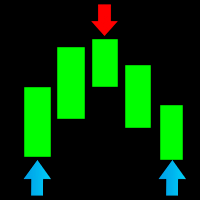
An indicator that shows price reversal points on the chart. Using RSI and other standard indicators, the indicator determines the price reversal points and shows them on the chart with arrows. The indicator does not redraw its values and in 95% of cases it shows accurate signals. This indicator works on all currency pairs and all timeframes.
How to trade with this indicator (recommendations): We recommend opening trades in the direction of the arrow that appears. If a blue arrow appears, ope

Fibonacci retracements are trend lines drawn between two significant points, usually between absolute lows and absolute highs, plotted on a chart. Intersecting horizontal lines are placed at the Fibonacci levels. Fibonacci retracements are useful tools that help traders identify support and resistance levels. With the information gathered, they can place orders, identify stop-loss levels, and set price targets. Although useful, traders often use other indicators to make more accurate assessments

Multi-timeframe signal trend indicator.
Detects the trend direction and is colored in the corresponding color.
It has three different sensitivity options
Can show trend direction on other timeframes
Has embedded audible and visual alerts on trend reversals.
Can send notifications to your phone or email.
Allows trend and counter-trend trading.
Works on all timeframes, all currency pairs, metals, indices and cryptocurrency.
It can be used for binary options.
Distinctive features No re-d
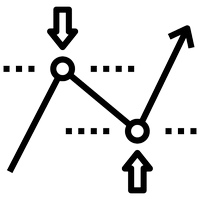
이 표시기는 최적의 이익실현 및 손절매 수준을 표시합니다. 이 수준은 과거 데이터를 기반으로 계산됩니다. 처음 시작할 때 표시기는 기록에 대해 학습됩니다. 그런 다음 그는 가격이 미래에 이 또는 그 수준을 극복할 확률을 평가하고 정지 주문을 하기 위한 가장 최적의 옵션을 선택합니다. 예를 들어 이익을 취하는 값은 이익이 최대이고 가격이 해당 수준에 도달할 확률이 가장 높도록 선택됩니다. 손절매 수준은 최소한이어야 하지만 도달할 확률은 최소한이어야 합니다. 결과적으로 승리에 대한 수학적 기대치가 가장 높은 레벨이 생성됩니다. 또한 이 지표는 지지선과 저항선의 형태로 사용될 수 있습니다. 이를 위해 다양한 예측 길이와 오프셋을 결합할 수 있습니다. 표시 매개변수: 길이 - 예측 길이. 이 매개변수는 향후 막대 거래의 예상 기간을 나타냅니다. Shift - 막대에서 이동합니다. 이 매개변수 덕분에 과거의 표시기 판독값을 볼 수 있습니다. 너비 - 선 너비. ClrBuy - 매수 포지션의

RSI Signals is a simple dashboard type indicator that displays the values of the RSI (Relative Strength Index) oscillator on various instruments and time frames chosen by the user. In addition, it can be configured by the trader to show signals when the RSI is in an overbought/oversold condition, when it crosses these levels or when it crosses the 50 level, which is important in some strategies. It is simple and easy to set up. By itself, it should not be used as a trading system since RSI signa
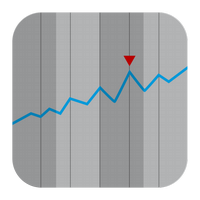
초기하 계열은 이 필터의 가중치 계수를 계산하는 데 사용됩니다. 이 접근 방식을 사용하면 시계열을 다소 흥미롭게 평활화할 수 있습니다. 초기하학적 필터 가중치는 지수 및 선형 가중 이동 평균만큼 빨리 감소하지 않지만 평활 이동 평균보다 빠릅니다. 이로 인해 이 필터의 동작은 여러 면에서 이동 평균의 동작과 유사합니다. 그러나 몇 가지 장점이 있습니다. 그 지연은 이동 평균보다 훨씬 적습니다. 그러나 동시에 지수 이동 평균보다 훨씬 더 많은 정보를 보유합니다. 이로 인해 초기하학적 필터는 금융 시계열의 추세와 순환 구성 요소를 더 잘 강조 표시할 수 있습니다. 따라서 이 지표는 다양한 유형의 이동 평균을 사용하는 거래 전략에 사용할 수 있습니다. 표시기의 작동은 단일 매개변수에 따라 다릅니다. iPeriod - 이 매개변수의 유효한 값은 2 - 149입니다. 이 매개변수의 값이 작을수록 지표는 최신 가격 변화에 더 강하게 반응합니다. 이 매개변수의 값이 크면 장기적인 추세를 강조할

Scalping Code is for trend scalping. It is simple to use and is profitable. It can work on any time frame and any asset. This indicator can be used on it's own or together with another system. The arrow does not repaint or recalculate.
The rules are as follows: A blue arrow above the moving average is a buy. An exit for the buy above the moving average is a red arrow or target. A red arrow below the moving average is a sell. An exit for the red below the moving average is a blue arrow
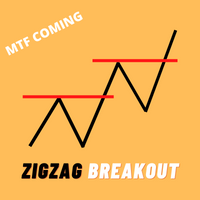
ZigZag Breakout Arrow Very high accurate buy and sell signals provide, you can also use as market reverse signal or Trend change alert Features. ZigZag Parameters changeable. Alerts. Buy and Sell Signal. ZigZag Breakout on candle close or candle high price. and MTF Update will coming soon. ZigZag Breakout on candle close or candle high price. Setting adjustable
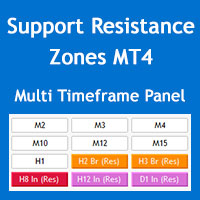
Support and Resistance zones indicator for MT4 is a multi-timeframe panel and alert that finds support and resistance zones and pivot points for all timeframes of MetaTrader 4 and gives alert when price has interaction with them. Download demo version (works on GBPUSD, EURJPY and NZDUSD symbols) Read the full description of scanner parameters in the blog page . Many unique features in one indicator:
Integrating support and resistance zones and pivot points in one indicator with powerful filteri
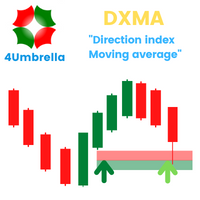
Indicator MT4 : DXMA(Direction index moving average)
Objective: To track price trends and price reversals.
How to set up Indicator DXMA : 1. The standard value is EMA 12 and EMA 26, you can set it as you like. 2. UTBx 14 is Universal Trend Boundary Index, standard value 14. 3. UTBx Method is a method for calculating the standard value is Exponential.
Meaning of symbols in indicators : 1. The line of the green group means the trend is up. 2. The line of the red group represents a down trend. 3
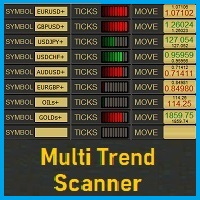
MultiTrend_Scanner is an indicator for the MT4 platform that is used to review trends on multiple symbols. We turn it on on any symbol, on any TF and we have a preview of the entire market. The current symbol is permanently assigned in the first segment of scanner. When adding another segment, you can manually enter any symbol. The quantity of added segments is unlimited. In each segment of a given symbol displayed are trends on different TFs. To calculate the strength of these trends are used
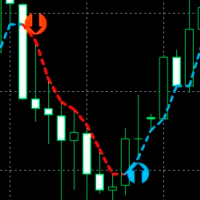
An indicator for accurately determining price reversal points on all timeframes and all currency pairs. With the help of technical analysis of the market and mathematical diagnostic models, this indicator determines the price reversal points and the current trend direction with great efficiency. The indicator displays this information on the chart in the form of arrows and lines. The arrows show the trend reversal points and the lines show the current trend direction. INDICATOR trades in real ti
This indicator is based on the same famous fractal indicator with a slight difference:
MetaTrader version 5 click here
Advantages:
Works on all instruments and time series,
Does not redraw its results,
Comparison depth is adjustable,
Works well with any popular strategy,
Adjust the power of fractals
Input settings:
Number of comparisons - The number of candles that each side selects for comparison.
Marker distance from the candlestick
You can contact u
This indicator is based on ParabolicSAR. This indicator does not change the trend easily and does not change the trend until it receives a clause and approval. This indicator can be used for trail stop or trend detection.
MT5 Version
benefits:
Works on all instruments and time series,
Does not redraw its results,
Comparison depth is adjustable,
Works well with any popular strategy,
The power of the areas is adjustable,
We assure you that we welcome any
The Market Sessions Indicator for MT5 helps you predict market turnarounds by detecting major supply and demand areas. These pivot points tend to occur after a new session has started and the previous one is still open. It is also used to gauge how many points or pips the market moves on average during a session. This helps us to place better our take profits and stop losses. The indicator works on all forex pairs, gold, silver, commodities, stocks, indices and any other instrument that you
The Market Sessions Indicator for MT5 helps you predict market turnarounds by detecting major supply and demand areas. These pivot points tend to occur after a new session has started and the previous one is still open. It is also used to gauge how many points or pips the market moves on average during a session. This helps us to place better our take profits and stop losses. The indicator works on all forex pairs, gold, silver, commodities, stocks, indices and any other instrument that your
The Stochastic Dashboard is multi currencies and multi timeframes dashboards. It shows the Stochastic direction for the chosen pairs/timeframes. For the Stochastic lovers and manual trader this indicator is a most indicator which can be used to determine the market direction for the pair(s) you are trading. Set it to one chart only and monitor from one place all the charts you want.

Price pivot point indicator. The indicator shows with points on the chart the places where the price can turn in the opposite direction. When the indicator draws a red dot, it means that the price can turn its movement down. When the indicator draws a blue dot, then the price can turn its move up. This indicator can be used for both manual trading and automated trading by integrating it into your robot. To do this, the indicator has data exchange buffers.
Recommended currency pairs: XAUUSD EUR
PAX Simple Trend Signals for MT4
Самый простой и лёгкий в работе индикатор для торговли по сигналам разворота тренда. Зелёными и красными линиями на ценовом графике отображаются направления тренда — растущий и падающий соответственно. Стрелка вначале линии тренда сигнализирует о развороте тренда.
Если на трендовой линии появилась стрелка такого же цвета — это сигнал на открытие нового ордера. Если на трендовой линии появилась стрелка противоположного цвета — это сигнал на закрытия всех ордеро
A professional trading indicator with double-entry options. Valuable Smooth Channel Lines on the separated window, Trend Lines both on the main window, and separated window and entry arrows. Good for trading scalping in the lower timeframes. Even also it can work and provide signals in the higher timeframes for longer-term trading periods. INDICATOR SETTINGS: 1. Signal Mode. There are 2 options: Default and Compact. If Default, it will provide 3 different arrow codes on the main window. This o
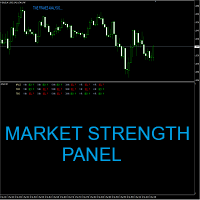
Apollo Market Strength Panel은 외환 및 바이너리 옵션 거래자에게 도움이 될 수 있는 다중 기간 지표입니다. 패널은 M1에서 H4까지 여러 시간 프레임의 시장 상황을 나타냅니다. 이 지표는 세 가지 중요한 시장 측면에 대한 정보를 제공합니다. 트렌드, 포스, 임펄스입니다. 이 3가지 구성 요소가 모두 일치하면 표시기는 시장 방향에 따라 매수 또는 매도 신호를 제공합니다. 표시기는 차트에 바로 신호를 표시합니다. 신호를 생성해야 하는 시간 프레임을 선택할 수 있습니다. 또한 모든 시간 프레임이 정렬되면 신호를 제공할 수도 있습니다. 표시기는 시장 분석을 수행합니다. 신호를 적용할 준비가 되었습니다. 패널은 독립형 시스템 또는 기존 거래 시스템의 일부로 사용할 수 있습니다. 구매 후 저에게 연락하여 개인적인 거래 조언과 훌륭한 보너스 지표를 얻으십시오!
Advanced Trend System은 높은 확률로 잠재적인 추세 반전 포인트를 찾고 추세 형성 초기에 시장에 진입하라는 신호를 수신할 수 있는 독점 알고리즘을 사용하는 혁신적인 지표입니다. 지표는 현재 시장 상황을 추적하며 모든 내부 전략이 합의되고 서로 100% 일치할 때만 지표가 매수 또는 매도 신호를 제공합니다. 지표는 2008년 이후의 거래 경험의 결과입니다!
지표 장점
거래를 위한 이상적인 진입점! 모든 통화 쌍, 지수, 상품 및 암호화폐 쌍에 사용할 수 있습니다.
간단한 사용 규칙.
스캘핑 및 일중 거래에 적합합니다.
다시 그리지 않았습니다.
표시기 신호가 나타나면 전자 메일 및 휴대 전화로 메시지를 보낼 수있는 기능이 내장 된 경고 기능.
직관적인 기능, 사용하기 쉽습니다.
사용 권장 사항 매수 신호: 표시 화살표가 위쪽을 향하고 있습니다.
매도 신호: 표시 화살표가 아래쪽을 향하고 있습니다.
같은 방향으로 여러 개의 연속적인 신호가 있는 상황이
MT5 Version A versatile tool
You do not need any other tools with this tool.
You can enable or disable all indicators.
Their values are adjustable.
In the first line you will see a summary of your account status.
p: The amount of your profit or loss
BP: The amount of your daily profit based on the balance
EP: Equity daily earnings
WP: Your weekly profit
MP: Your monthly profit
The next line shows each of the time frames you selected.
Chikou: The Chikou process
KT: The trend of the K and T li
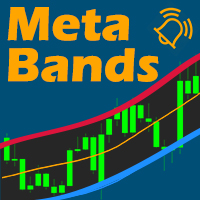
MetaBands uses powerful and unique algorithms to draw channels and detect trends so that it can provide traders with potential points for entering and exiting trades. It’s a channel indicator plus a powerful trend indicator. It includes different types of channels which can be merged to create new channels simply by using the input parameters. MetaBands uses all types of alerts to notify users about market events. Features Supports most of the channel algorithms Powerful trend detection algorith
트렌드 진입 히스토그램: 반전을 정확히 포착하고 진입을 최적화하세요 트렌드 진입 히스토그램 은 트렌드나 가격 움직임이 수명 주기의 끝에 도달하여 곧 반전될 것임을 감지하도록 설계된 강력한 알람 지표입니다. 시장 구조가 변경될 때 시기적절한 경고를 제공하며, 이는 일반적으로 중요한 반전이나 큰 하락이 발생할 가능성이 있을 때 나타납니다. 이 지표는 가능한 소진 지점 주변에 새로운 고점 또는 저점이 형성될 때마다 돌파 및 가격 모멘텀 을 면밀히 모니터링합니다. 현재 트렌드를 기반으로 높은 확률의 거래 설정 을 식별하면, 이 지표는 히스토그램을 그려 이를 시각화합니다. 시장 방향의 잠재적 변화에 대한 중요한 신호는 가격이 그려진 히스토그램 직사각형 위 또는 아래에서 마감될 정도로 약화될 때 발생합니다. 지표가 어떻게 작동하는지 보려면 아래 비디오를 확인하십시오! 주요 기능: 조기 반전 알림: 중요한 소진 시점에 잠재적인 시장 구조 변화에 대해 정확히 알림을 받아 시장에서 변화를 예측하는

Overview: With so much noise and distraction in the markets I wanted to create clarity for traders to have a simple, efficient, and fun trading experience. This is why I created Pipsurfer. Pipsurfer is an trend following indicator that visually shows you important Institutional Smart Money levels in the market and helps you to trace Market Structure in the markets. Most traders find it difficult to visually see trading elements such as trend, structure and momentum which are key for understandin

Advanced Bollinger Bands Scanner is a multi symbol multi timeframe Bollinger bands dashboard that monitors and analyzes the Bollinger Bands indicator from one chart. This panel monitors the Bollinger bands indicator in up to 28 configurable instruments and 9 timeframes for price overbought/oversold, price consolidation (Bollinger bands squeeze), and consolidation breakout (squeeze break) with a deep scan feature to scan all market watch symbols (up to 1000 instruments!).
Download Demo here (
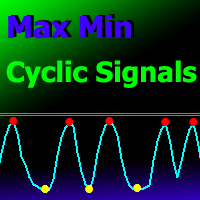
Cyclical indicator for trading and predicting the direction of the market. Shows the cyclical behavior of the price in the form of an oscillator.
Gives signals for opening deals when rebounding from the upper and lower boundaries of the oscillator. In the form of a histogram, it shows the smoothed strength of the trend.
Will complement any trading strategy, from scalping to intraday. The indicator does not redraw. Suitable for use on all symbols/instruments. Suitable time frames for short-term t
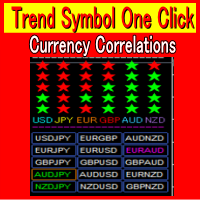
Currency Strength Meter 1:Correctly identifying trends in foreign exchange investments is critical. 2:TrendSymbolOneClick quickly detects and displays trends that have just begun and those that have already been in place for an extended period of time. 3:There is also a USD JPY EUR GBP AUD NZD strength function. 4:Volatility allows you to know exactly when there is a major market move. 5:You can save time in your market analysis by using Trend Symbol One Click. 6:Analysis available from 1 minut

Master Point is an indicator set that includes the most powerful and necessary tools for a trader, giving that very edge in the markets to be successful. An indicator that has an elegant and complete system that works very well in all markets (Forex, Crypto, Stocks, Indices) helps to find the best reversal points. It has tools such as trend reversal detection, pivot points, divergences, currency strength and 'candle strength'. All this makes the indicator a complete tool that does not require a

Всем привет. Представляю Вашему вниманию Индикатор TRUE ATR для mt4 Так же есть данный индикатор для mt5 https://www.mql5.com/ru/market/product/82319 Данный индикатор работает на всех рынках. TRUE ATR высчитывает среднестатистическое движение инструмента за 1 день и показывает сколько в инструменте осталось энергии внутри дня. В отличие от классического индикатора АТР которые без разбора учитывает все бары(свечи), TRUE ATR при расчете среднестатистического движения инструмента исполь

IGRIDCOIN.COM PRESENT SIGNALS FROM THE OUTER LIMITS! IgridCoin Space Signals is a unique 4 in 1 reversal trend indentation bot 100% non-repainting multi-timeframe indicator that can be used on all symbols/instruments: forex, commodities, cryptocurrencies, indices, stocks. “Igrid space signals” it will determine the current trend and at what point a reverse will happen at its early stages, gathering information and data from up to 4 special indicators, which are: Average Directional Movement Ind

PROFITABLE TRADER is an interesting name for this indicator... And all because it is for a true trader who values his time. It has a built-in Alert and parameters that will make your work easier. Open settings will allow you to set the indicator to any cryptocurrency or just currency. It's better to test and then draw a conclusion .. screenshots will show everything.. good bidding my friend.

This indicator is named so for a reason, because it will show the reverse side of the market.
It has several math indicators built in that are tuned to show the best signals for currency pairs!
Ideally proved to be in work on the M5-M15 no more and no less!
Only at the same time it shows up to 86.5% of correct signals!
The settings include the colors of the arrows, the alert, and the same parameters so that you can reconfigure the indicator and trade on cryptocurrency and raw materials!
If

An excellent indicator for those who like fast binary options trading!
It works great on m1-m5 timeframes!
The periods are customizable, so you can even set up for cryptocurrency, and trade on weekends!
You can also customize the color of the arrows!
Works on all timeframes!
But as stated above, it's better on m1 - m5!
Whatever you forget about the signal, it has an alert!
Test and try this indicator! If I have questions write, I will gladly listen to suggestions and errors!
Promining Trade Signal 지표는 모든 전략을 보완하며 독립적인 도구로도 사용할 수 있습니다. 이익 권장 M30 기간 사용하기 쉬운; 불필요한 정보로 그래픽에 과부하가 걸리지 않습니다. 모든 전략에 대한 필터로 사용할 수 있는 기능. 양초가 닫힌 후에도 표시기는 색상을 변경하지 않습니다. 주식, 지수, 오일, 금 및 모든 시간대에서 작동합니다. 푸시 알림 및 소리 알림 기능이 있습니다. 경고 - 경고를 활성화/비활성화합니다. 푸시 알림 - 푸시 알림을 활성화/비활성화합니다. 피보나치 1, 2,3,4,5,6,7,11,21,31,41,51,61,71 - 동적 지원 및 저항 수준 설정. 구매 후 비밀댓글로 언제든지 연락 가능합니다. Promining Trade Signal 지표는 모든 전략을 보완하며 독립적인 도구로도 사용할 수 있습니다. 이익 권장 H1 기간 사용하기 쉬운; 불필요한 정보로 그래픽에 과부하가 걸리지 않습니다. 모든 전략에 대한 필터로 사용할 수 있는 기능.

Moving Average Trend Scanner is a multi symbol multi timeframe triple MA crossover dashboard that helps traders to monitor, and identify potential market trends from one chart. This panel scans 3 moving averages in up to 28 configurable instruments and 9 timeframes for triple moving average alignment and moving average crossover with a deep scan feature to scan all market watch symbols (up to 1000 instruments!).
Download Demo here (Scans only M1 and W1) Settings description here MT5 version

Hello, traders! Welcome to the introduction of Market Meeter ( MT4 )
This is the Meta Trader 4 version of the "Multi Timeframe Analyzer". Click here to Get MT5 version <<---
What is this indicator? Simply put, this indicator analyzes the market across eight different timeframes , from lower to higher, and predicts the next price direction along with an estimated continuation time. It does this by using volume, volatility, and price patterns in its calculations. Let's dive

Pipsurfer Dashboard is a multi-currency multi-timeframe dashboard designed to alert you to where the action is happening in the forex markets. The software trades a trend based price action and market structure strategy. Assets Supported: All Forex Metals Indices Major Crypto
Major Input Settings: Timeframe Filters - Choose which timeframe you want the Pipsurfer Dashboard to signal you on. Pair Selection - Choose To Follow All Major Pairs And Crosses or have a custom list of your choice Alert

" Scalping saham " is a unique, turnkey scalping trading system. It shows the trader when and where to open and close trades. Scalping trading is one of the most effective, but at the same time, the most complex trading systems. Therefore, if you don’t have your own strategy yet, you’d better take a ready-made scalping strategy and work with it. The scalping strategy of this indicator is to determine the direction of the trend with high accuracy, then determine the price reversal points and giv
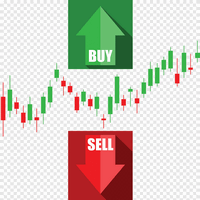
이 지표는 가격 시리즈의 지역 최고가와 최저가를 사용합니다. 극값을 강조 표시한 후 값이 평활화됩니다. 덕분에 외부 및 내부의 두 가지 채널이 구축되었습니다. 가격 움직임이 선형 추세를 따르는 경우 내부 채널은 한계를 보여줍니다. 외부 채널은 대수 추세로 가격 움직임의 경계를 보여줍니다. 채널을 계산한 후 표시기는 실제 가격 움직임을 분석하고 개시 및 종료 위치에 대한 권장 사항을 제공합니다. 파란색 점 - 시작 매수 포지션, 빨간색 - 시작 매도 포지션. 해당 십자가는 특정 위치를 닫을 것을 권장합니다(있는 경우). 모든 신호가 동일한 강도와 정확도를 갖는 것은 아니라는 점을 기억해야 합니다. 어떤 경우에는 올바른 방향의 가격 움직임이 매우 빨리 끝나서 큰 이익을 얻을 수 없습니다. 신호로 인해 손실이 발생하는 상황도 있습니다(이러한 신호의 예는 마지막 그림에 표시됨). 이러한 기능을 감안할 때 다음을 권장할 수 있습니다. 현재 시장 상황에 따라 값이 변경될 수 있는 유동적 이익
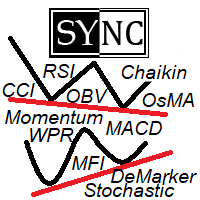
Divergence and Convergence are important harbingers of reversals in stock markets.
The Divergence Sync indicator is designed to automatically search for divergences on a large number of indicators with different parameters.
The search for divergences is carried out on these indicators: (CCI, CHO, DeMarker, MACD, MFI, Momentum, OBV, OsMA, RSI, Stochastic, WPR, Awesome Oscillator ).
To search for divergences, you can use one technical indicator or search simultaneously on any number of indicator

The TickCounter indicator counts up and down ticks on each new bar.
The calculation starts from the moment the indicator is placed on the chart.
Histogram bars represent: Yellow bars - total number of ticks; Blue bars - ticks UP; Red bars - ticks DOWN. If the blue bar is not visible, then there are more down ticks and the red bar is displayed on top of the blue one (the red layer is above the blue one). MT5 version: https://www.mql5.com/en/market/product/82625
Each reinitialization of the i

Anchored Volume Weighted Average Price (AVWAP, or Anchored VWAP). Tells you who is in control, the buyers or the sellers. Better than all other moving averages because it adds weight to the traded volume. This technique was made popular by Brian Shannon of Alphatrends. It is calculated by multiplying typical price by volume, and the dividing by total volume. It is very simple to use. 1. Press a number from 1 to 9 on the keyboard, then click the chart where you want to anchor the VWAP. 3. Hold C
SL Curruncy impulse flow of this intraday Asian London New York Sessions strength.SL Curruncy impulse indicator best for intraday scalper. market powerful move time you can catch best symbol. because you'll know which currencies are best to trade at that moment. Buy strong currencies and sell weak currencies Suggested timeframes to trading : M1 - M5 - M15 - M30 -H1 You can however just change SL Curruncy impulse to check in the settings. Bear in mind that scanning very low timeframes. How d

Ichimoku Trend Finder is a multi symbol multi timeframe trend dashboard that helps traders to monitor and identify potential market trends from one chart. This panel scans the Ichimoku Kinko Hyo indicator in 28 configurable instruments and 9 timeframes for classic Ichimoku trend signals with a deep scan feature to scan all market watch symbols (up to 1000 instruments!).
Download Demo here (Scans only M1 and W1) Settings description here MT5 version here
After the purchase, don't forg
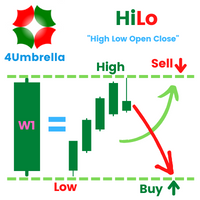
Inficator MT4 : HiLo Objective : Find Support and Resistance zone
How to set up Indicator HiLo : 1. Indicators type multi time frame are MN1 W1 D1 H4. 2. Customize for use MN1 only or W1 only or D1 only or H4 only or open all. 3. We use MN1 and W1 for set to Key level. 4. For Close price or Open price to high price set for Resistance zone. 5. For Close price or Open price to Low price set for Support zone.
How to trade for success : Entry point : Buy / Long position 1. Price bid hit the f

The Chop Exploder indicator is a custom indicator that has a long run, tight chop, short chop, and band colour. This indicator has MT4 alert notification,mobile notification, and email notification. The default indexing of all arrays and indicator buffers is left to right. The index of the first element is always equal to zero. Thus, the very first element of an array or indicator buffer with index 0 is by default on the extreme left position, while the last element is on the extreme right posit

Good dial indicator "Pigment"
Pointer indicator "Pigment"
This product is great for binary options.
Showed itself well on M5 M15 timeframes.
Multicurrency also works well in news releases.
Does not draw and the signal appears on the current candle
Blue arrow buy
red arrow sell
You can also set the signal frequency to your liking:
In the settings, simply change the Period, the default is Period 3.
The R[2] Forex Indicator is a complete Forex Trading System working on major forex pairs on 15 Minutes time frame, and it draws: Low Dot / High Dot to spot potential turning points Buy Arrows and Sell Arrows to help you enter the trades with the perfect timing A two colors dotted line to show the trend in action and the target for reversal signals
I invite you to watch my Videos on YouTube where I show the R[2] Strategy and how I personally trade with it, and als
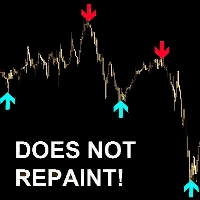
"Avadhut sathe" is an indicator for scalping. Shows the trader with arrows on the chart the price reversal points. Best of all "Avadhut sathe" trades on M1, M5, M15 timeframes. Recommended currency pairs: GBPUSD, EURUSD, GOLD, SILVER, BTCUSD, AUDUSD, USDJPY, EURJPY, USDCHF, USDCAD, EURCHF. The "Avadhut sathe" indicator has many modes of operation, on which the accuracy of the signals depends. In most modes, the "Avadhut sathe" indicator does not redraw its signals. The "Avadhut sathe" indicator
The R[2] Gold Indicator is a complete Trading System working on GOLD (XAUUSD) on 5 Minutes time frame, and it draws: Low Dot / High Dot to spot potential turning points Buy Arrows and Sell Arrows to help you enter the trades with the perfect timing A two colors dotted line to show the trend in action and the target for reversal signals
I invite you to watch my Videos on YouTube where I show the R[2] Strategy and how I personally trade with it, and also to join my
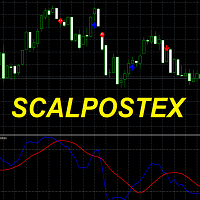
Scalpostex는 거래자에게 주문을 여는 포인트와 방향을 보여주는 기성품 거래 시스템입니다. 거래 시스템은 17개의 시장 분석 모듈로 구성됩니다. Scalpostex는 지표, 촛대 패턴 및 저항/지지선을 사용하여 시장을 분석합니다. 복잡한 시장 분석 방법을 사용하여 이 지표는 높은 정확도로 가격 움직임을 예측할 수 있습니다. 이 지표로 거래하는 방법(권장 사항): 표시되는 화살표 방향으로 거래를 시작하는 것이 좋습니다. 파란색 화살표가 나타나면 구매 주문을 엽니다. 빨간색 화살표가 나타나면 매도 주문을 엽니다. TakeProfit은 평균 15-25에 베팅하는 것이 좋습니다. StopLoss는 TakeProfit보다 2배 더 많이 설정되거나 신호가 반대 방향으로 나타날 때 주문을 닫습니다. 또한 이 지표는 기존 거래 시스템과 결합하여 신호를 확인할 수 있습니다. 시스템 장점: 다시 그리기, 지연 없음; 추세 변화를 예측합니다. 가격 움직임의 반전 포인트를 보여줍니다. 스캘핑 시스
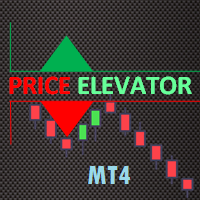
The Price Elevator indicator is developed to help you figure out the general long-term trend of the market. If the price is above the Green separator line, this is a clear indication the bulls are in control. Similarly, the bears are in control if the price continues to trend below the red separator line. Download Price Elevator MT5
Trend Re-entry In this case you would plan your buy entries above the green dotted box (make sure to set the Buy / Sell Retracement Floor=30). The SL should be

Scalping Points XL is a scalping indicator from the "Scalping Points" series. This indicator is designed to show the trader the price reversal points. The indicator has many settings and different modes of operation. Does not redraw its values. Depending on the setting mode, it can draw signals both at the very beginning of the appearance of a candlestick and at its close. The principle of operation of this indicator is to analyze the market for volatile price changes and show the trader signal

이 표시기는 소위 "악" 숫자를 가중치 계수로 사용합니다. 그들의 반대는 이 지표에도 표시되는 "혐오스러운" 숫자입니다. 숫자를 이 두 클래스로 나누는 것은 특정 숫자의 이진 표기법에서 단위 수에 의해 결정되는 해밍 가중치와 연관됩니다. 이러한 숫자를 가중치 요인으로 사용하면 추세 추종 지표가 생성됩니다. 또한, 혐오스러운 숫자는 더 민감한 지표를 제공하고, 악한 숫자는 보수적인 지표를 제공합니다. 그들 사이의 차이는 그리 크지 않으며 시장의 급격한 가격 움직임에서만 알 수 있습니다. 이 지표를 사용하면 새로운 추세의 시작을 결정하는 데 도움이 될 수 있습니다. 이를 통해 위치를 여는 순간을 보다 정확하게 결정할 수 있습니다. 표시 매개변수: Type numbers - 숫자 유형 선택, Evil 또는 Odious; iPeriod - 표시 기간. 표시기의 감도는 이 매개변수에 따라 다릅니다. 작을수록 가격 변화와 시장 동향의 변화에 대한 민감도가 높아집니다. 표시기 동작의 예는
You can use the indicator as the main one to determine the trend. The indicator can work both for entry points and The Chord Trend indicator works well on longer trend sections. In flat it is recommended to use filters of your choice. It can accompany the position with a stop, it is recommended to set the stop at a fixed distance from the point formed by the indicator. If you combine the use of the indicator as an input and accompanying a position, then to accompany the stop it is necessary tha
The indicator uses its own market analysis algorithm that recursively goes through bar-level price movement information such as open, close and shadow prices. With this indicator, you can find the most likely trend reversal points. A simple but effective system for determining the forex trend. From the screenshots you can see for yourself the accuracy of this tool. Works on all currency pairs (cryptocurrencies, raw materials, stocks). The alert system (alert, email notifications) will help you

The purpose of the inidcator is to identify the reversal point.
The blue arrow is buy signal and the yellow star is its stop loss. The red arrow is sell signal and the yellow star is its stop loss. Alert feature: if there is a signal, the indicator will send alerts of popup window,email or mobile push. Inputs: Popup Window Alert: it is false in default Email Alert : it is false in default Mobile Push Alert: it is false in default. MetaTrader 5 Version: Reversal Point Please note that the singal

이 표시기는 RPTrade Pro Line 시스템의 일부입니다.
Scalper Pro Line은 Price Action을 사용하는 단기 추세 지표입니다. 누구나 사용할 수 있도록 설계되었으며 거래의 절대 초보자도 사용할 수 있습니다. 다시 칠하지 마십시오. 표시는 닫기에서 닫기로 제공됩니다. 단독으로 사용하도록 설계되어 다른 표시기가 필요하지 않습니다. 특정 그래프는 히스토리 데이터에 따른 이익과 최종 손실을 보여줍니다.
어떻게 작동합니까 Scalper Pro Line은 가격 조치 시스템과 결합된 내부 추세 지표를 사용하고 있습니다. 시작 시 시스템은 10000개의 첫 번째 기록 막대를 분석하여 최상의 설정을 찾습니다. 그런 다음 이러한 설정이 전체 기록에 적용되고 실시간으로 사용됩니다. 가장 신뢰할 수 있는 정확도와 안정적인 거래 신호를 얻을 수 있는 보증입니다. 전략 및 설정의 "성공"은 차트의 그래프 덕분에 즉시 확인할 수 있습니다. OnChart 그래프를 사용하면 전략
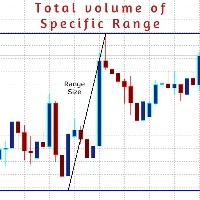
AboaishaRV_Calculator is an info indicator.
It manages to calculate the range and total volume between any 2 points on the chart.
To use it just install the indicator and draw a trend line between point X and point Y and it will show you the difference in the price and the total volume traded inside this range. Indicator inputs: DataColor >> the color of the info range size and volume size of the range. LinesColor >> the color of the range border lines if they are used. FontSize LinesWidth Range

" MACD crossover " is a new version of the oscillator indicator. " MACD crossover " draws a red or blue line on the chart. When the line is blue, it means that the MACD indicator is above zero. If the line on the chart is red, it means that the MACD indicator is below zero. Thus, this indicator helps traders determine the MACD position visually on the chart. This information will be especially useful when trading scalping. You can combine this indicator and trend indicators on the chart. If thi

This is based on Demark's TD Sequential and TD Combo set of indicators. It mostly has the TD Sequential features. It contains the Arrows Indicator showing Buy/Sell signals and the scanner dashboard. Both are for MT4 (Metatrader 4) Platform.
Read in detail in this blog post. And get extra indicators here: https://www.mql5.com/en/blogs/post/749596 and commentary about signals and how to wait for right time: https://www.mql5.com/en/blogs/post/759157
Feature List: - Set TD Setup (9), Countdown (13

"Bitcoin indicator" is a ready-made mechanical trading system for Bitcoin. The system is implemented as an indicator that shows the trader on the chart the price reversal points and the current trend direction. This information is enough to effectively trade in the market. The "Bitcoin indicator" consists of a complex analytical block that constantly analyzes the market and shows the trader where the trend is heading. The indicator also shows with dots on the chart, the price reversal points. S
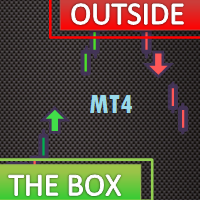
The Outside The Box (OTB) is a complete trading system that provides the user with immense trading ability by highlighting on the chart areas where the trader should prepare to Re-enter the trend after pullbacks (Pullback trading strategy) Take partial/complete profit(Profit taking strategy), and Trade breakouts (Stock breakout strategy) - We have updated the indicator to show/hide Micro breakout areas around the major breakouts (Micro Breakouts). The above is supported by an alert system
MetaTrader 마켓은 거래로봇과 기술지표를 판매하기에 최적의 장소입니다.
오직 어플리케이션만 개발하면 됩니다. 수백만 명의 MetaTrader 사용자에게 제품을 제공하기 위해 마켓에 제품을 게시하는 방법에 대해 설명해 드리겠습니다.
