ZigZag Signal Mt4
- 지표
-
Ruslan Latypov
 Author - Ruslan Latypov
Profile page on MQL5 - https://www.mql5.com/ru/users/Sowaruslan - 버전: 2.0
- 활성화: 10
Indicator description:
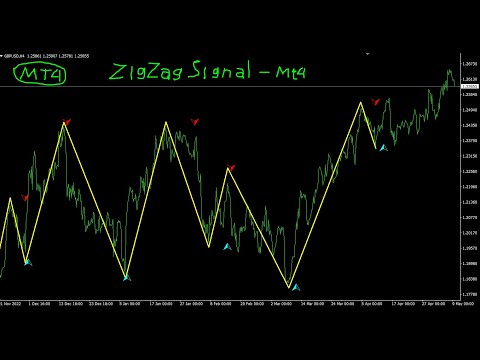
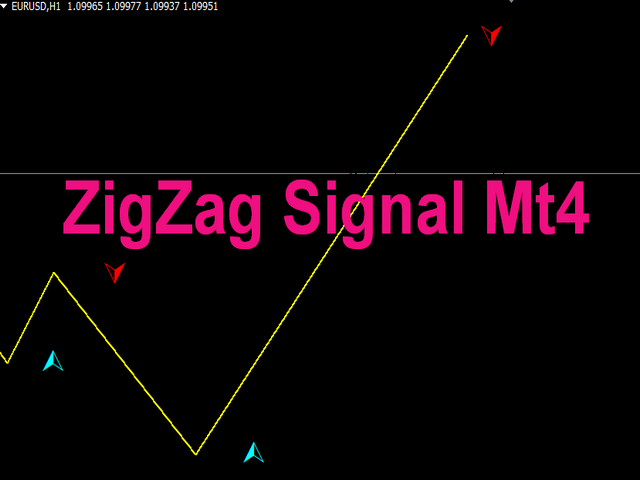
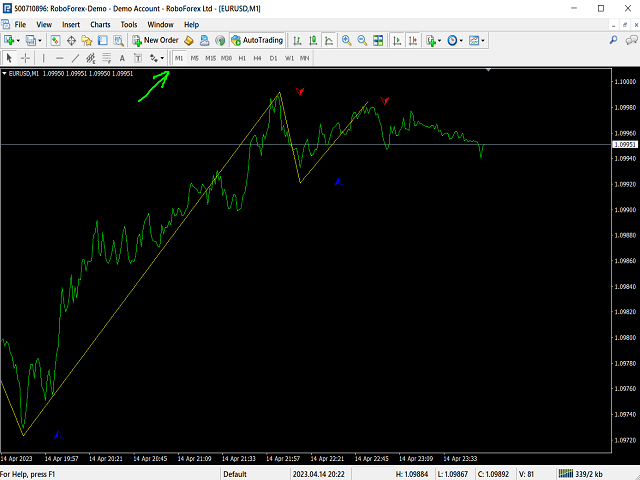
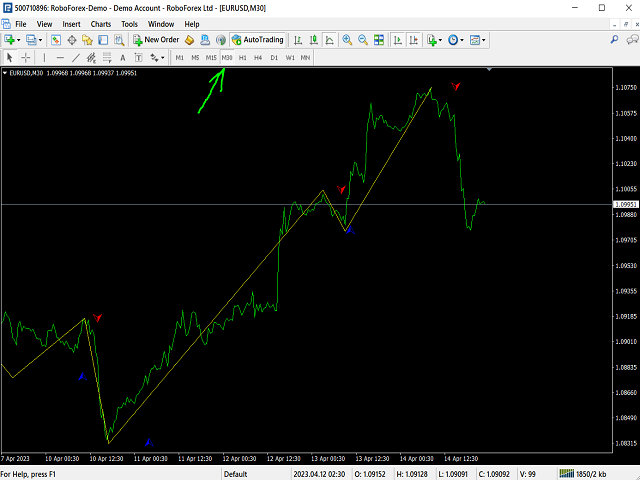
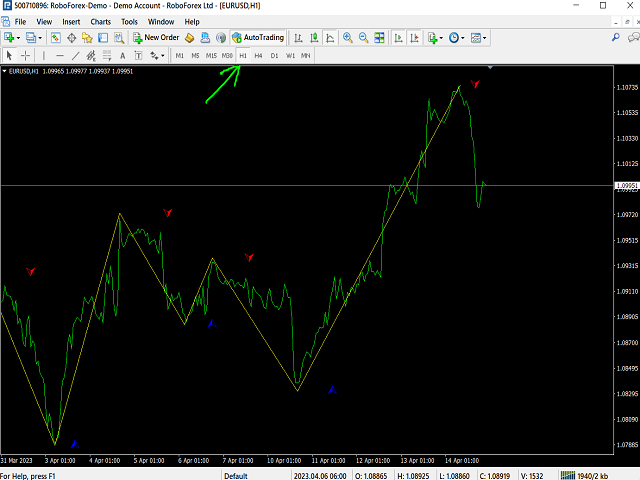
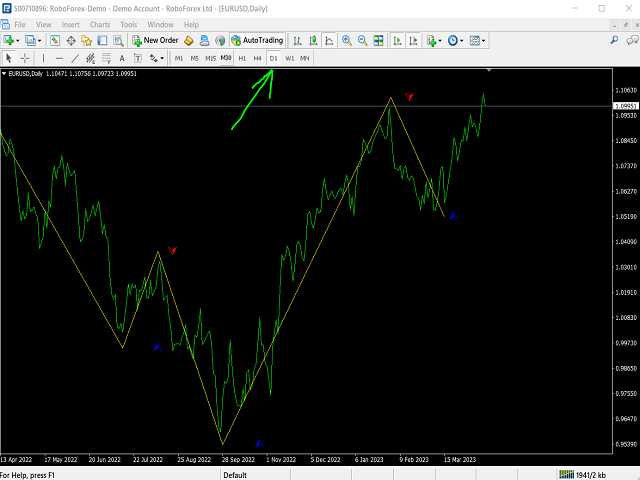
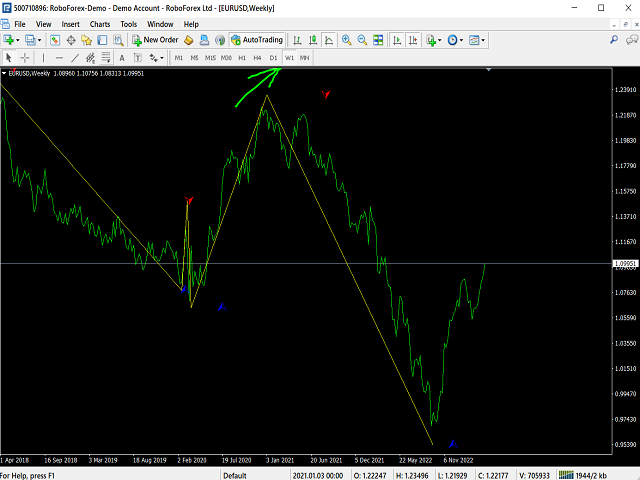
Indicator - ZigZag Signal is created on the basis of a well-known and popular indicator - ZigZag.
The indicator can be used for manual or automatic trading by Expert Advisors.
1. The ZigZag Signal indicator has alerts of different notifications for manual trading.
2. If used in Expert Advisors, the indicator has signal buffers for buying and selling.
You can also prescribe and call the indicator as an external resource and other settings and applications:
(email me in a personal message after you purchase the indicator - ZigZag Signal).
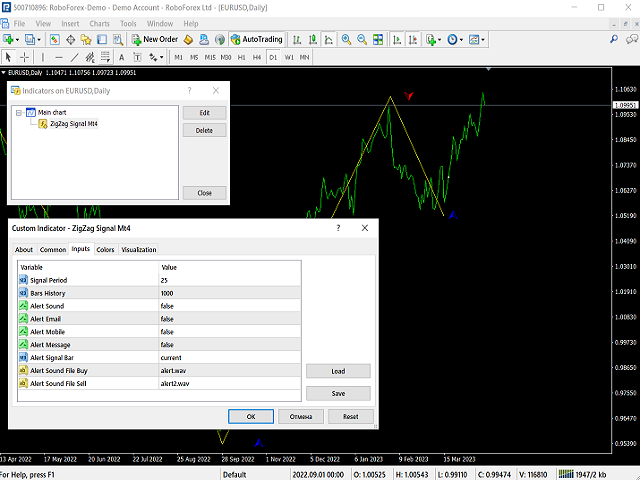
The parameter - Signal Period, is responsible for sensitivity to changes in the direction of the price in the market, the lower the number of this period, the stronger the sensitivity to the market and changes in the direction of the price in the market.
The higher this value, the less often the signals and less indicator - Zigzag Signal reacts to noise, divergence and small corrections in the trend.
The indicator does not redraw or move the signal arrows on the following bars.
Once the arrow is fixed on the chart, it does not redraw or disappear.
Of course, you can test the indicator on the history and check its work before you purchase it.
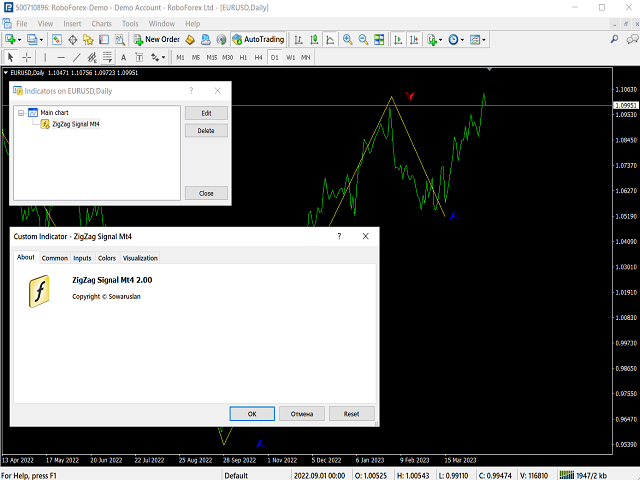
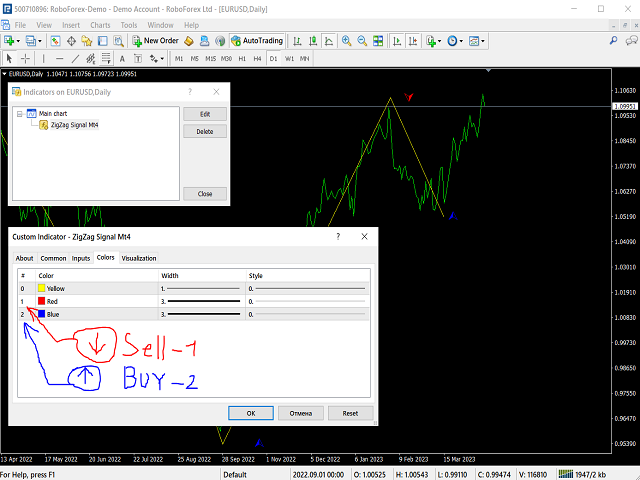
Indicator settings: ZigZag Signal Mt4
//+------------------------------------------------------------------+
enum enumar
{
cr, // current
cl // close
};
//+------------------------------------------------------------------+
//--- input parameters
extern inttern Length = 25; // Signal Period
extern int barn = 1000; // Bars History
extern bool AlertsSound = false; // Alert Sound
extern bool AlertsEmail = false; // Alert Email
extern bool AlertsMobile = false; // Alert Mobile
extern bool AlertsMessage = false; // Alert Message
extern enumar SignalBar = 0; // Alert Signal Bar (current bar/close bar)
extern string AlertsSoundFileBuy = "alert.wav"; // Alert Sound File Buy
extern string AlertsSoundFileSell = "alert2.wav"; // Alert Sound File Sell
//+------------------------------------------------------------------+