 MetaTrader 5
 Experts
 지표
지표
 라이브러리
라이브러리
 유틸리티
유틸리티
 위젯
위젯
 규칙
규칙
MetaTrader 4용 유료 기술 지표 - 85
 아래 나열된 기술 지표의 시그널은 MetaTrader 4 플랫폼의 거래를 열고 종료하는 데 중요한 역할을 합니다.
지표의 본질은 가격 변화를 예측하기 위한 금융 시그널 값의 수학적 변형입니다.
아래 나열된 기술 지표의 시그널은 MetaTrader 4 플랫폼의 거래를 열고 종료하는 데 중요한 역할을 합니다.
지표의 본질은 가격 변화를 예측하기 위한 금융 시그널 값의 수학적 변형입니다. 
The indicator shows price reversal points on gold and other currency pairs. Recommended periods for work: M1, M5, M15, M30, H1. The indicator analyzes the market and shows the trader with points where there is a possibility of a price reversal in the other direction. The accuracy of the signals depends on the settings, the period and the selected operating mode. On average, the accuracy of signals is up to 93%, which is suitable for intraday scalping trading. You can control the accuracy of the

This indicator labels swing highs and swing lows as well as the candle pattern that occurred at that precise point. The indicator can detect the following 6 candle patterns: hammer , inverse hammer , bullish engulfing , hanging man , shooting star and bearish engulfing .
The notations HH, HL, LH, and LL you can see on the labels are defined as follows:
HH : Higher high
HL : Higher low
LH : Lower high
LL : Lower low
Setting
Length: Sensitivity of the swing high/low detection,

Lets dabble a bit into Elliot Waves.
This is a simple indicator which tries to identify Wave 1 and 2 of Elliot Impulese Wave and then projects for Wave 3.
Ratios are taken from below link: https://elliottwave-forecast.com/elliott-wave-theory/ - Section 3.1 Impulse
Wave 2 is 50%, 61.8%, 76.4%, or 85.4% of wave 1 - used for identifying the pattern. Wave 3 is 161.8%, 200%, 261.8%, or 323.6% of wave 1-2 - used for setting the targets
Important input parameters MaximumNumBars : To calculate back

The indicator changes the current chart timeframe depending on the drawdown in the deposit currency, the number of orders or the percentage of the deposit. You can set the drawdown in the deposit currency, the number of orders in one direction or the percentage of the deposit, at which the current timeframe will change to the selected one. This significantly reduces the drawdown during the work of Expert Advisors using order networks.
Indicator parameters: Drawdown in currency, orders or percen

Identify Engulfing candle pattern with Arrows & Alert ( built-in RSI filter). This indicator helps you to identify Engulfing candle pattern or Outside bar (OB) on the chart with arrows, along with an alert when a new Engulfing candle appears. Engulfing candle pattern is one of the most important reversal Price Action signals. You can choose between standard Engulfing (Engulfing based on candle body) or non standard Engulfing (Engulfing based on candle high - low )
Alerts can be turned on an
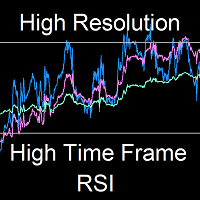
High Time Frame Relative Strength Index is a unique, causal indicator that displays the instantaneous, high-resolution evolution of up to three higher-timeframe RSI curves inside the current lower-timeframe chart. Unlike conventional multi-timeframe indicators, which repeat a single completed RSI value as a stepped line throughout the entire higher-timeframe bar, this indicator calculates how the higher-timeframe RSI actually develops bar by bar. It therefore preserves information that is normal

Identify Pinbar Candle Pattern with Arrows & Alert (built-in RSI filter).
This indicator helps you to identify Pin bar Candlestick Pattern (or shooting star & hammer pattern) on the chart with arrows, along with an alert when a new Pin bar appears. Pin bar pattern is one of the most important reversal Price Action signals.
You can set Minimum Percent of Wick (or Tail) Length over full bar length (Recommended: 60%, 70%, 75%).
Alerts can be turned on and off: Popup Email Push Notification Soun

자동 주문 블록 OSW
(메타트레이더 5)
이 표시기는 다음과 같은 사전 설정된 규칙에 따라 주문 블록을 표시하는 역할을 합니다.
>이전의 충동을 깨뜨리는 충동이 있다는 것.
> 발견되면 형성된 촛대 패턴을 찾아 가장 효율적인 방법으로 장소의 고저를 계산하고 Order Block의 고저를 생성하는 역할을 합니다.
> 오더 블록이 생성된 후 인디케이터는 캔들이 오더 블록의 위아래 라인을 교차하는지 지속적으로 확인하여 가능한 신호가 있음을 나타내는 경고 신호를 생성합니다.
>지표가 제공하는 신호는 다른 전략과 같이 100% 효과적이지 않으므로 수동 기술 분석을 동반하는 것이 좋습니다.
> PC, 모바일 및 이메일의 세 가지 유형의 알림이 생성됩니다. 자동 주문 블록 OSW
(메타트레이더 5)
이 표시기는 다음과 같은 사전 설정된 규칙에 따라 주문 블록을 표시하는 역할을 합니다.
>이전의 충동을 깨뜨리는 충동이 있다는 것.
> 발견되면 형성된 촛대 패턴을 찾아 가장
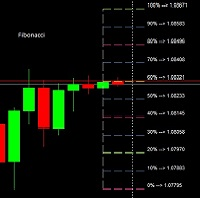
Fibonacci por color en niveles para aplicar estrategia profesional inicialmente se coloca en el punto mas alto del dia y mas bajo con esto es para ubicar operaciones a una distancia exacta con lo cual se busca generar ganancias residuales internas en el mismo dia con esto las lineas fusias es para colocar las entrdas sell y las lineas verdes amarillas van los buy

This Trusty Strong Arrow indicator is designed for signal trading. This indicator generates trend signals.
It uses many algorithms and indicators to generate this signal. It tries to generate a signal from the points with the highest trend potential.
This indicator is a complete trading product. This indicator does not need any additional indicators.
The indicator certainly does not repaint. The point at which the signal is given does not change.
Features and Suggestions Time Fr
SSL Channel Indicator MT4을 소개합니다. 가격 추세 동향을 시각화하여 거래 정확성을 향상시키기 위해 설계된 강력한 도구입니다. 이 지표는 간단하면서도 효과적인 이중 SMA 접근 방식을 통해 추세 반전 및 지속을 식별하려는 거래자에게 이상적입니다. 혁신적인 플립 기법을 활용하여 SSL Channel Indicator MT4은 명확한 시각적 신호를 제공하여 다양한 시장 상황에서 적시에 거래 결정을 내릴 수 있도록 도와줍니다. 데이 트레이더이든 장기 투자자이든, 이 지표는 거래 전략을 크게 개선할 수 있습니다. MQL 제품 설치 가이드 | 구매한 MQL 제품 업데이트 MT4/MT5 | 일반 문제 해결 가이드 | 지표 설정 / 가이드 주요 기능 버퍼 통합: 지표 값을 접근 가능한 버퍼로 노출하여 Expert Advisor가 자동 거래를 위해 직접 읽을 수 있도록 합니다. 팝업 알림: 신호 이벤트에서 MetaTrader 알림 팝업을 발생시켜 거래 설정을 놓치지 않도록 합니
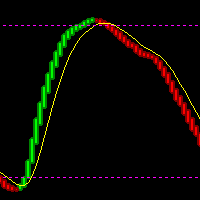
A top and bottom indicator that can intuitively identify the trend of the band. It is the best choice for manual trading, without redrawing or drifting. How to get this indicator for free: Learn more Price increase of $20 every 3 days, price increase process: 79--> 99 --> 119...... Up to a target price of $1000. For any novice and programming trading friend, you can write the signal into the EA to play freely. Array 3 and array 4, for example, 3>4 turns green, 3<4 turns red. If you don't underst

MT5 Version Kill Zones
Kill Zones allows you to insert up to 3 time zones in the chart. The visual representation of the Kill Zones in the chart together with an alert and notification system helps you to ignore fake trading setups occurring outside the Kill Zones or specific trading sessions. Using Kill Zones in your trading will help you filter higher probability trading setups. You should select time ranges where the market usually reacts with high volatility. Based on EST time zone, followin
Индикатор использует сложный алгоритм, который позволяет ему обнаруживать потенциальные развороты тренда. На основе его кода, индикатор сравнивает движение цены со средним диапазоном свечей. Так же индикатор показывает места флета где появляется разворот и приостанова движения цены Работает на любой валютной паре, с любым таймфреймом Дополнительно можно встроить передачу сигналов в телеграм, Выбор цветов позволяет пользователю настроить свою цветовую гамму.
[ MT5 Version ] [ Kill Zones ] [ SMT Divergences ] How to trade using Order Blocks: Click here Experience the ultimate in trading precision with the Order Blocks ICT indicator, designed to empower traders with unparalleled insights into market dynamics. This advanced tool leverages order flow and volume analysis to reveal crucial buying and selling pressures driving price action. Why Choose Order Blocks ICT? Unleash Market Insights: Order Flow Analysis: Discern buying and selling pressure

이것은 3Bar_Play로 알려진 Price Action 기반 전략이며 3Bar 촛대 패턴 형성을 기반으로 합니다. 매수/매도 신호 화살표를 표시하기 전에 필터 및 확인을 위해 추가 표시기가 추가됩니다. 상승 추세, 하락 추세 또는 횡보 시장에서 거래될 수 있습니다. 추가된 지표는 다음과 같습니다. 스토캐스틱 - 모멘텀 피셔 - 트렌드 ATR - 신호 화살표의 베이스에서 손절매 배치를 명확하게 정의하는 변동성(ATR 손절매 방법 사용). 좋은 위험 관리를 통해 보상에 대한 위험은 1:1에서 1:4 사이가 될 수 있습니다. 매수 - 약세 막대 2개와 강세 막대 1개 후에 매수 신호가 나타날 때. 매도 - 2개의 강세 막대와 1개의 약세 막대 후에 매도 신호가 나타날 때. 추가 기능 차트의 신호를 켜거나 끄는 토글 버튼이지만 경보는 아닙니다. 설정 패널에서 조정 가능한 매개변수(다운로드 시 기본 설정). 이메일/푸시 알림을 활성화하여 화면에서 멀리 떨어져 있을 때 신호를 알려줍니다.

A ready-made trading strategy for scalping on the M5 period (M5 timeframe), on any currency pair. The trading strategy has been tested and has shown good performance. Every trader, even a beginner, can scalp using this strategy. To start trading, you need to open your Metatrader4 on your PC, download the "Scalping signal indicator" from this page and add it to the chart of the currency pair you want to trade. You need to select M5 timeframe (the indicator will not work on other timeframes witho
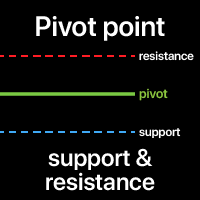
피벗 포인트는 전체 시장 트렌드를 결정하는 데 사용됩니다. 피벗 레벨 자체는 이전 바의 최고가, 최저가, 종가의 평균입니다.
다음 바에서 피벗 포인트 위에서 거래하는 것은 지속적인 강세장을 나타내는 것으로 간주되며, 피벗 포인트 아래에서 거래하는 것은 약세장을 나타냅니다.
피벗 포인트는 지표의 기초가 되지만, 피벗 포인트를 기반으로 투영된 다른 지지 및 저항 수준도 포함됩니다. 이러한 모든 수준은 가격이 거부될 수 있는 위치를 파악하는 데 도움이 됩니다. 다기능 유틸리티 : 66개 이상의 기능 포함 | 문의 사항이 있으면 저에게 연락하세요 | MT5 버전 지표 설정에서 다음을 구성할 수 있습니다: 기간 계산에 사용 (클래식 방법은 일일 타임프레임에서 계산을 포함)
선 색상 과 스타일 텍스트 위치 폰트 스타일 및 크기 프로그램 파일은 " Indicators " 디렉토리에 배치해야 합니다.

PSAR Scanner Dashboard for MT4:
(Multi-timeframe and Multi-currency) Parabolic SAR (Stop and Release) Indicator is mainly for analyzing the trending markets. And this dashboard will look for the switch and also other strategies. Features: Scan for PSAR Switch Show how many bars back the switch happened Check ADX line is between min and max range specified Check -DI > +DI for SELL And +DI > -DI for BUY Check Higher Timeframe PSAR Alignment Check if Moving Averages are stacked in an up/down trend
Download the filter for the indicator to work BetterVolume_1_4.mq4 https://drive.google.com/file/d/1Mgsjj7MxZn9yTjwyL7emKkfQKorl40AJ/view?usp=sharing
The arrow indicator without redrawing shows potential entry points to the market in the form of arrows of the appropriate color: the up arrows (usually green) offer to open a purchase, the red down arrows – a sale. The appearance of arrows may be accompanied by sound signals. It is usually assumed to enter at the next bar after the pointer, but t

This Special Strong Arrows indicator is designed for signal trading. This indicator generates trend signals.
It uses many algorithms and indicators to generate this signal. It tries to generate signals from the points with the highest trend potential.
This indicator is a complete trading product. This indicator does not need any additional indicators.
The indicator is never repainted. The point at which the signal is given does not change. When the signal comes the arrows are put back one ca

the Super Smart Candles detection indicator
It detects the major breakout Candles amplified by the volume and Candle body size and shows it in a separate window to give a great indication of market power - if Bears dominates :: you will see big Red lines during the day bigger than green ones - if Bulls dominates :: you will see big Green lines during the day bigger than red ones It works on any time frames indicator inputs * frequency : from 1 t0 4 : : higher value gives more signals - lo
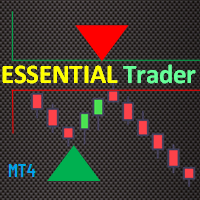
The Essential Trader indicator is more comfortable with whipsaw/ranging market conditions. It is not a complicated trading indicator and can be used on any timeframe with high level of confidence. Besides, it has notifications and alerts. The dotted essential points show spots where you can make immediate entries and benefit from breakout on either side of the region. On the other hand, the color filled points display reversal regions. These are important in that you can trade along the trend or

R Scalper 화살표 표시기는 통화 쌍에 대해 읽기 쉬운 구매 및 판매 신호 화살표를 제공합니다.
단기 추세를 예측하는 데 좋습니다. 위쪽 화살표는 쌍이 단기 상승 추세에 있음을 나타냅니다. 아래쪽 화살표는 쌍이 단기 하락 추세에 있음을 나타냅니다. 장기 거래의 경우 손절매를 핍 아래에 두십시오.
짧은 거래의 경우 핍을 통해 손절매를 설정하십시오.
나는 함께 간다 이 지표는 단순 이동 평균 및 지수 이동 평균과 같은 외환 지표를 따르는 장기 추세와 함께 사용할 수 있습니다.
추세 추종 지표가 나타내는 추세 방향으로만 거래하십시오.
기본 거래 신호 R Scalper Arrows 표시기 신호는 해석하기 쉽고 다음과 같습니다.
거래 매수 – 차트에 보라색 위쪽 화살표가 나타나면 매수 거래를 시작하세요.
매도 거래 – 차트에 보라색 아래쪽 화살표가 나타나면 매도 거래가 시작됩니다.
거래 종료 – 반대 신호에 따라 거래를 종료하거나 자신의 종료 방법을 사용하십시오.
특징
This Pure Super Signal indicator is designed for signal trading. This indicator generates trend signals.
It uses many algorithms and indicators to generate this signal. It tries to generate signals from the points with the highest trend potential.
This indicator is a complete trading product. This indicator does not need any additional indicators.
The indicator is never repainted. The point at which the signal is given does not change. When the signal comes the arrows are put back one ca

The indicator is specialized for use in scalping strategies. It has the ability to send buy/sell signals. the indicator highlights signals during the formation of any fresh tick and the investor has the opportunity to apply them not alone, but taking into account the n number of specific signals for a specific time. In other texts, it is necessary to take into account which way the indicator advises trading in its own 5-7 last signals. It is not recommended to use this indicator as a single and

IconTradeSL. Возможность выставлять sl по уровням. В индикаторе установлена возможность показывать историю уровней на графике. Возможность выставлять sl по уровням. Настройки индикатора: ЦВЕТ_BAR - цвет баров по которым ищем SL
ЦВЕТ_Тек_BAR - Purple;//цвет текущего бара
BAR - поиск в последних BAR барах (по умолчанию 200)
show_bar - показывать бары по которым ищем SL

R Chimp Scalper는 외환 투기꾼과 데이 트레이더를 위한 훌륭한 거래 도구입니다.
이 스캘핑 표시기의 신호는 매우 명확하고 읽기 쉽습니다.
별도의 거래 창에서 0 수준 위와 아래에 녹색 및 빨간색 막대를 그립니다. 녹색 막대는 0 수준 위에 정렬되어 강세 투기 추세를 나타냅니다. 빨간색 막대가 0 아래에 정렬되어 스캘핑 하락 추세를 나타냅니다. 0 수준 위의 표시기 수치는 스캘핑 상승 추세를 나타내며 거래자는 쌍을 구매하려고 합니다.
0 수준 아래의 지표 수치는 약세 스캘핑 추세를 나타내며 거래자는 해당 쌍을 매도할 것으로 예상됩니다.
더 나은 사례 이 스캘핑 오실레이터를 추세 추종 지표와 함께 사용하고 주요 추세 방향으로 거래하십시오.
기본 거래 신호 R Chimp Scalper 표시기의 신호는 해석하기 쉽고 다음과 같습니다.
매수 신호: 지표가 0 수준을 상향 교차할 때(녹색 막대로 거래) 매수 스캘핑 거래를 개시합니다.
매도 신호 – 지표가 위에서 다시
This Perfective Signal System indicator is designed for signal trading. This indicator generates trend signals.
It uses many algorithms and indicators to generate this signal. It tries to generate a signal from the points with the highest trend potential.
This indicator is a complete trading product. This indicator does not need any additional indicators.
The indicator certainly does not repaint. The point at which the signal is given does not change.
Features and Suggestions Time
This indicator is a too that : calculates position size based on account balance/equity , currency pair, given entry level, stop-loss level and risk tolerance (set either in percentage points or in base currency). It displays reward/risk ratio based on take-profit. Shows total portfolio risk based on open trades and pending orders. Calculates margin required for new position, allows custom leverage.

Supply and demand zones are at the heart of supply and demand trading . These zones are areas that show liquidity at a specific price. The supply zone is also called the distribution zone, while the demand zone is called the accumulation zone. Our indicator automatically draw supply and demand zones in Metatrader 5. It give opportunity to understand trading zone and avoiding risk.

R 3MA 교차 표시기는 3개의 이동 평균 교차를 기반으로 경고하는 인기 추세 표시기이며 더 빠른 이동 평균, 중간 이동 평균 및 느린 이동 평균으로 구성됩니다.
키 포인트 더 빠른 이동 평균이 중간 이동 평균과 더 느린 이동 평균을 모두 상향 교차하면 매수 경보가 발생합니다.
더 빠른 이동 평균이 중간 이동 평균과 더 느린 이동 평균을 하향 교차할 때 매도 경고가 발생합니다.
그것으로 거래하는 방법? 녹색 R 3MA 교차 화살표가 차트에 나타날 때마다 매수 거래를 엽니다. 빨간색 R 3MA 교차 화살표가 차트에 나타날 때마다 매도 거래를 엽니다. 차트에서 반대 거래 신호가 발생하면 거래를 종료하십시오.
좋아하는 거래 방법을 사용하여 R 3MA Cross Forex 지표로 거래를 열고 닫으십시오.
명세서 거래 플랫폼: Metatrader 4
통화 쌍: 모든 통화 쌍에서 작동합니다.
시간 프레임: 모든 시간 프레임에서 작동
입력 매개변수: 더 빠른 MA, 더 느린 MA
이 지표는 여러 지표를 사용하여 고수익 신호 거래를 생성합니다. R 신호 표시기는 차트에 정확한 구매 및 판매 화살표를 인쇄하는 완전한 FX 거래 시스템입니다.
지표는 기본 MT4 차트 창에 녹색 및 빨간색 화살표로 표시됩니다.
단일 지표에서 생성된 신호를 사용하는 것은 거래하는 동안 위험할 수 있습니다. 거래에 하나의 지표만 사용하면 더 많은 잘못된 신호를 줄 수 있기 때문입니다. 따라서 많은 외환 거래자들은 좋은 거래 설정을 걸러내기 위해 3개 이상의 지표를 사용했습니다.
무역 신호 녹색 화살표는 매수 신호입니다. 빨간색 화살표는 매도 신호입니다. R 신호 표시기는 거래 진입 및 종료 모두에 사용하거나 다른 전략 및 시스템에 대한 추세 확인 신호 표시기로 사용할 수 있습니다.
이 표시기는 모든 통화 쌍(메이저, 마이너 및 엑조틱)에서 동일하게 잘 작동하며 올바르게 사용하면 유망한 결과를 보여줍니다.
표시기 사양 및 입력 통화 쌍: 모든 통화 쌍에서 작동합니다.
시간
This Amazing Signal Entry indicator is designed for signal trading. This indicator generates trend signals.
It uses many algorithms and indicators to generate this signal. It tries to generate signals from the points with the highest trend potential.
This indicator is a complete trading product. This indicator does not need any additional indicators.
The indicator is never repainted. The point at which the signal is given does not change. When the signal comes the arrows are put back one
R Stoploss Signals 지표는 지수 이동 평균을 따르는 추세를 기반으로 합니다.
이 외환 표시기는 활동 차트에 그려진 파란색과 빨간색 선의 형태로 거래 신호를 매수 및 매도합니다.
파란색 선은 추세가 상승하고 있음을 나타내며 이는 통화 쌍을 구매하라는 신호입니다. 빨간색 선은 추세가 하락하고 있음을 나타내며 이는 통화 쌍을 매도하라는 신호입니다. 이 외환 지표에는 제안된 손절매 라인도 포함되어 있습니다.
구매 신호의 경우 파란색 손절매 선 아래에 손절매 1핍을 놓고 위로 가십시오. 매도 신호의 경우 빨간색 손절매 라인 위에 손절매 1핍을 놓고 아래로 내려갑니다. 추세 EMA 기간을 포함한 기본 지표 입력 설정은 지표의 입력 탭에서 직접 변경할 수 있습니다.
기본 거래 신호 R Stoploss 신호 표시기의 신호는 해석하기 쉽고 다음과 같습니다.
신호 구매: R Stoploss 신호 표시기가 파란색 선을 그리기 시작하면 구매 거래를 시작합니다. Sell Signa

Metatrader 4용 R 내부 막대 표시기는 내부 막대를 기반으로 사용하기 쉬운 가격 돌파 수준을 제공합니다.
그것은 순수한 가격 행동에서 작동하며 어떤 것도 다시 그리지 않으며 실제 내부 막대 위와 아래에 2개의 컬러 수평선 형태로 기본 MT4 차트 창에 나타납니다.
녹색 가로선은 저항선으로 작용하고 빨간색 선은 지지선으로 작용합니다.
롱 & 숏 트레이드 아이디어 캔들이 녹색 인사이드 바 라인 위에 종가가 있고 전반적인 추세가 상승하면 매수 주문을 시작합니다. 캔들이 빨간색 인사이드 바 라인 아래에서 마감되고 전반적인 추세가 하락하면 매도 주문을 시작하세요. R Inside Bar 표시기는 모든 통화 쌍(메이저, 마이너 및 엑조틱)에서 동일하게 잘 작동하며 올바르게 사용하면 유망한 결과를 보여줍니다.
팁
R Inside Bar 표시기와 거래하기 위해 자신이 좋아하는 거래 항목, 손절매 및 이익실현 방법을 자유롭게 사용하십시오.
항상 그렇듯이 전체 추세에 동의하고 이
UR 감마 (머신 러닝 시스템에서 발견되는 유사한 계산으로 구동됨)
UR Gamma는 기존 WaveTrend 지표에 새롭고 향상된 기능을 제공하는 최첨단 재무 분석 도구입니다. 고급 디지털 신호 처리 기술을 통합함으로써 UR 감마는 기존 WaveTrend 알고리즘의 일부 제한 사항을 해결하고 가격 움직임의 추세를 식별하고 측정하기 위한 보다 정확하고 강력하며 역동적인 접근 방식을 제공합니다.
UR 감마 사용의 이점:
최소한의 설정 모든 데이터는 백그라운드에서 계산되고 있으며 사용자를 위한 출력은 단 1개로 명확하고 깔끔합니다. 피로를 암시하는 배경 수준 모든 종류의 자산에 맞게 조정됩니다. 도구 업데이트를 최신 상태로 유지하고 빠진 것이 있다고 생각되면 요청을 보낼 수 있는 특별한 텔레그램 채팅이 있습니다!
왜 UR 감마인가?
목표는 확률 분포가 -1과 1 사이에서 진동하도록 하고 0을 중간 지점으로 하는 것입니다. 이를 달성하기 위해 활성화 함수라고 하는 기계 학습의

"Get the Trend Reverting PRO indicator for FREE with your purchase of DayTradingArrow v1 - no extra cost required."
Stay on the safe side of the market and trade with confidence by getting DayTradingArrow v1 now ! DayTradingArrow v1 algorithm filters out market noise and gives exit signals, stop loss and trailing stop level.
Key Benefits Clear buy and sell signals for fast, confident decision-making Perfect for beginners and experienced traders alike Effective across all timeframes and markets

Trend Entry Levels Indicator
The Entry Levels Indicator is a trend-following tool designed to assist traders by highlighting key levels for trade entries and profit-taking. It is built to support trading strategies by providing information on market trends and levels for Take Profit (TP) and Stop Loss (SL). This indicator can be used by traders of varying experience levels to enhance their market analysis.
Features Non-Repainting Signals: Provides signals that remain consistent over time. Mul

Deviation has a buy and sell input. Figure out the number to trade by. It is according to MACD. Study the values of the past for inputs to trade by. Use in uptrend or downtrend and follow the bigger trend for entry points or reversals. Use other filters or strategies to employ with the indicator for success. - is buy and + is sell. Trade on time frames according to your wish

** All Symbols x All Timeframes scan just by pressing scanner button ** *** Contact me to send you instruction and add you in "Wolfe Wave Scanner group" for sharing or seeing experiences with other users. Introduction: A Wolfe Wave is created with five-wave patterns in price. It shows supply and demand and a fight towards a balance price. T hese waves of price actions can help traders identify the boundaries of the trend . Also It helps forecast how the price will move in the near future
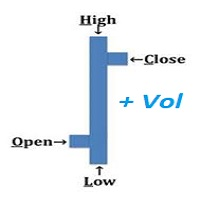
An "Intraday" indicator makes no sense anymore above H1 !! VOHLC is calculated using the following formula: VOHLC= ( Price * Volume ) / Volume Where Price= ( Open + High + Low + Close ) / 4 Volume= Tick Volume This indicator helps us to understand the current direction of the trend in the selected period. Typically, the indicator is calculated for one day, so there is no reason to use it on timeframes larger than the H1 timeframe.
This is a breakout Indicator for MT4 where you can open trades after a breakout has occurred. This indicator will draw blue boxes on the chart. You simply have to follow price until it breaks out of the box and make sure that the candle had closed above the breakout if its a buy trade and the candle must close below if its a sell trade. An alert will now pop up with suggested price entry and TP of 15 pips default. You can change TP Pis depending on your choice The indicator can trade almost any

R Delta RSI 지표는 신호 수준과 함께 빠른 RSI(기간 14)와 느린 RSI(기간 50)의 교차를 기반으로 구매 및 판매 컬러 히스토그램을 그립니다.
빨간색 히스토그램은 추세가 강세임을 나타냅니다(매수 신호). 초록색 히스토그램은 추세가 약세임을 나타냅니다(매도 신호). 회색 히스토그램은 추세가 평평하거나 범위 제한(신호 없음)임을 나타냅니다.
이 외환 지표는 독립형으로 또는 다른 추세 추종 지표와 함께 거래될 수 있습니다. 스캘퍼, 데이 트레이더 및 스윙 트레이더는 이 우수한 RSI 크로스오버 신호 표시기의 이점을 누릴 수 있습니다.
빠른 RSI, 느린 RSI 및 신호 레벨에 대한 기본 R 델타 RSI 표시기 설정은 표시기의 입력 탭에서 변경할 수 있습니다. 필요에 맞게 설정을 자유롭게 실험해 보십시오.
기본 거래 신호 R Delta RSI 외환 표시기의 신호는 해석하기 쉽고 다음과 같습니다.
매수 신호: 지표가 빨간색 히스토그램을 그릴 때 매수 거래 포지션을
UR 밴드 (기계 학습 시스템에서 사용되는 공식 포함)
UR Bands는 시장 변동성을 통합한 공식을 통해 파생된 지표로 기계 학습 시스템에서 사용되는 것과 원칙적으로 유사합니다. 시장 상황에 대한 이 수학적 표현은 금융 시장의 고유한 변동성을 고려하여 가격 추세 및 역학에 대한 정확한 분석을 제공합니다. 변동성을 변수로 통합함으로써 지표는 시장 상황을 보다 정확하고 신뢰할 수 있게 표현하여 거래자와 투자자가 정보에 입각한 결정을 내리고 위험을 효과적으로 관리할 수 있도록 합니다. 또한 변동성 기반 공식을 사용하면 지표가 시장 변화에 매우 민감하게 반응하여 잠재적인 거래 또는 투자에 대한 초기 신호를 제공합니다.
UR 밴드 사용의 이점:
시각적으로 즐겁고 이해하기 쉬운 온 차트 밴드 모든 종류의 자산 및 기간에 맞게 조정 트렌드의 고점과 저점을 항상 보여주는 밴드 추세 또는 반전 거래 시스템을 위한 훌륭한 추가 및 독립형 지표 도구 업데이트를 최신 상태로 유지하고 빠진 것이
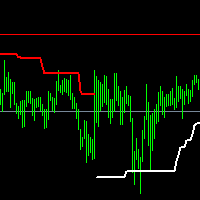
SPT is a trend indicator It is written on the basis of ATR, with clear trend lines indicating the direction in progress, Different traders' understanding of this indicator may form two different purposes Trend-based traders will conduct trend trading when the trend line changes, Respectful shock traders will carry out range trading according to the final support or resistance level marked by this indicator
The index parameters are as follows: Multiplier: multiple of ATR Period: ATR cycle. The s

The True Hero Oscillator indicator is designed for signal trading. This indicator generates trend signals.
It uses many algorithms and indicators to generate this signal. It tries to generate signals from the points with the highest trend potential.
This indicator is a complete trading product. This indicator does not need any additional indicators. This product uses 3 main indicators and many algorithms.
The indicator is never repainted. The point at which the signal is given does not c

Previous Period High Low . This indicator shows the previous Day, Week, Month and Years High and Low. It's great for price action strategies. : Provides clear and visible breaks in structure. : Easy to see breakout levels. : Easy to see gaps between previous high, low levels after breakouts have occurred. The indicator works on every time frame. Multiple periods can be selected and be seen on the same chart. Every line can be customized to Your liking. Color, style and thickness. Enjoy!
UR Vortex
The Probabilistic UR Vortex Formula: An Accurate System for Predictive Market Analysis using Volatility and Standard Deviation Calculations. The UR Vortex indicator is a technical analysis tool that uses volatility and standard deviation calculations to predict potential tops and bottoms in a market. It measures the strength of a trend by calculating the distance between the current price and a moving average, and then standardizing this distance by dividing it by the average true

R Ease Of Movement Metatrader 4 외환 표시기는 파란색 EMZ 거래 오실레이터입니다. 강세 및 약세 거래 영역을 생성하는 오실레이터 유형 외환 표시기입니다. 0보다 높은 값은 강세, 0보다 낮은 값은 약세라고 합니다.
R Ease Of Movement 오실레이터는 그 자체로는 좋은 결과를 내지 못하므로 추세 추종 기술 지표와 함께 거래해야 합니다. 좋은 외환 추세 지표에는 SMA, EMA, PSAR, Bollinger Bands, Envelopes 등이 있습니다.
기본 거래 신호 R Ease Of Movement MT4 외환 표시기의 신호는 해석하기 쉽고 다음과 같이 진행됩니다.
매수 신호: 지표가 아래에서 0.00선 위로 교차하고 닫힐 때 매수 거래를 시작하고 전체 추세가 상승해야 합니다. 매도 신호: 지표가 아래에서 0.00선 아래로 교차하고 닫힐 때 매도 거래를 시작하고 전체 추세가 하락해야 합니다. 거래 청산: 반대 신호가 발생하면 열린 매수/매
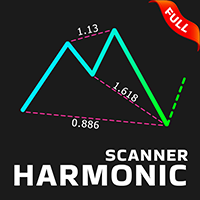
Contact me after payment to send you the User-Manual PDF File. Harmonic Trading The secret is the Fibonacci. It has been proven in the markets that price always reacts to Fibonacci levels. Fibonacci levels are one of the most important indicators of price changes. Sometimes the sequence of reactions to these levels in the chart make geometric shapes, which are called harmonic patterns. The price creates harmonic patterns with its fluctuation and reaction to Fibonacci levels. Harmonic patterns c

하나의 지표만 사용하여 거래를 자주 잃는다면 이 거래 도구를 사용해 보십시오. 이 거래 도구는 하나 이상의 지표를 사용합니다. 나는 RSI 지표만 사용하는 트레이더를 자주 관찰합니다. 시장이 과매도 상태이지만 여전히 하락세이거나, 시장이 과매수 상태이지만 여전히 상승하는 경우가 많습니다. 이러한 이유로 하나 이상의 지표를 사용해야 합니다. 새 버전 V 3.40 MTF PPAAF 소개: 다중 시간 프레임 정확한 가격 동작 화살표 필터링. 이 거래 도구는 다양한 지표를 사용하여 시장 움직임의 방향을 강화합니다.
이 거래 도구에 사용되는 첫 번째 지표는 듀얼 스토캐스틱(Dual Stochastic)입니다. 여기서는 Fast Stochastic과 Slow Stochastic이라는 두 가지 Stochastic을 사용합니다. Fast Stochastic에는 Fast Stochastic 메인 라인과 Fast Stochastic 신호 라인이 있습니다. 마찬가지로 Slow Stochastic에는

50% Off Today Only! Price Goes Back Up at 11 PM (EST)
uGenesys Volume Indicator: Your Key to Mastering Market Volume Analysis What Traders Are Saying: "A must-have indicator...really a game-changer." – wuzzy66 "Amazing indicator...strongly recommend to beginners." – joinbehar Understanding Market Volume: Volume in the market is a critical indicator of movement and opportunity. The uGenesys Volume Indicator is specially crafted to pinpoint when the market has the most volume, allowing you to tr
UR 펄스스캘프 급변하는 시장에서 궁극적인 우위를 찾는 스캘퍼를 위한 보정된 거래 지표
UR PulseScalp 는 급변하는 시장에서 궁극적인 우위를 추구하는 스캘퍼를 위한 최첨단 거래 솔루션입니다. 이 혁신적인 지표는 Volatility, MoneyFlow 및 Relative Strength의 힘을 혼합하여 매우 정확하고 신뢰할 수 있는 신호를 생성하는 과학적으로 보정된 공식을 기반으로 합니다.
UR PulseScalp 사용의 이점:
편안한 인터랙티브 패널 M5 및 H1에서 매우 정확함 초보자를 위한 권장 EURUSD 쌍 설정 없음 모든 종류의 자산에 맞게 조정됨 모든 파도를 잡을 수는 없습니다. 그게 바로 아름다움입니다. 기다려야 하는 경우에도 최고의 항목을 분석합니다. 도구 업데이트를 최신 상태로 유지하고 빠진 것이 있다고 생각되면 요청을 보낼 수 있는 특별한 텔레그램 채팅이 있습니다!
왜 UR PulseScalp 인가?
당신이 노련한 스캘퍼이든 막 시작하든 "U

MACD (short for M oving A verage C onvergence/ D ivergence) is a popular trading indicator used in technical analysis of securities prices. It is designed to identify changes in the strength, direction, momentum, and duration of a trend in a security's price.
History Gerald Appel created the MACD line in the late 1970s. Thomas Aspray added the histogram feature to Appel's MACD in 1986.
The three major components and their formula 1. The MACD line: First, "PM Colored MACD" employs two Moving

Signal trend indicator for scalping. Has three different sensitivity options
It detects a trend change and gives signals to open positions.
Has built-in audio and visual trend change alerts. Can send notifications to your phone or email. Allows you to open positions in a timely manner in accordance with the direction of the market. Works on all timeframes, on all currency pairs, metals, indices and cryptocurrencies. Can be used when working with binary options. Distinctive features Does not

MACD Color for GOLD Use for looking moving-way of graph and checking will be buy or sell Easy for looking by see the color of trand. Red is down / Blue is up. Can to use it with every time-frame by 1. Long Trade : Use it with time-frame H1 / H4 / Daily 2.Short Trade : Use it with time-frame M5 / M15 / M 30 / H1 and you can see when you will open or close the orders by see this indicator by well by see signal line cut with color line again in opposite. and you can use this indicator for
RumahForexID Momentum Scalping Indicator is the best momentum indicator ever created, and why is that? The indicator works on all timeframes and assets, the indicator is made after 6 years of experience in forex. You know many momentum indicators on the internet are unhelpful, and difficult to trade, but RumahForexID Momentum Scalping Indicator is different , The indicator shows wave momentum, when the market is about to trend or consolidate, all that in one simple and clear indicator!
RumahFo
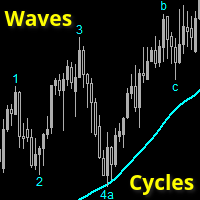
Wave and Cycle counter to give an immediate indication how far the ongoing trend has progressed.
Low numbers: trend has just started, ride the trend. Higher numbers: trend is 'older', watch for reversals
This indicator is 100% compatible with the fantastic TopDog trading strategy.
(I will NOT give any details about this Top Dog strategy)
The trend direction is determined by a SMA value (or any other MA) you can set.
Waves and cycles numbers and letters are derived from a SlowStoch setting.
Wave
OB Breakout is alert indicator that identifies when a trend or price move is approaching exhaustion(Supply and Demand) and ready to reverse. It alerts you to changes in market movement which typically occur when a reversal or major pullbacks are about to or have happened. The indicator identifies breakouts and price momentum initially, every time a new high or low is formed near a possible Supply or Demand level point. The indicator draws in a rectangle on Supply or Demand Zones. Once price we

Key Level Key Level is a MetaTrader 4 Indicator that uses a proprietary algorithm based on Price Retracement/Breakout Method to show the Entry-Line on your trading.
Instead, it analyzes data of market and identify entry points and opportunities. (Price Retracement / Price Breakout)
It's also a trading tool that be used to practice and enhance your manual trading skills.
Key Level is an amazing tool for Scalping Trader. It also a trading tool that be used to practice and enhance your manual trad

Momentum Breakout Finder (MoBlast) is an indicator based on Volume to find the when the current pair is making breakout and when market are range bound. Oscillators Indicators like RSI, MACD that works fine for an interval of the market, it fails to generate profitable signals when the market conditions change, and hence it produces wrong signals resulting in big losses. This indicator implements an volume logic algorithm that finds the best breakout of the symbol. When an arrow signal appears
Современный индикатор паттерна Ключевой разворот. Имеет настройки таймфрейма. Можно настроить количество баров для отображения индикатора на графике. Индикатор предпочтительно использовать на часовом таймфрейме и выше, но работает и ниже. Подходит для использования с любой стратегией. Условие отображения: какой таймфрейм указали в настройках, галочку во вкладке отображение ставим там же. Для фильтра можно использовать скользящую среднюю.
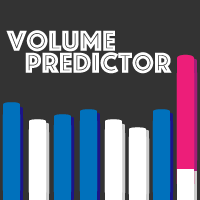
Volume predictor is an essential indicator if you trade with volumes, this indicator predicts the final volume of the current candle and increases it's precision as the time goes by. In order to predict the final volume the current volume and market conditions are used, the predicted volume adjust in real time. You can change every individual color of the indicator to your liking, the default colors were assigned to be easy on your eyes while using a dark theme. Don't forget to leave your revie

"BUYUK SAVDOGAR" TM has developed this strategy to support all who trade binary options.
This trading system determines the state of imbalance in the market based on volume analysis. The most convenient point for opening a trade is an imbalance situation. The trading system independently allocates an imbalance zone. Issues a warning (alert) in the desired direction.
The terms of trade are very simple. We are waiting for directions. We open a deal on the current timeframe in the direction.
It
Современный индикатор паттернов PinBar по торговой стратегии RAIT. Работает по тренду и без него. Имеет настройки таймфрейма для отображения. Можно настроить количество баров для отображения индикатора на графике. Используется несколько паттернов PinBar. Индикатор предпочтительно использовать на часовом таймфрейме и выше, но работает и ниже . Паттерны: PinBar, InsPinBar, PinInside. Отображаются одной стрелкой.
This Harmony Cross Signal indicator is designed for signal trading. This indicator generates trend signals.
It uses many algorithms and indicators to generate this signal. It tries to generate a signal from the points with the highest trend potential.
This indicator is a complete trading product. This indicator does not need any additional indicators.
The indicator certainly does not repaint. The point at which the signal is given does not change.
Features and Suggestions Time F

PURCHASE THIS INDICATOR AND GET OUR SECRET BONUS! Why is TREND Important? This is one of the biggest questions asked by beginner traders. Trend is important because that is primarily when the market moves the most. When a market has good volume, many banks, hedgefunds and large institutions are participating and driving price up or down in strong trends. THIS IS THE PERFECT TIME TO TRADE. The uGenesys Multi-Trend Indicator was specifically designed to identify when a trend has started in the ma

The RSI and Moving Average Indicator is a powerful tool for any trader looking to take their technical analysis to the next level. With the RSI as the main indicator, you will have access to a clear and accurate representation of the strength of the current market trend. The addition of the moving average line adds another level of insight, providing a smoothed view of the RSI that helps to identify longer-term trends and potential buying or selling opportunities. Whether you are a day trader, s

Achieving Goal is a trend indicator for the MetaTrader 4 trading platform. This indicator allows you to find the most likely trend reversal points. You will no longer find a copyright indicator like this. A simple but effective system for determining the forex trend. From the screenshots you can see for yourself the accuracy of this tool. It works on all currency pairs, stocks, raw materials, cryptocurrencies.
Are you tired of the constant ups and downs? It is not worth becoming a victim of un
MetaTrader 마켓은 MetaTrader 플랫폼용 애플리케이션을 구입할 수 있는 편리하고 안전한 환경을 제공합니다. Strategy Tester의 테스트를 위해 터미널에서 Expert Advisor 및 인디케이터의 무료 데모 버전을 다운로드하십시오.
MQL5.community 결제 시스템을 이용해 성능을 모니터링하고 원하는 제품에 대해 결제할 수 있도록 다양한 모드로 애플리케이션을 테스트할 수 있습니다.
