거래 로봇을 무료로 다운로드 하는 법을 시청해보세요
당사를 Facebook에서 찾아주십시오!
당사 팬 페이지에 가입하십시오
당사 팬 페이지에 가입하십시오
스크립트가 마음에 드시나요? MetaTrader 5 터미널에서 시도해보십시오
- 조회수:
- 49306
- 평가:
- 게시됨:
- 업데이트됨:
-
이 코드를 기반으로 한 로봇이나 지표가 필요하신가요? 프리랜스로 주문하세요 프리랜스로 이동
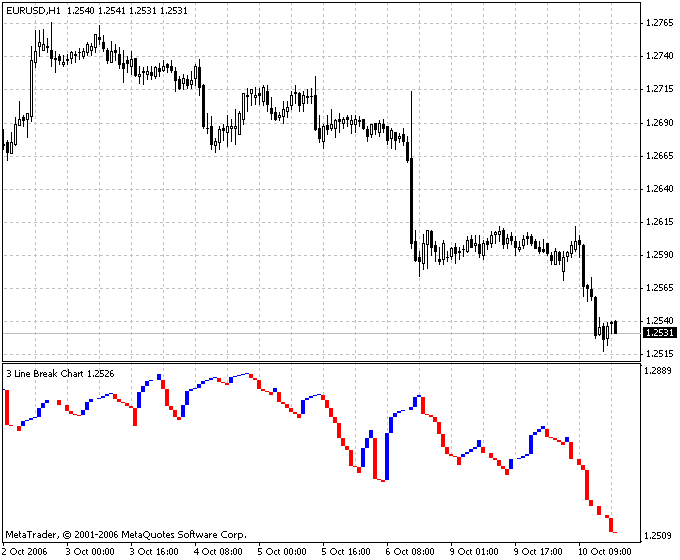
Three-line break charts represent a raw of vertical rectangle, the height of which is determined by the value of price changes. These charts - like Kagi, P&F, Renko - do not consider time factor. This graphical method is named after the number of lines usually used to register a break.
Three-line break charts were first brought to the United States by Steven Nison when he published his book, Beyond Candlesticks.
Basic rules of trading using a three-line break chart are given below:
- Buy when after three consecutive red lines, a blue line appears ("the blue reversal line").
- Sell when after three consecutive blue lines, a red line appears ("the red reversal line").
- Do not trade when there is no stable trend, i.e. when blue and red lines alternate.
Advantage of three-line break charts is no reversal criterion set at random. The price dynamics itself denotes the reversal. A disadvantage of such charts can be the appearance of reversal signals after the new trend has been formed. But many traders are ready to have patience and enter the market later in exchange for an opportunity to cover the main part of a large trend.
The reversal signals sensitivity can be varied by changing the amount of lines used to register the break. Thus, traders who practise short-term operations can use a two-line break, which gives more reversal signals. For investors who are interested in long-term outlook, four-line or even ten-ine breaks can be more preferable since they decrease the amount of signals.In Japan, the three-line break is the most commonly used.
S. Nison recommends to use three-line break charts together with candlesticks. Doing so, one is supposed to detect the direction of the main trend using the former method and determine specific points of entrance and quitting the market.
Parameters
LB - count of break lines

 Renko Charts
The Renko charting method is thought to have acquired its name from "renga" which is the Japanese word for bricks.
 Kagi Charts
The Kagi Charts illustrate how demand-and-supply forces act.
 Market Profile
The Market Profile uses alternative presentation of information about both horizontal and vertical market moves.
 PerkyAsctrend1
Indicator PerkyAsctrend1, as well as all other ASCTrend indicators is based on Laryy williams' oscillator %R, or WPR (Williams’ Percent Range).