거래 로봇을 무료로 다운로드 하는 법을 시청해보세요
당사를 Facebook에서 찾아주십시오!
당사 팬 페이지에 가입하십시오
당사 팬 페이지에 가입하십시오
스크립트가 마음에 드시나요? MetaTrader 5 터미널에서 시도해보십시오
- 조회수:
- 104935
- 평가:
- 게시됨:
- 업데이트됨:
-
이 코드를 기반으로 한 로봇이나 지표가 필요하신가요? 프리랜스로 주문하세요 프리랜스로 이동
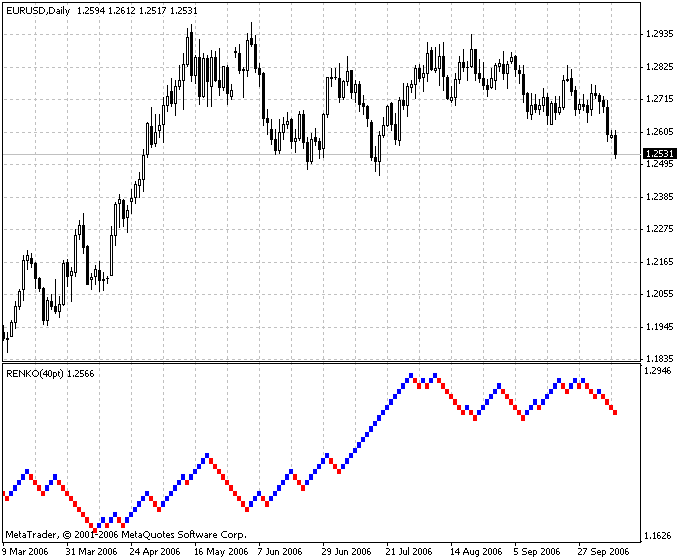
The Renko charting method is thought to have acquired its name from "renga" which is the Japanese word for bricks. Renko charts are similar to Three Line Break charts except that in a Renko chart, a line (or "brick" as they're called) is drawn in the direction of the prior move only if prices move by a minimum amount (i.e., the box size). The bricks are always equal in size. For example, in a 5-unit Renko chart, a 20-point rally is displayed as four, 5-unit tall Renko bricks.
Renko charts were first brought to the United States by Steven Nison when he published his book, Beyond Candlesticks.
Basic trend reversals are signaled with the emergence of a new red or blue brick. A new blue brick indicates the beginning of a new up-trend. A new red brick indicates the beginning of a new down-trend. Since the Renko chart is a trend following technique, there are times when Renko charts produce whipsaws, giving signals near the end of short-lived trends. However, the expectation with a trend following technique is that it allows you to ride the major portion of significant trends.
Since a Renko chart isolates the underlying price trend by filtering out the minor price changes, Renko charts can also be very helpful when determining support and resistance levels.
Parameters
Porog - box size

 Kagi Charts
The Kagi Charts illustrate how demand-and-supply forces act.
 CloseOnChart
Quickly close open orders by dragging and dropping this expert on chart. Will ask for confirmation to close each order within 2 pips of the drop.
 Three Line Break
Three Line Break - a raw of vertical rectangle, the height of which is determined by the value of price changes.
 Market Profile
The Market Profile uses alternative presentation of information about both horizontal and vertical market moves.