당사 팬 페이지에 가입하십시오
Grid indicator. Final version. Improved according to suggestions.
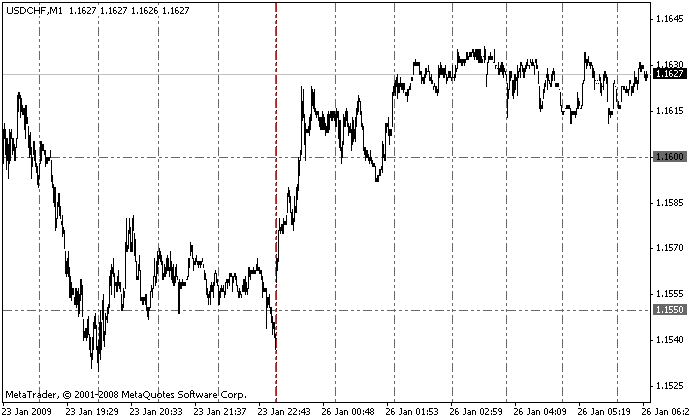
Increased the operation speed, correctly processes the missing bars. If the distance between the vertical lines is noticeably smaller, then the history is missing bars there.
The idea is to replace the standard grid with a more convenient one for visual work.
Recommended for visual work. Applications are numerous. Up to the creation of trading systems, as it allows to see certain regularities of the price behavior.
The vertical line correspond to the start of an hour. Some have different colors.
start of the week - red line,
start of the day - blue line,
start of the month - yellow vertical line.
Horizontal line - placed on psychological (round) levels, like 1.3700, 13750, etc.
blue - shape line
gray - intermediate levels

Optimized the code. Fixed the operation flaws. Introduced improvements by popular demand. The code contains detailed comments.
MetaQuotes Ltd에서 러시아어로 번역함.
원본 코드: https://www.mql5.com/ru/code/8684
 Spazm
Spazm
works on the movement continuation with position inversion after closure
 The Cronex T Demarker GFC (Color) indicator
Modification of the DeMarker indicator with additional color indication based on the histogram
 Ma_Parabolic_st2
Parabolic plotted based on Lows and Highs of a moving average. Efficiently displays the trends on smaller timeframes, and allows to mostly eliminate frequent switches, inherent to the "Parabolic SAR" indicator.
 Trading signals function.
Based on the values of the OsMA indicator.