 MetaTrader 5
 Experts
 지표
 스크립트
 라이브러리
 보관함
거래 로봇을 무료로 다운로드 하는 법을 시청해보세요
당사를 Facebook에서 찾아주십시오!
당사 팬 페이지에 가입하십시오
당사 팬 페이지에 가입하십시오
스크립트가 마음에 드시나요? MetaTrader 5 터미널에서 시도해보십시오

Gold Trend Breakout Lite — educational XAUUSD trend-following EA - MetaTrader 5용 expert

- 조회수:
- 100
- 게시됨:
-
 이 코드를 기반으로 한 로봇이나 지표가 필요하신가요? 프리랜스로 주문하세요
프리랜스로 이동

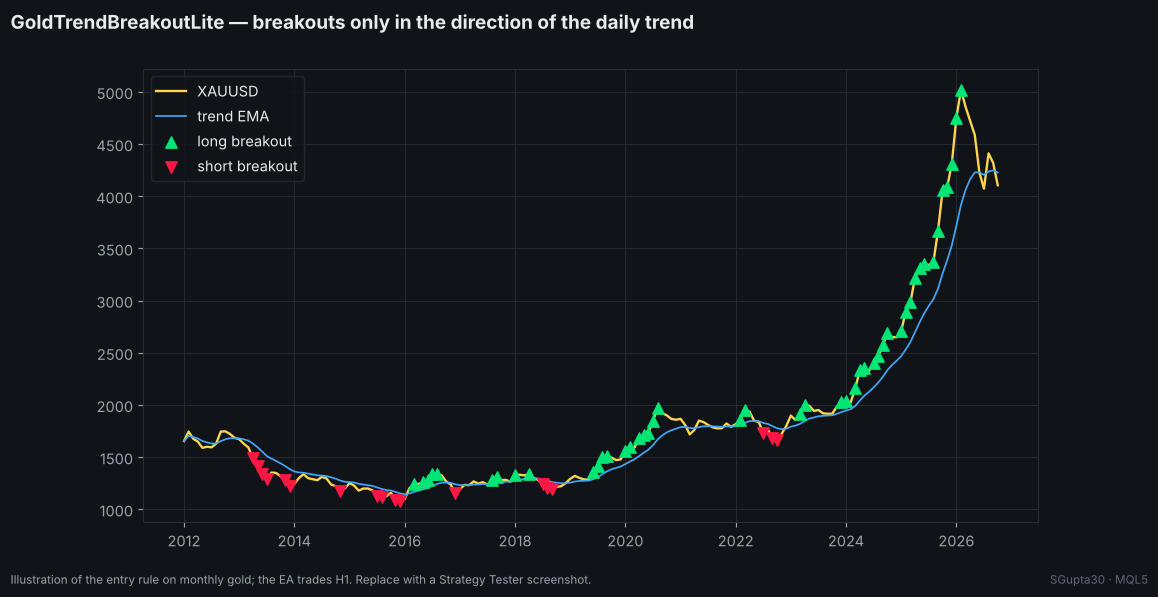
Strategy
| Element | Rule |
|---|---|
| Trend | D1 EMA(100) rising over the last 3 completed days → longs only; falling → shorts only |
| Entry | H1 close above the highest high of the previous 120 bars (long), or below the lowest low (short) |
| Stop | 3 × ATR(14) H1, sent with the order |
| Management | When an H1 bar closes at +1R, the stop moves to entry + 0.1R |
| Exit | Stop (initial or break-even). No take-profit: winners run |
| Size | Fixed lot, default 0.01 |
Flow
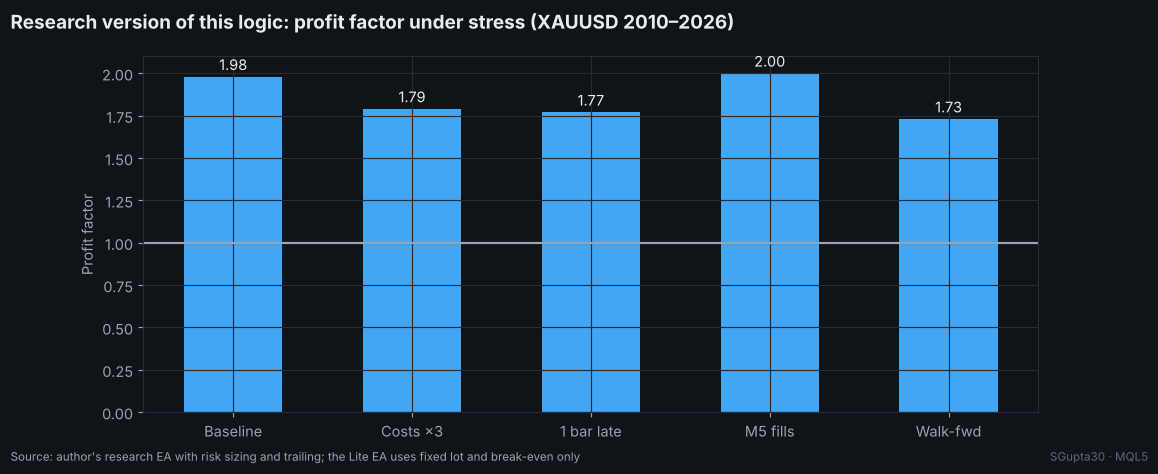
The EA makes one decision per closed H1 bar. With no position open, it checks the trend and the breakout. With a position open, it only checks break-even. Every order passes a hygiene gate: trade permissions, volume step and limits, stops level, free margin, and a 60-second cooldown after a failed order.
void OnTick()
  {
   datetime b=iTime(_Symbol,TF,0);
   if(b==0 || b==g_last_bar) return;   // once per closed H1 bar
   g_last_bar=b;
   ulong tk;
   if(MyPosition(tk)) ManageBE(tk);    // break-even only
   else               TryEntry();      // trend + Donchian breakout
  }
Background
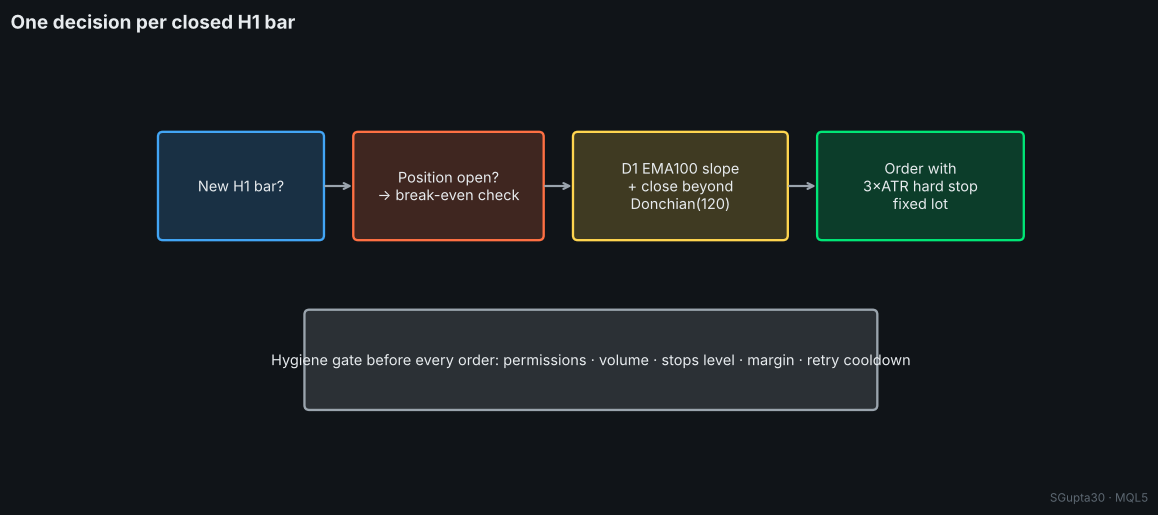
The logic follows the author's XAUUSD research. A research version with risk-based sizing and a trailing stop stayed profitable under triple costs, a one-bar-late entry, M5 fill checks and yearly walk-forward re-optimisation (2010–2026). This Lite version deliberately leaves out risk sizing, trailing and extra engines so the core idea is easy to read and modify.
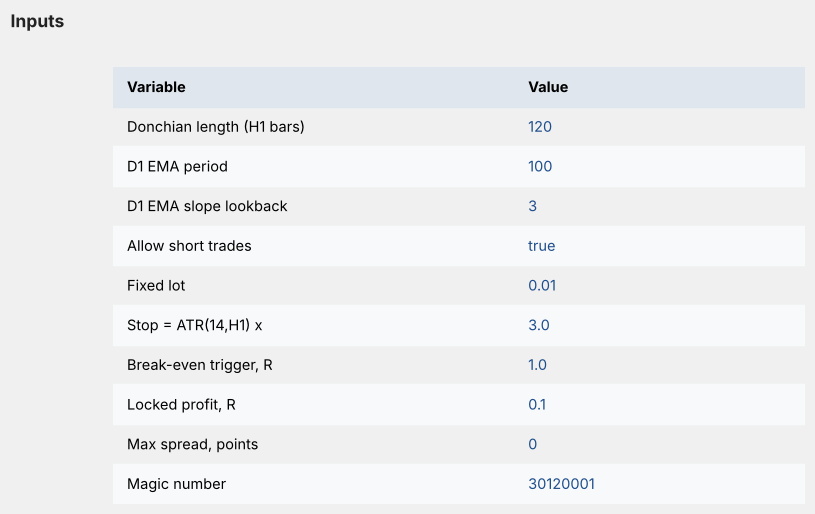
Inputs
Testing
- Symbol XAUUSD, any chart timeframe (the EA uses H1 internally). Model "Every tick based on real ticks" or "1 minute OHLC".
- Test from 2012 or earlier, so the 2013–2015 bear market is included.
- Expect a 30–40% win rate with a few large winners. That is normal for trend following.
- OnTester() returns net profit / relative balance drawdown for optimisation.
Disclaimer
Educational code. Trading leveraged gold carries a high level of risk, and past performance does not guarantee future results. Test on a demo account first.
Author: Shipra Gupta (SGupta30) · fully featured gold EAs (multi-engine, risk profiles, drawdown governor) are in the author's Market profile.
 Risk Lot Panel — drag the stop line, read the lot size for your risk percentage
On-chart position-size calculator. Drag the stop line (and optional target line) and the panel shows lots for your risk %, money at risk and reward:risk. Uses OrderCalcProfit, so it is correct for gold, indices, crypto, FX and any account currency.
Volatility Squeeze Scanner — Bollinger inside Keltner, with momentum histogram
Shows when volatility is compressed (Bollinger Bands inside the Keltner Channel) and which way it releases. Red dots = squeeze on, green = released, four-colour momentum histogram. Wilder ATR, closed bars, no repaint.
Hull Moving Average with Slope Color Change
Hull Moving Average that changes color with its slope: one color while the line rises, another while it falls, a neutral one when it is flat, with optional arrows at the turns.
Kaufman Adaptive Moving Average (KAMA) Ribbon
A ribbon of Kaufman Adaptive Moving Averages with growing Efficiency Ratio periods, drawn in a monochrome gradient, with an on-chart label showing whether the ribbon is bullish, bearish or mixed.