 MetaTrader 5
 Experts
 지표
 스크립트
 라이브러리
 보관함
거래 로봇을 무료로 다운로드 하는 법을 시청해보세요
당사를 Telegram에서 찾아주십시오!
당사 팬 페이지에 가입하십시오
당사 팬 페이지에 가입하십시오
스크립트가 마음에 드시나요? MetaTrader 5 터미널에서 시도해보십시오

Risk Lot Panel — drag the stop line, read the lot size for your risk percentage - MetaTrader 5용 지표

- 조회수:
- 69
- 게시됨:
- 업데이트됨:
-
 이 코드를 기반으로 한 로봇이나 지표가 필요하신가요? 프리랜스로 주문하세요
프리랜스로 이동

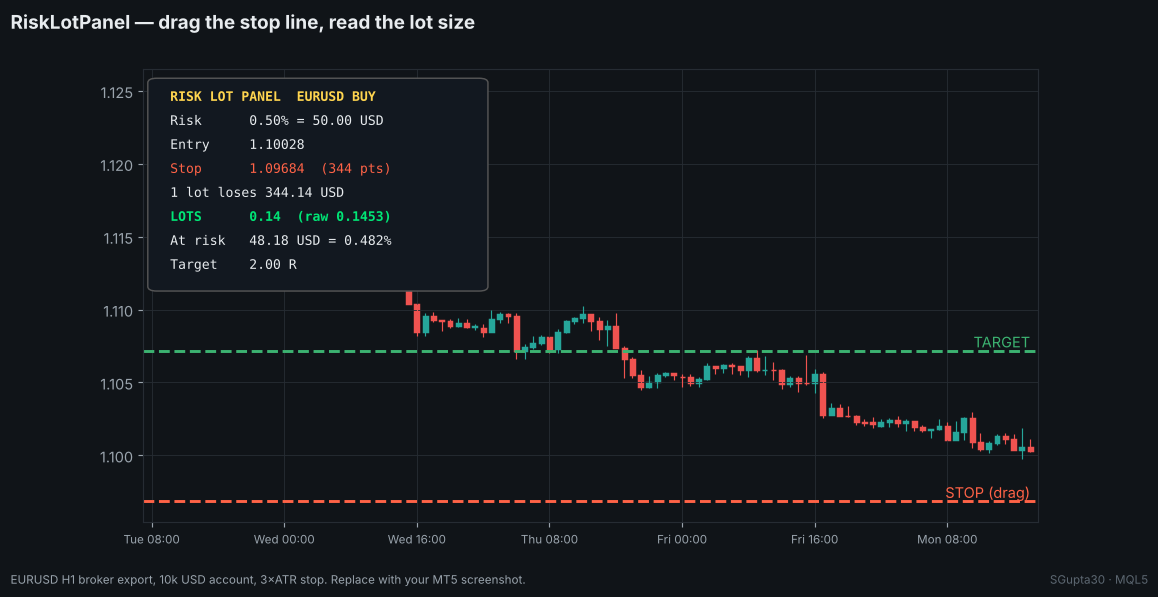
How to use
- Attach the indicator. A red STOP line appears 3 × ATR below the price and a green TARGET line at 2 R.
- Drag the STOP line to where your stop belongs. Put it above the price for a sell.
- Read LOTS in the panel and enter that size in your order.
The panel updates every second and immediately when a line is dragged.
| Panel row | Meaning |
|---|---|
| Risk | Risk % and the money it represents |
| Entry | Ask for a buy, bid for a sell |
| Stop | Stop price and distance in points |
| 1 lot loses | Money lost by 1.00 lot between entry and stop |
| LOTS | Size rounded down to the volume step (raw value in brackets) |
| At risk | Money actually at risk at that size |
| Target | Reward:risk of the target line |
Why it is correct on gold
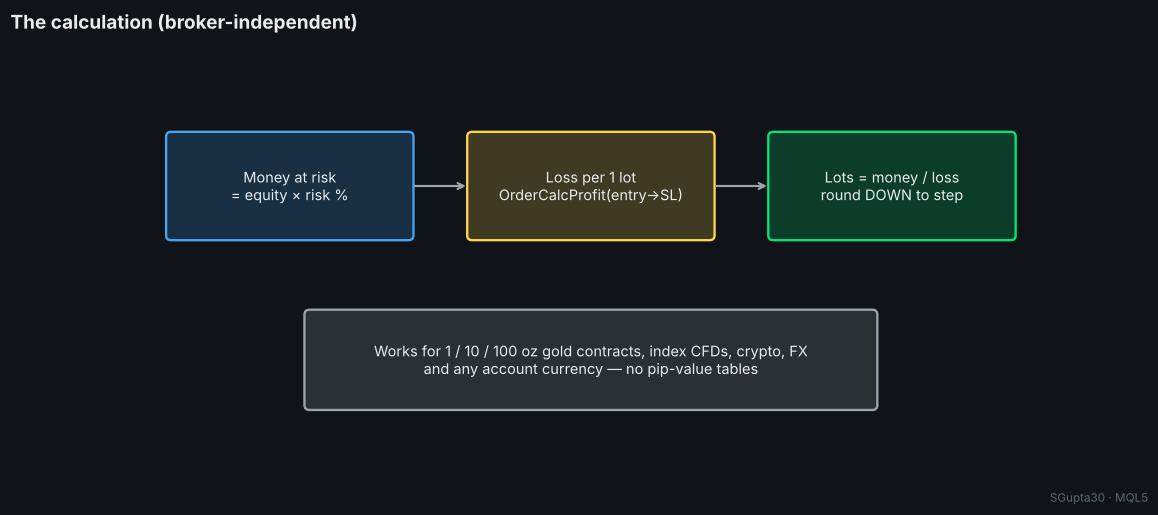
Pip-value formulas break on gold and CFDs: contract sizes differ between brokers (100 oz, 10 oz, 1 oz), profit currencies differ, and the account may be in EUR, GBP or INR. The panel asks the terminal with OrderCalcProfit() how much 1 lot loses between entry and stop, using the broker's own contract specification.
double LossPerLot(const ENUM_ORDER_TYPE t,const double entry,const double sl)
  {
   double p=0.0;
   if(!OrderCalcProfit(t,_Symbol,1.0,entry,sl,p)) return(0.0);
   return(MathAbs(p));
  }
// lots = equity * risk% / 100 / LossPerLot(...), rounded down to SYMBOL_VOLUME_STEP
Stop distance and size
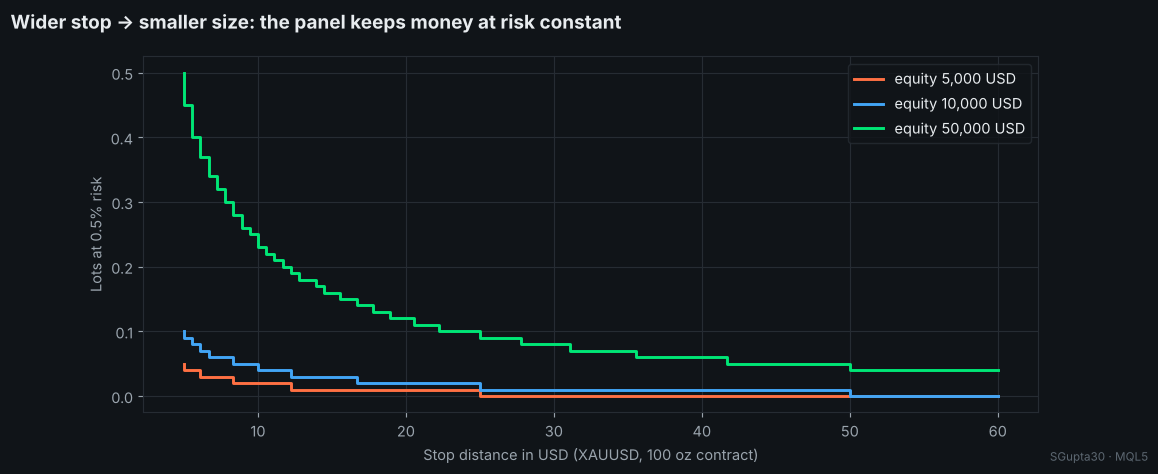
A wider stop gives a smaller size; the money at risk stays the same. If the minimum lot would already risk more than your budget, the panel shows 0.00 in red: the stop is too wide for that account size.
Inputs
| Input | Default | Description |
|---|---|---|
| Risk per trade, % | 0.50 | Risk per trade |
| Risk base | Equity | Equity or balance |
| Initial stop, ATR × | 3.0 | Where the stop line first appears |
| ATR timeframe | H1 | ATR timeframe |
| Show target line | true | Reward:risk line |
| Initial target, R | 2.0 | Where the target line first appears |
| Panel X / Y, colours | — | Layout |
Author: Shipra Gupta (SGupta30) · the author's Market EAs size every trade this way, with a hard stop on every position.
Volatility Squeeze Scanner — Bollinger inside Keltner, with momentum histogram
Shows when volatility is compressed (Bollinger Bands inside the Keltner Channel) and which way it releases. Red dots = squeeze on, green = released, four-colour momentum histogram. Wilder ATR, closed bars, no repaint.
Gold Donchian Breakout Channel (non-repainting, with HTF trend filter)
Donchian channel of the N bars before each bar, midline and confirmed breakout arrows that never repaint. Optional D1 EMA-slope filter shows only breakouts in the higher-timeframe trend. Alerts and push. Any symbol.
 Gold Trend Breakout Lite — educational XAUUSD trend-following EA
Open-source gold EA built on XAUUSD's multi-day trend persistence: H1 Donchian breakout in the direction of the D1 EMA slope, 3×ATR hard stop, break-even at +1R. Fixed lot, one position, no grid, no martingale.
Hull Moving Average with Slope Color Change
Hull Moving Average that changes color with its slope: one color while the line rises, another while it falls, a neutral one when it is flat, with optional arrows at the turns.