 MetaTrader 5
 Experts
 지표
지표
 스크립트
스크립트
 라이브러리
라이브러리
 보관함
보관함
당사 팬 페이지에 가입하십시오

Arixis Backtest Robustness Analyzer - MetaTrader 5용 지표

I develop advanced tools for MetaTrader 5 focused on trading analytics, risk monitoring, execution analysis, and algorithmic trading.
- 조회수:
- 21
- 게시됨:
-
 이 코드를 기반으로 한 로봇이나 지표가 필요하신가요? 프리랜스로 주문하세요
프리랜스로 이동
이 코드를 기반으로 한 로봇이나 지표가 필요하신가요? 프리랜스로 주문하세요
프리랜스로 이동

Arixis Backtest Robustness Analyzer
Arixis Backtest Robustness Analyzer is a free and open-source analytical utility for MetaTrader 5 designed to examine historical trading performance beyond headline statistics such as Profit Factor, net profit and win rate.
The analyzer works with closed trading history and provides additional information about how historical results were produced.
Main features
- Net result, gross profit and gross loss
- Profit Factor and win rate
- Average and median trade
- Best/worst trade analysis
- Top 1, 3, 5 and 10 trade dependency
- Historical sensitivity after removing extreme trades
- Winning and losing streak analysis
- Reconstructed closed-equity drawdown
- Underwater periods and recovery information
- Performance by year, month, weekday and hour
- Separate BUY and SELL statistics
- Trade-result percentiles and standard deviation
- Sample-size information
- Optional CSV export
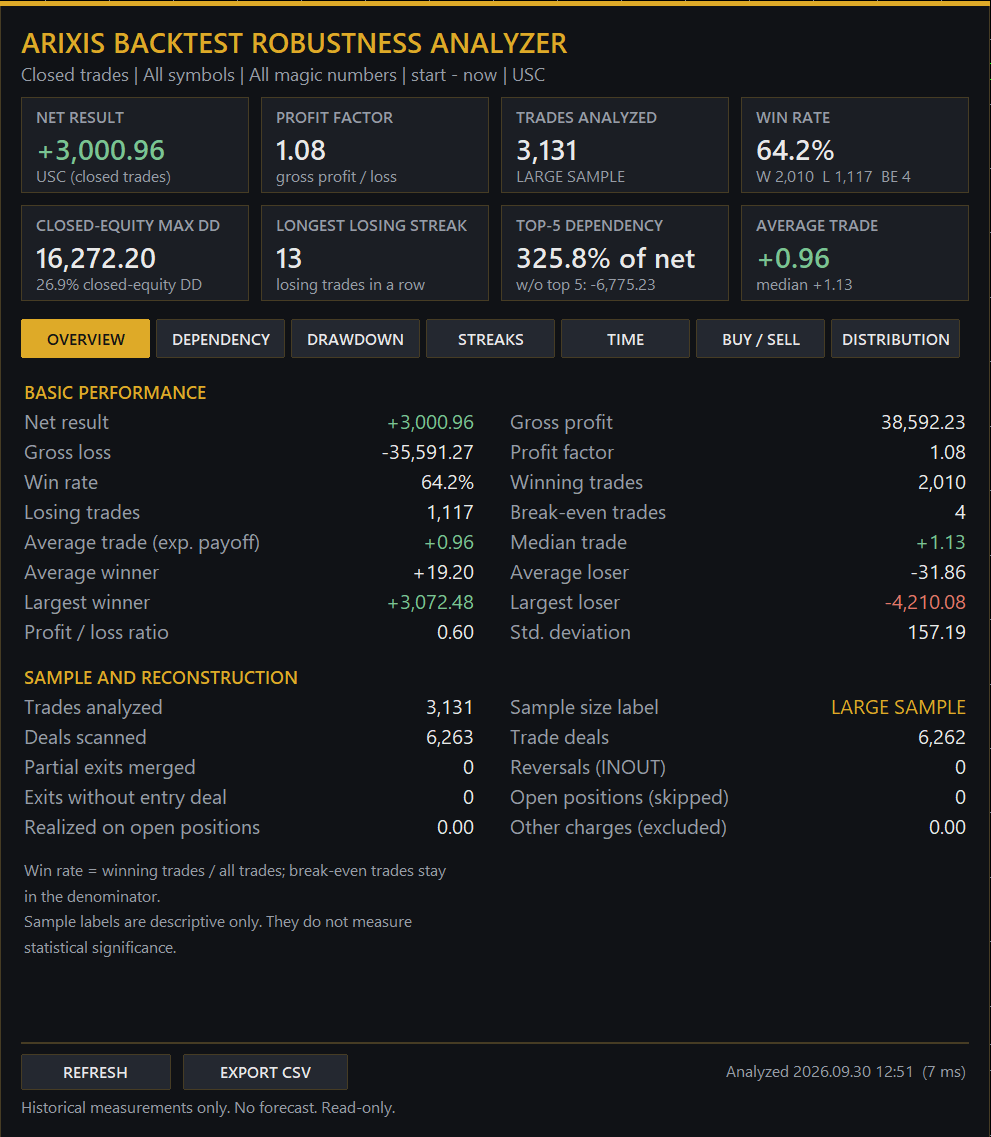
Profit Dependency
The Dependency section recalculates the historical result after removing the strongest observations. This can help reveal whether historical performance was broadly distributed or concentrated in a small number of trades.
If total net profit is zero or negative, dependency percentages are displayed as N/A because expressing the strongest trades as a percentage of net profit could be misleading. The analyzer still displays the resulting net value after those trades are removed.
Historical Sensitivity
The analyzer also performs the inverse experiment by removing the worst historical trades and periods.
This does not modify the original trading history and should not be interpreted as an improved backtest. It is simply a sensitivity analysis showing how extreme observations influenced the historical result.
Drawdown
The utility reconstructs a closed-equity curve from completed historical trades and analyzes drawdown depth, underwater periods and recovery.
Closed-equity drawdown is not the same as intratrade floating-equity drawdown. Floating losses that occurred while positions were still open cannot necessarily be reconstructed from completed trading history alone.
Time Analysis
Historical performance can be examined by year, month, weekday and hour. The number of observations is displayed together with the statistics so that small samples remain visible.
BUY / SELL Analysis
BUY and SELL operations are displayed separately without automatically ranking either direction.
Distribution
The analyzer displays the mean, median, standard deviation and several percentiles of historical trade results.
Filters
The utility supports date-range, symbol and Magic Number filtering.
Read-only operation
Arixis Backtest Robustness Analyzer is completely read-only. It does not open, close or modify trades and does not interfere with other Expert Advisors.
Important
All measurements describe historical observations only. They do not predict future profitability and should not be interpreted as future risk limits.
The complete MQL5 source code is provided for educational and research purposes.
ATS Liquidity City - liquidity pools and sweeps, drawn as a neon city
Shows where stops are likely resting and which ones were just taken. Liquidity pools = confirmed swing highs and lows that price has not traded through yet, equal highs/lows (a bigger pool) and yesterday's high and low. When a bar trades beyond a pool it is marked as swept, and as "grabbed & rejected" if the same bar closes back inside. Non-repainting: a swing is used only after N closed bars on each side. The panel is a neon city drawn on a CCanvas: the price is a flying car, sell stops are towers below it, buy stops floating platforms above it, yesterday's levels golden billboards, a searchlight sweeps the sky and a ticker runs today's catch. Two buffers give the nearest active pool above and below for use in an Expert Advisor. Indicator only: it never trades.
 Repaint Inspector
Measures whether an indicator repaints instead of trusting the claim. It re-reads the buffers of any custom indicator on bars that have already closed and counts every value that changes, appears or disappears, with the furthest shift back at which that still happens. Verdict per buffer on a chart panel, every event written to CSV.
Mirror Hedge EA (Same terminal and account only)
Mirrors trades opened, modified, and closed by another EA on the same hedging account, selected by magic number. By default it inverts direction (Buy↔Sell, SL↔TP), so you can forward-test the reverse of a strategy with real spreads, slippage, and execution.
MACD Signals
Indicator edition for new platform.