 MetaTrader 5
 Experts
 지표
 스크립트
 라이브러리
 보관함
당사 팬 페이지에 가입하십시오

Risk Lot Panel - MetaTrader 5용 지표

- 조회수:
- 115
- 평가:
- 게시됨:
-
 이 코드를 기반으로 한 로봇이나 지표가 필요하신가요? 프리랜스로 주문하세요
프리랜스로 이동


A display-only panel that answers one question before you place a trade: what lot size does my risk allow here, and what does the broker's volume step do to it?
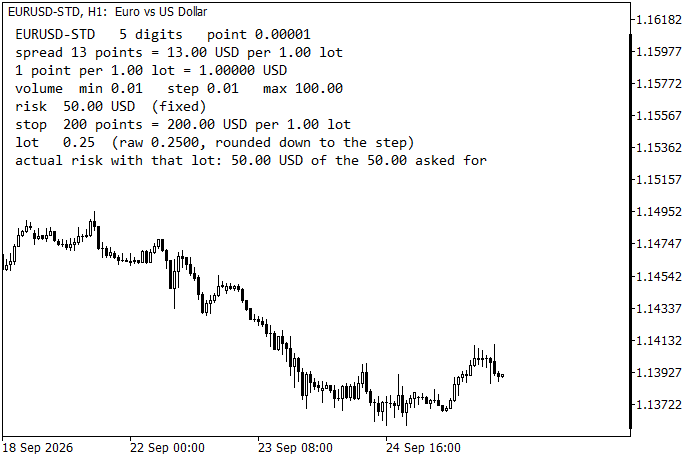
For the current symbol the panel shows:
- the spread in points, and what that spread costs per 1.00 lot;
- the money value of one point per 1.00 lot, taken from the broker's tick value and tick size, so the figure is right on gold, indices and cross-rate pairs, not only on EURUSD;
- the broker's volume constraints: minimum, step and maximum;
- your risk budget: percent of balance, percent of equity, or a fixed amount in the account currency;
- the loss per 1.00 lot at the stop distance you set;
- the resulting lot — the raw figure, then the lot after rounding DOWN to the volume step, and the money you actually risk with that rounded lot;
Two situations the panel is really written for:
1. The raw lot comes out below the broker minimum. Rounding up to the minimum silently breaks the risk cap, which is how a "1% risk" trade quietly becomes a 4% one on a small account. The panel says the risk cannot be respected and shows what the minimum lot would actually risk, in money and in percent of balance.
2. Rounding down to the volume step moves the real risk away from the number you asked for. The panel prints the actual risk next to the requested one, and highlights the line when the gap is larger than 10%.
The indicator never places, modifies or closes an order. It only reads symbol and account information and draws labels on the chart.
Inputs: risk mode (percent of balance / percent of equity / fixed money), risk value, stop distance in points, and the panel's corner, offsets, font and colours.
Tested on MetaTrader 5 build 6182, compiles with 0 errors and 0 warnings.
 BacktestOverfitting: probability of backtest overfitting (PBO) of an optimization
Probability of Backtest Overfitting (PBO) of an MT5 optimization by combinatorially symmetric cross-validation. Every pass sends its daily results as a frame, and the PBO is computed when the optimization ends.
DrawdownBootstrap: Monte Carlo of the maximal drawdown
Block bootstrap of daily results: how deep the drawdown of an account or strategy can get over the next months, with percentiles and a seeded generator for repeatable runs.
ICT Model Tracker - Sweep, MSS and FVG Setups with Honest Statistics
Detects the ICT model on closed bars (killzone liquidity sweep, MSS with displacement or inverted FVG, retrace entry with SL and TP) and follows every setup to its result with worst-case statistics. It never trades and never repaints; EA-ready buffers.
Extreme Price Filter
An indicator to reveal the the time candles breached an extreme price boundary