거래 로봇을 무료로 다운로드 하는 법을 시청해보세요
당사를 Telegram에서 찾아주십시오!
당사 팬 페이지에 가입하십시오
당사 팬 페이지에 가입하십시오
스크립트가 마음에 드시나요? MetaTrader 5 터미널에서 시도해보십시오
- 조회수:
- 72
- 평가:
- 게시됨:
-
이 코드를 기반으로 한 로봇이나 지표가 필요하신가요? 프리랜스로 주문하세요 프리랜스로 이동
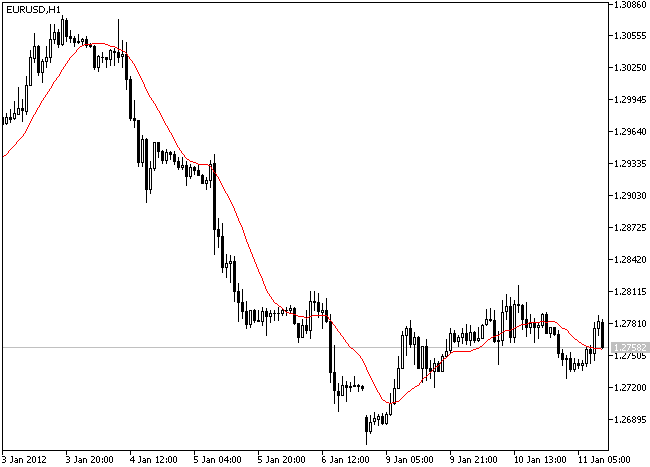
CMAOnArray 클래스는 인디케이터 버퍼로이동평균을 계산하기 위한 클래스입니다.
응용 프로그램:
매개 변수가 있는 Init () 메서드는 인디케이터의 OnInit () 함수에서 호출됩니다:
- int aMAPeriod - MA 기간.
- ENUM_MA_METHOD aMAMethod - MA 계산 방법.
인디케이터의 OnCalculate() 함수에서 매개 변수와 함께 Solve() 메서드가 호출됩니다:
- const int aRatesTotal - OnCalculate() 함수 파라미터의 rates_total 변수;
- const int aPrevCalc - OnCalculate() 함수의 매개변수에서 prev_calculated 변수;
- double aData[] - MA가 계산되는 데이터가 있는 버퍼;
- double aMA[] - 계산된 MA가 있는 버퍼.
- int BarsRequired() - 계산에 필요한 최소 막대 수를 반환합니다;
- string Name() - 인디케이터 이름이 포함된 문자열을 반환합니다;
- 문자열 NameMethod() - 사용된 스무딩 메서드의 이름이 포함된 문자열을 반환합니다.
Test_MAOnArray.mq5 파일은 CMAOnArray 클래스 사용 예제가 포함된 인디케이터입니다. IncMAOnArray 파일은 터미널 데이터 폴더의 MQL5\Include\IncOnArray 폴더에 있어야 합니다(IncOnArray 폴더를 생성해야 함).
이동평균 (MA) 보조지표는 특정 기간 동안 상품 가격의 평균값을 표시합니다. 이동평균을 계산할 때 주어진 기간 동안 상품 가격의 수학적 평균이 수행됩니다. 가격이 변동하면 평균값이 상승하거나 하락합니다.

MetaQuotes Ltd에서 러시아어로 번역함.
원본 코드: https://www.mql5.com/ru/code/623
 IncATROnArray
CATROnArray 클래스는 인디케이터 버퍼로 ATR(평균 실제 범위) 인디케이터 값을 계산하기 위한 클래스입니다.
 퀀텀 골드 실버 트레이더
양자 시스템 - 양자 상태와 확률을 사용하여 의사 결정을 내립니다.
