당사 팬 페이지에 가입하십시오

- 조회수:
- 14741
- 평가:
- 게시됨:
-
 이 코드를 기반으로 한 로봇이나 지표가 필요하신가요? 프리랜스로 주문하세요
프리랜스로 이동
이 코드를 기반으로 한 로봇이나 지표가 필요하신가요? 프리랜스로 주문하세요
프리랜스로 이동
General description :
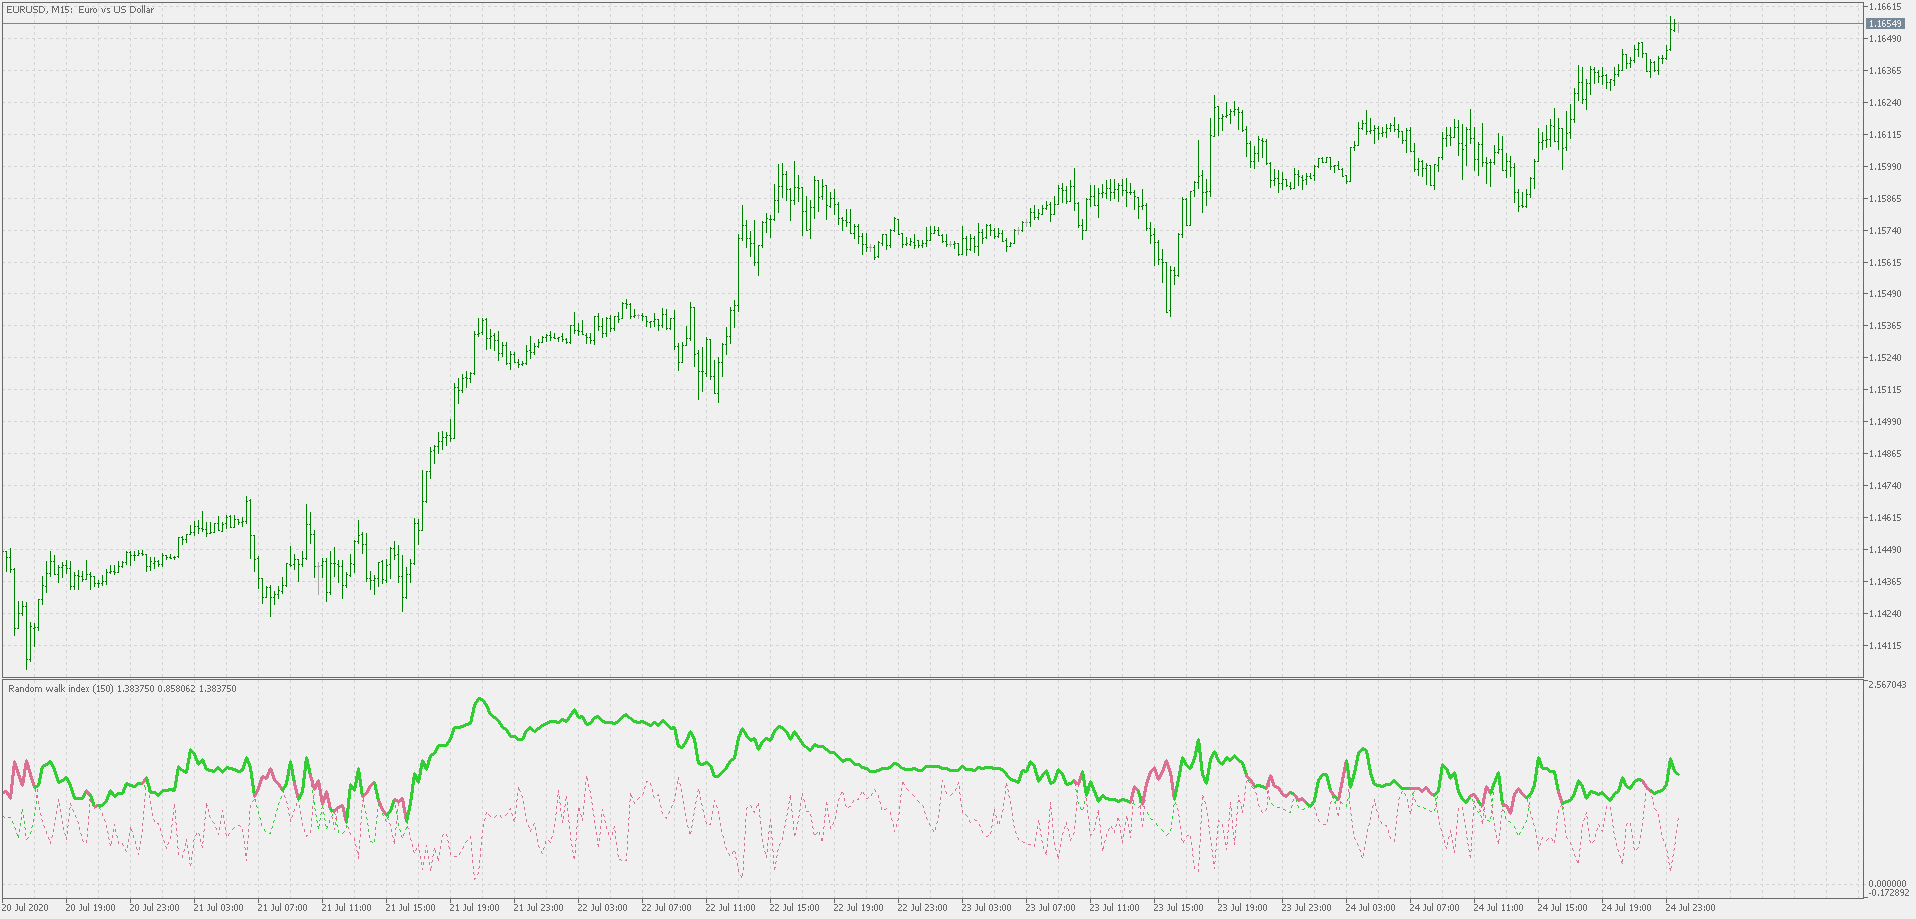
The random walk index was created by Michael Poulos in order to determine if a security's current price action is exhibiting "random walk" or is the result of a statistically significant trend, higher or lower.
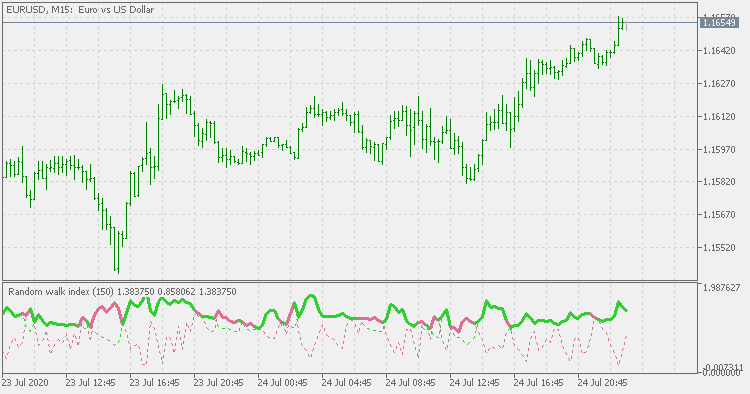
- The random walk index has two lines, a RWI High and RWI Low, which measure uptrend and downtrend strength.
- When the RWI High is above the RWI Low, it means there is more upward strength than downward strength, and vice versa.
- When either the RWI High or RWI Low is above one, it indicates a strong, non-random, trend is present. Readings below one mean movement could be random because there is not enough strength to indicate otherwise.
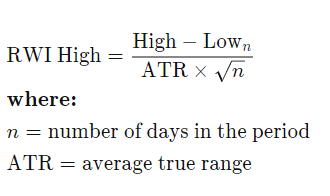
Calculation :
The calculation for high periods, or RWI High, is:
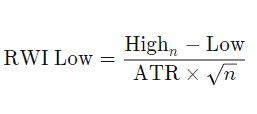
The calculation for low periods, or RWI Low, is:
Changes :
- one version was posted here Random walk index
- unlike many version of that indicator that can be found on the net (that are using some approximations that are omitting the real calculation), the first version already was calculating the RWI correctly - this one does that correctly too
- there were two issues that needed attention in original version :
- int its original form it is hard to use (RWI is a "nervous" indicator - a lot of sudden changes and then it is not easy to check what the "trend" is)
- it has a very complex calculation (loop within a loop type of calculation that can not be avoided a lot of times) - and for longer periods it is heavy on the CPU
- both issues are addressed in this version
- the interface is changed to make it (at least that is my opinion) easier to follow
- and, in a lot of cases it is significantly faster (now it becomes suitable for back-testing - average speed up in back-testing ranged, for default values, from 10 to 15 times faster, for longer periods - like the examples, the difference is much higher)
One deviation is made compared to the original which makes the values a bit different, but the significant points (crosses) are remaining at their original places
 Range Follower
this expert opens trade in the direction of the trend when specific rate of average daily range has been passed.
 Design patterns - Builder
For a complex object separate its construction from representation. Same construction process can create different representations
 Identify potential Trends/Range (Pivot Points) + Entry points
The story behind this indicator is really interesting. I've published last week a script called "Identify potential Trends/Range (Pivot Points)" and a huge number of MQL5(ers) contacted me to ask if it is possible to have it as an indicator. So I was glad that lot of people actually like my scripts and indicators so that is why I've decided to convert the script to this indicator.
Ocean theory - natural market slope
Ocean theory - natural market slope