당사 팬 페이지에 가입하십시오
- 조회수:
- 29216
- 평가:
- 게시됨:
-
이 코드를 기반으로 한 로봇이나 지표가 필요하신가요? 프리랜스로 주문하세요 프리랜스로 이동
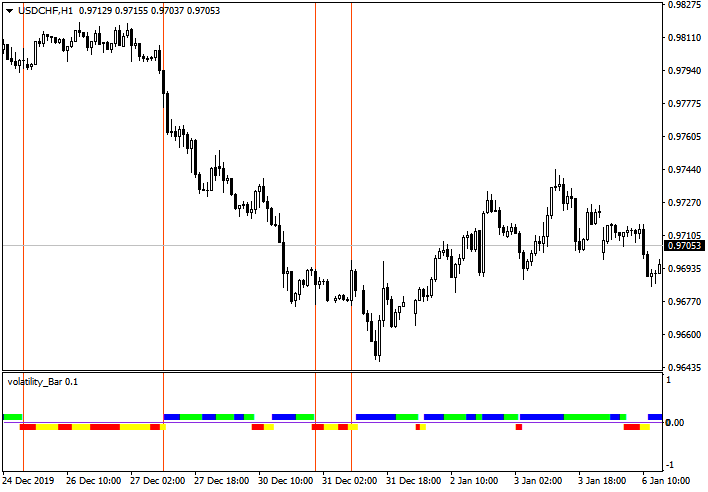
I use the indicator mainly in my advisors to divide the market into volatile and flat.
Recommended M5 timeframe.
The indicator is displayed by a straight line in a separate one under the window. The meaning of the display colors: Red - strong flat; Yellow is a weak flat; Blue - strong volatility; Green - weak volatility.
https://www.mql5.com/ru/code/27552
The indicator consists of the maximum range of the previous 5-bars divided by a coefficient with further smoothing. The indicator has a threshold level of volatility, and a coefficient that is regulated by external variables.
input int    bar   = 6;    // number of bars to calculate
input int    koef  = 50;   // candle division ratio
input double level = 0.75; // midline volatility level

 RSI + MOVING AVERAGE
this is RSI indicator that has two moving average inside the window
 Pivots MT4
Simple pivot indicator
 Safe Trend Scalp
Safe Trend Scalp is an automatic robot that trades with automatic Trend lines that ea crated with market history.
 Cross
Cross
Candle Cross above or below Conditions