당사 팬 페이지에 가입하십시오

Trend analysis index - improved - MetaTrader 5용 지표

- 조회수:
- 11098
- 평가:
- 게시됨:
- 업데이트됨:
-
 이 코드를 기반으로 한 로봇이나 지표가 필요하신가요? 프리랜스로 주문하세요
프리랜스로 이동
이 코드를 기반으로 한 로봇이나 지표가 필요하신가요? 프리랜스로 주문하세요
프리랜스로 이동
Theory:
In his article "The Derivative Moving Average" (back in 1996), Adam White describes what he called TAI (Trend Analysis Index) indicator as a basis for trade entries. Quite frankly it is obvious that at that time the computers and market data were rare, since the indicator is, in the form it is originally imagined and described, not usable for trading. For two main reasons:
- it is using some sort of fixed levels as a criteria, and that, since it is based on moving average differences, simply can not work on all the symbols and all the time frames;
- the values displayed by it are very often simply wrong : it is showing rising values in down market (but not all the time), falling values in rising market (but not all the time) so, very often it is simply showing what looks like a random market assessment.
This version:
It is trying to fix those two major issues described. It is introducing floating levels (which, since floating levels always adapt to values, makes the level closest to usable) and it changes the calculation differently - the calculation mode change is not big, but is significant (produced values wise), and since the change of the code is not big, the original name of the indicator is kept. Perhaps if, at the time of creation, the original creator of it had the tools and the means we have today, he would have made the necessary changes too.
The results are not perfect (none of the indicators are :)), but are far from the erratic results of the original, and now they seem to be usable in trading too.
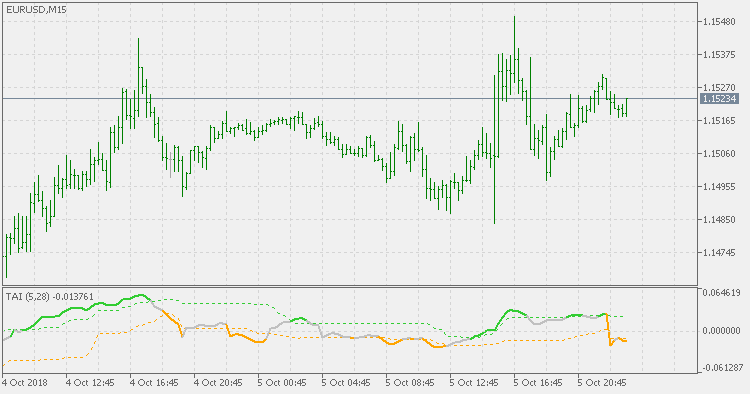
Usage:
You can use the color changes as signals for entries and re-entries, as well as exits.
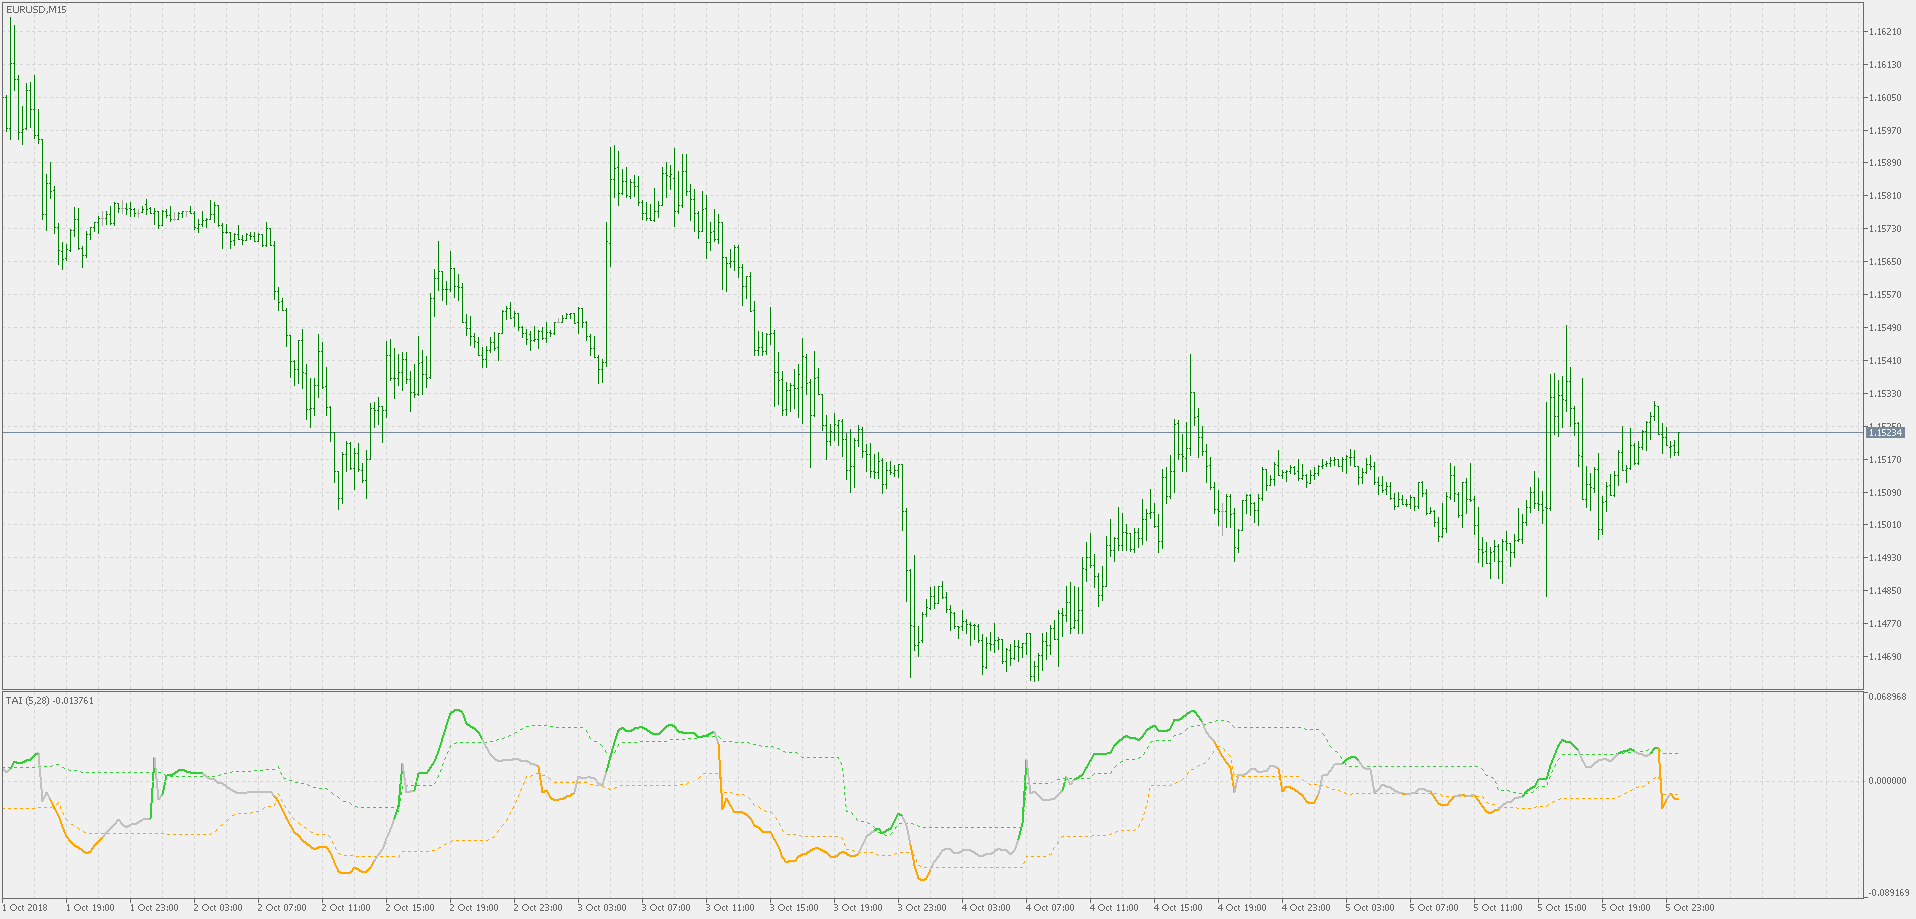
PS:
A "big picture example" (and a reason for stating that it is becoming usable now). Some experimenting is advised, but seems that we are on a track of one more tool that can be used for trading.
Ehlers fisher transform of rsi(OMA)
Ehlers fisher transform of rsi(OMA)
Ehlers fisher transform of smoother RSI
Ehlers fisher transform of smoother RSI
BB Stops - multiple stops
BB Stops - multiple stops
BB stops JMA - multiple stops
BB stops JMA - multiple stops