당사 팬 페이지에 가입하십시오

Money-Meter - MetaTrader 5용 지표

- 조회수:
- 12135
- 평가:
- 게시됨:
-
 이 코드를 기반으로 한 로봇이나 지표가 필요하신가요? 프리랜스로 주문하세요
프리랜스로 이동
이 코드를 기반으로 한 로봇이나 지표가 필요하신가요? 프리랜스로 주문하세요
프리랜스로 이동
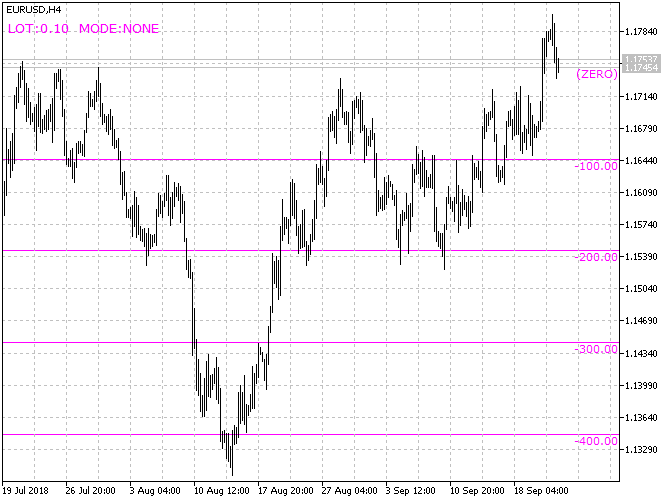
The indicator measures money on a chart.
Why do we need it?
Conventional MetaTrader charts are usually measured in points making it difficult to quickly convert them into money when you need to evaluate a position lot (or several lots).
Of course, you can calculate in your mind or use a calculator.
However, this is not always convenient. Besides, traders usually set lots by rule of thumb, rather than applying certain numbers. Sometimes, they even do not calculate risks for the applied volume.
What does this indicator do?
The indicator displays cost levels above and below a selected zero level.
What are cost levels?
This is the amount of funds that will be lost or added to the account if you open a position with a specified lot from the zero level.
What is a zero level?
By default, the indicator starts calculation from the current price, but if you enter the price in the zero_price parameter, it will calculate from that price.
What other parameters does the indicator have?
- grid_step_value – grid step in the deposit currency
- lot_size – working lot for virtual position
- lot_divider – lot divider (divides volume by the specified value)
- total_levels – how many levels to draw up and down
- zero_price – price to be used as a zero level
- progression – progression type (see below)
- multiplicator – multiplier for progression
- lines_color – grid lines color
- lines_width – grid lines width
- lines_style – grid lines style
- lines_prices – displaying grid level price on the price scale
- text_shift_bars – shift captions left/right according to the number of bars
How to apply this all?
Select the lot_size working lot for the future position and set the grid step in money grid_step_value. The indicator shows levels when position gains the appropriate profit or loss (excluding swaps and commissions). This means, each grid level forms addition or subtraction of a specified grid_step_value to a position. Each level is signed, thus, it clearly shows how much you can lose or earn if the price reaches the appropriate level.
What is lot_divider parameter needed for?
For some brokers with non-standard contracts. For example, there is one well-known broker setting a point price 100 000 times higher than what it should be. Therefore, you need to specify this number as a divisor of the lot_divider volume in order to correct the calculations.
Why do you need a 'progression' parameter?
By default, the indicator counts the profit/loss for one position of a specified volume, and the progression allows estimating the amount of profits/losses. Consecutive additions at each grid level help to quickly assess the overall depth of the drawdown for a series of averaging positions or the total profit for pyramiding.
What progressions do we have here?
- nonе – no progressions
- equal – equal volume positions
- linear – volumes grow linearly as a natural series
- fibo – volumes grow by Fibo numbers
- martin – geometric progression with the 'multiplicator' multiplier
What are the indicator signals?
The indicator provides no signals. It is needed for rapid risk assessment before opening a position.
How to assess risks for already open positions?
You may use another indicator for that: Smart-Calculator.
How does it look like?
MetaQuotes Ltd에서 러시아어로 번역함.
원본 코드: https://www.mql5.com/ru/code/22071
 Exp_XDeMarker_Histogram_Vol
The trading system based on XDeMarker_Histogram_Vol indicator signals
BBS
Bar Based Stochastic indicator
 UniMagicNumber
The library allows receiving a magic number bound to three elements: symbol name, timeframe and prefix index.
XDeMarker_Histogram_Vol_Direct
XDeMarker_Histogram_Vol indicator shows direction of the histogram bars movement using colored icons on these bars