당사 팬 페이지에 가입하십시오

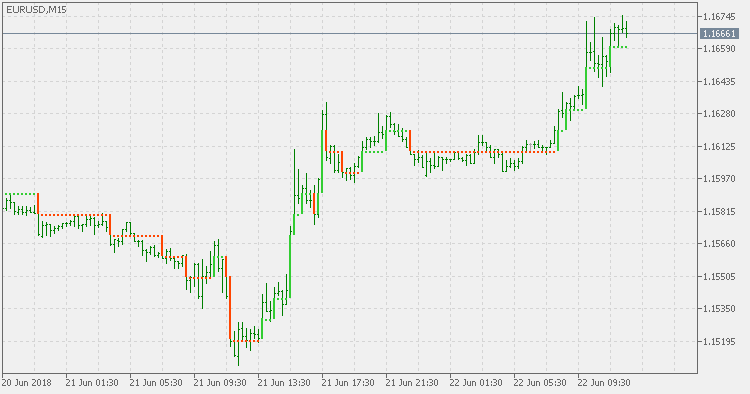
Step Chart - MetaTrader 5용 지표

- 조회수:
- 9139
- 평가:
- 게시됨:
- 업데이트됨:
-
 이 코드를 기반으로 한 로봇이나 지표가 필요하신가요? 프리랜스로 주문하세요
프리랜스로 이동
이 코드를 기반으로 한 로봇이나 지표가 필요하신가요? 프리랜스로 주문하세요
프리랜스로 이동
Step Chart indicator monitors the price change (in pips) and according to that, determines if a new "step" has been made or not.
Volatility Pivot
Volatility Pivot indicator calculates "pivots" (support/resistance lines) based on current symbol/timeframe Average True Range calculated volatility.
Dollar Index Candles
Compared to the Dollar Index indicator, this version is a bit different: instead of showing just one value, it is displaying the "open", "close", "high" and "low" of dollar index as candles in a separate window. That way you can see the volatility of the dollar index intra bar change too and it displays values closer to our normal assumption how the index is formed.
Step Chart Histogram
Compared to the Step Chart indicator, this version displays the values in a separate window as a histogram (as a sort of a help to see the trend changes in an easier way).
Step Chart Separate
Compared to the Step Chart indicator, this version displays the values in a separate window (as a sort of a help to see the trend changes in an easier way).